

Using principles of motor control to analyze performance of human machine interfaces
- PMID: 37582852
- PMCID: PMC10427694
- DOI: 10.1038/s41598-023-40446-5
Using principles of motor control to analyze performance of human machine interfaces
Abstract
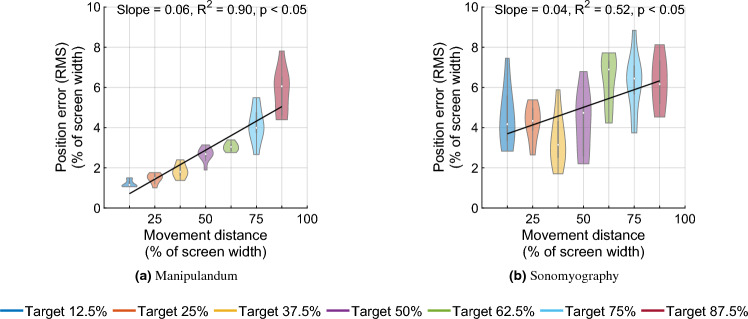
There have been significant advances in biosignal extraction techniques to drive external biomechatronic devices or to use as inputs to sophisticated human machine interfaces. The control signals are typically derived from biological signals such as myoelectric measurements made either from the surface of the skin or subcutaneously. Other biosignal sensing modalities are emerging. With improvements in sensing modalities and control algorithms, it is becoming possible to robustly control the target position of an end-effector. It remains largely unknown to what extent these improvements can lead to naturalistic human-like movement. In this paper, we sought to answer this question. We utilized a sensing paradigm called sonomyography based on continuous ultrasound imaging of forearm muscles. Unlike myoelectric control strategies which measure electrical activation and use the extracted signals to determine the velocity of an end-effector; sonomyography measures muscle deformation directly with ultrasound and uses the extracted signals to proportionally control the position of an end-effector. Previously, we showed that users were able to accurately and precisely perform a virtual target acquisition task using sonomyography. In this work, we investigate the time course of the control trajectories derived from sonomyography. We show that the time course of the sonomyography-derived trajectories that users take to reach virtual targets reflect the trajectories shown to be typical for kinematic characteristics observed in biological limbs. Specifically, during a target acquisition task, the velocity profiles followed a minimum jerk trajectory shown for point-to-point arm reaching movements, with similar time to target. In addition, the trajectories based on ultrasound imaging result in a systematic delay and scaling of peak movement velocity as the movement distance increased. We believe this is the first evaluation of similarities in control policies in coordinated movements in jointed limbs, and those based on position control signals extracted at the individual muscle level. These results have strong implications for the future development of control paradigms for assistive technologies.
© 2023. Springer Nature Limited.
Conflict of interest statement
The authors declare no competing interests.
Figures


Update of
-
Using Principles of Motor Control to Analyze Performance of Human Machine Interfaces.Res Sq [Preprint]. 2023 May 16:rs.3.rs-2763325. doi: 10.21203/rs.3.rs-2763325/v1. Res Sq. 2023. Update in: Sci Rep. 2023 Aug 15;13(1):13273. doi: 10.1038/s41598-023-40446-5. PMID: 37292730 Free PMC article. Updated. Preprint.
Similar articles
-
Using Principles of Motor Control to Analyze Performance of Human Machine Interfaces.Res Sq [Preprint]. 2023 May 16:rs.3.rs-2763325. doi: 10.21203/rs.3.rs-2763325/v1. Res Sq. 2023. Update in: Sci Rep. 2023 Aug 15;13(1):13273. doi: 10.1038/s41598-023-40446-5. PMID: 37292730 Free PMC article. Updated. Preprint.
-
Sonomyography shows feasibility as a tool to quantify joint movement at the muscle level.IEEE Int Conf Rehabil Robot. 2022 Jul;2022:1-5. doi: 10.1109/ICORR55369.2022.9896582. IEEE Int Conf Rehabil Robot. 2022. PMID: 36176162 Free PMC article.
-
Sonomyography Combined with Vibrotactile Feedback Enables Precise Target Acquisition Without Visual Feedback.Annu Int Conf IEEE Eng Med Biol Soc. 2020 Jul;2020:4955-4958. doi: 10.1109/EMBC44109.2020.9176524. Annu Int Conf IEEE Eng Med Biol Soc. 2020. PMID: 33019099 Free PMC article.
-
Controlling Upper Limb Prostheses Using Sonomyography (SMG): A Review.Sensors (Basel). 2023 Feb 8;23(4):1885. doi: 10.3390/s23041885. Sensors (Basel). 2023. PMID: 36850483 Free PMC article. Review.
-
The extraction of neural information from the surface EMG for the control of upper-limb prostheses: emerging avenues and challenges.IEEE Trans Neural Syst Rehabil Eng. 2014 Jul;22(4):797-809. doi: 10.1109/TNSRE.2014.2305111. Epub 2014 Feb 11. IEEE Trans Neural Syst Rehabil Eng. 2014. PMID: 24760934 Review.
References
-
- Zhu M, He T, Lee C. Technologies toward next generation human machine interfaces: From machine learning enhanced tactile sensing to neuromorphic sensory systems. Appl. Phys. Rev. 2020;7:031305. doi: 10.1063/5.0016485. - DOI
-
- Vuletic T, et al. Systematic literature review of hand gestures used in human computer interaction interfaces. Int. J. Hum Comput Stud. 2019;129:74–94. doi: 10.1016/j.ijhcs.2019.03.011. - DOI
-
- Hramov AE, Maksimenko VA, Pisarchik AN. Physical principles of brain-computer interfaces and their applications for rehabilitation, robotics and control of human brain states. Phys. Rep. 2021;918:1–133. doi: 10.1016/j.physrep.2021.03.002. - DOI
