. 2023 Aug 15;14(1):4909.
doi: 10.1038/s41467-023-40555-9.

Spatial transcriptomics reveal markers of histopathological changes in Duchenne muscular dystrophy mouse models

Affiliations

Spatial transcriptomics reveal markers of histopathological changes in Duchenne muscular dystrophy mouse models

L G M Heezen et al. Nat Commun. .

Abstract

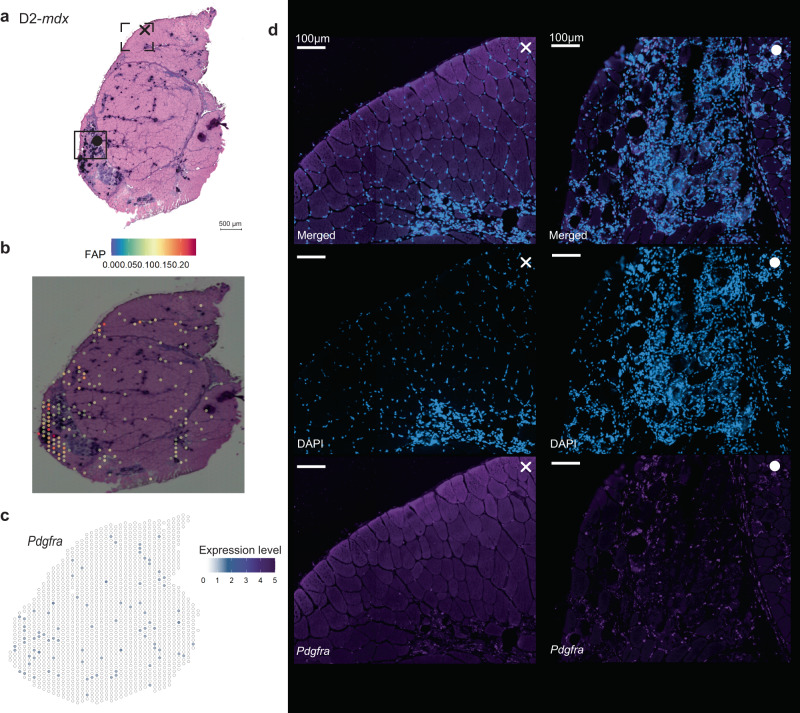
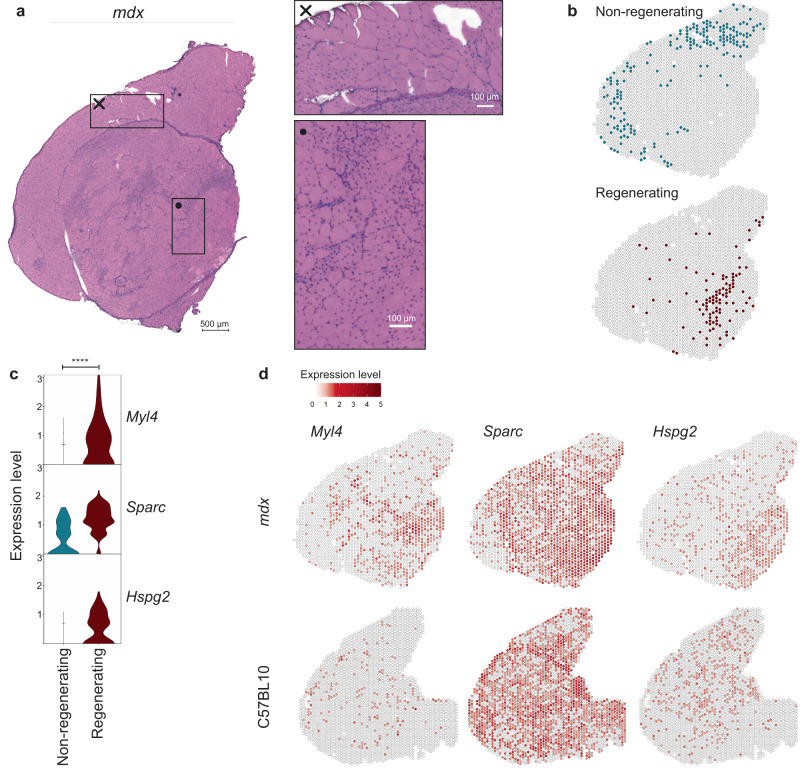
Duchenne muscular dystrophy is caused by mutations in the DMD gene, leading to lack of dystrophin. Chronic muscle damage eventually leads to histological alterations in skeletal muscles. The identification of genes and cell types driving tissue remodeling is a key step to developing effective therapies. Here we use spatial transcriptomics in two Duchenne muscular dystrophy mouse models differing in disease severity to identify gene expression signatures underlying skeletal muscle pathology and to directly link gene expression to muscle histology. We perform deconvolution analysis to identify cell types contributing to histological alterations. We show increased expression of specific genes in areas of muscle regeneration (Myl4, Sparc, Hspg2), fibrosis (Vim, Fn1, Thbs4) and calcification (Bgn, Ctsk, Spp1). These findings are confirmed by smFISH. Finally, we use differentiation dynamic analysis in the D2-mdx muscle to identify muscle fibers in the present state that are predicted to become affected in the future state.


Conflict of interest statement

The authors declare no competing interests.

Figures

Fig. 1
Fig. 1. Characterizing muscle tissue in DMD and wildtype mouse models using spatial transcriptomics.
(left) the HE stained section, (middle) displays the Visium spots spatially plotted and colored by cluster, and (right) a tSNE map of the Visium spots colored by cluster for (a) C57BL10, (b) DBA/2J, (c) mdx and (d) D2-mdx.
Fig. 2
Fig. 2. BTX staining in a consecutive section of the DBA/2J Visium sample.
a BTX staining on a consecutive DBA/2J section, co-stained for DAPI and laminin with a zoomed-in region displaying several brightly stained NMJs. b The Visium spots that were included in the NMJ cluster overlap with the (c) BTX isolated signal on the Visium HE stained image (purple and blue highlighted regions).
Fig. 3
Fig. 3. Deconvolution of the spatial data using a snRNAseq reference dataset reveals enrichment of cell types in different mouse models and specific clusters.
a UMAP of the reference dataset including the following cell types: endothelial cells (EC), fibro/adipogenic progenitors (FAP), type IIa myonuclei (IIa), type IIb myonuclei (IIb), type IIx myonuclei (IIx), type IIx_b myonuclei (IIx_b), macrophages (MPH), myotendinous junction myonuclei (MTJ), muscle satellite cells (MuSC), myoblasts (Myob), neuromuscular junction myonuclei (NMJ), regenerative myonuclei (RegMyon), smooth muscle cells (SMC) and tenocytes (TC). b The average percentage of cell type contribution per spot in the four mouse models. c Deconvolution of the “connective tissue” cluster from C57BL10 showing marker genes Col1a2, Col1a1 and Fmod and a stacked barplot displaying the average percentage of contributing cell types to this cluster with an enrichment for MTJ and TC. d Deconvolution of the “neuromuscular junction” cluster from DBA/2J plotted marker genes Mpz, Pmp22 and Chrne and a stacked barplot displaying the average percentage of contributing cell types to this cluster with an enrichment for NMJ. e Deconvolution of the “necrotic fibers and macrophages” cluster from mdx, with marker genes Cd68, Tnfrs1a and Tnfrs1b and a stacked barplot displaying the average percentage of contributing cell types to this cluster with an enrichment for MPH and TC. f Deconvolution of the “inflamed and/or calcified fibers” cluster from D2-mdx, with marker genes Cd68, Cd14 and Tgfbi and a stacked barplot displaying the average percentage of contributing cell types to this cluster with an enrichment for MPH.
Fig. 4
Fig. 4. A comparison of FAP cells presence between the deconvolution results and smFISH (RNAscope) validation on the D2-mdx.
a D2-mdx model with the indications to the approximate location of zoomed-in smFISH images. b Location of FAPs based on spot deconvolution. c Pdgfra, marker gene for FAPs, expression pattern based on Visium data (d) smFISH results in two regions that confirm the absence (cross) and presence (filled dot) of FAPs as was expected based on the spot deconvolution results. All scale bars in the immunofluorescent images represent 100 µm.
Fig. 5
Fig. 5. Identifying biomarkers of muscle regeneration in the mdx mouse model.
a HE stained mdx quadriceps sample with two zoomed-in areas, the cross displaying an area of muscle fibers without centralized nuclei (CN) which are thought to be not regenerated yet, the dot showing an area of recently regenerated or regenerating muscle fibers. b Selected spots belonging to the categories “non-regenerating” or “regenerating” were compared for differential gene expression analysis. c Expression levels of selected genes Myl4, Sparc and Hspg2 in the two categories with an enrichment in the “regenerating” spots in the mdx model (**** representing a p value < 0.0001). The adjusted p values were: 5.5e−17 (Myl4), 5.6e−16 (Sparc) and 1.8e−15 (Hspg2) respectively. d Spatially plotted expression of Myl4, Sparc and Hspg2 in mdx and C57BL10 muscle. Note: expression values should not be compared across models.
Fig. 6
Fig. 6. Differential expression analysis in D2-mdx calcified and fibrotic tissue displays upregulated molecular markers.
a HE stained D2-mdx QUA sample with three zoomed-in areas, the cross displaying fibrotic infiltration between the myofibers, the dot showing part of the connective tissue sheet with surrounding inflammation, calcification and fibrotic infiltration and the triangledisplaying the most severely affected area of the muscle section with extensive calcification, inflammation and necrosis. b Selected spots belonging to the categories “non-fibrotic” or “fibrotic” as well as (c) “noncalcified” and “calcified” were included in the differential gene expression analysis. d Violin plot showing expression levels of selected genes Vim, Fn1 and Thbs4 which were significantly upregulated in the “fibrotic” spots in the D2-mdx model. e Spatially plotted expression of Vim, Fn1 and Thbs4 in D2-mdx and DBA/2J muscle (**** representing a p value < 0.0001). The adjusted p-values were: 1.7e−10 (Vim), 1.8e−16 (Fn1) and 1.5e−16 (Thbs4), respectively. f Expression levels of selected genes Bgn, Ctsk and Spp1, which were significantly upregulated in the “calcified” spots compared to the “non-calcified” spots in the D2-mdx model (**** representing a p value < 0.0001). The exact adjusted p-values were: 1.4e−38 (Bgn), 1.8e−29 (Ctsk) and 5.8e−50 (Spp1), respectively. g Expression of the selected genes Bgn, Ctsk and Spp1 spatially plotted in the D2-mdx and its genetic background matching DBA/2J wildtype. Note: expression values should not be compared across models.
Fig. 7
Fig. 7. Validation of marker genes using smFISH (RNAscope).
a Visualized areas of smFISH experiment and matching locations in the HE-stained Visium sections. b Expression of Myl4, a marker of regeneration. c Expression of Thbs4, a marker of fibrosis. d Expression of Ctsk, a marker of calcification.
Fig. 8
Fig. 8. RNA velocity applied on D2-mdx muscle shows differentiation patterns in severely affected muscle tissue which is driven by known cell types such as FAPs and macrophages.
a Annotated clusters of D2-mdx as described before (b) Proportion of spliced/unspliced counts in the D2-mdx sample per annotated cluster. c Spatial spot-level RNA velocity vectors showing clear differentiation at the severely affected spatial region (box with cross). d Magnitude of the RNA velocity at each spot. e Summary of the top contributing genes (absolute count and percentage of positive spots) to the differentiation patterns of the severely affected spots (Inflamed and/or calcified fibers). f Expression of these top genes in cell types from a reference dataset.

References

    1. Mendell JR, Lloyd-Puryear M. Report Of MDA Muscle Disease Symposium On Newborn Screening For Duchenne Muscular Dystrophy. Muscle Nerve. 2013;48:21–26. - PubMed
    1. Bladen CL, et al. The TREAT-NMD DMD global database: Analysis of more than 7,000 duchenne muscular dystrophy mutations. Hum. Mutat. 2015;36:395–402. - PMC - PubMed
    1. Hoffman EP, Brown RH, Kunkel LM. Dystrophin: The protein product of the duchenne muscular dystrophy locus. Cell. 1987;51:919–928. - PubMed
    1. Le Rumeur E, Winder SJ, Hubert JF. Dystrophin: More than just the sum of its parts. Biochim. et. Biophys. Acta - Proteins Proteom. 2010;1804:1713–1722. - PubMed
    1. Ervasti JM. Dystrophin, its interactions with other proteins, and implications for muscular dystrophy. Biochim. et. Biophys. Acta - Mol. Basis Dis. 2007;1772:108–117. - PubMed

Publication types