. 2023 Aug 15;6(1):846.
doi: 10.1038/s42003-023-05215-0.

Sexual dimorphism in the social behaviour of Cntnap2-null mice correlates with disrupted synaptic connectivity and increased microglial activity in the anterior cingulate cortex

Affiliations

Sexual dimorphism in the social behaviour of Cntnap2-null mice correlates with disrupted synaptic connectivity and increased microglial activity in the anterior cingulate cortex

Matt S Dawson et al. Commun Biol. .

Abstract

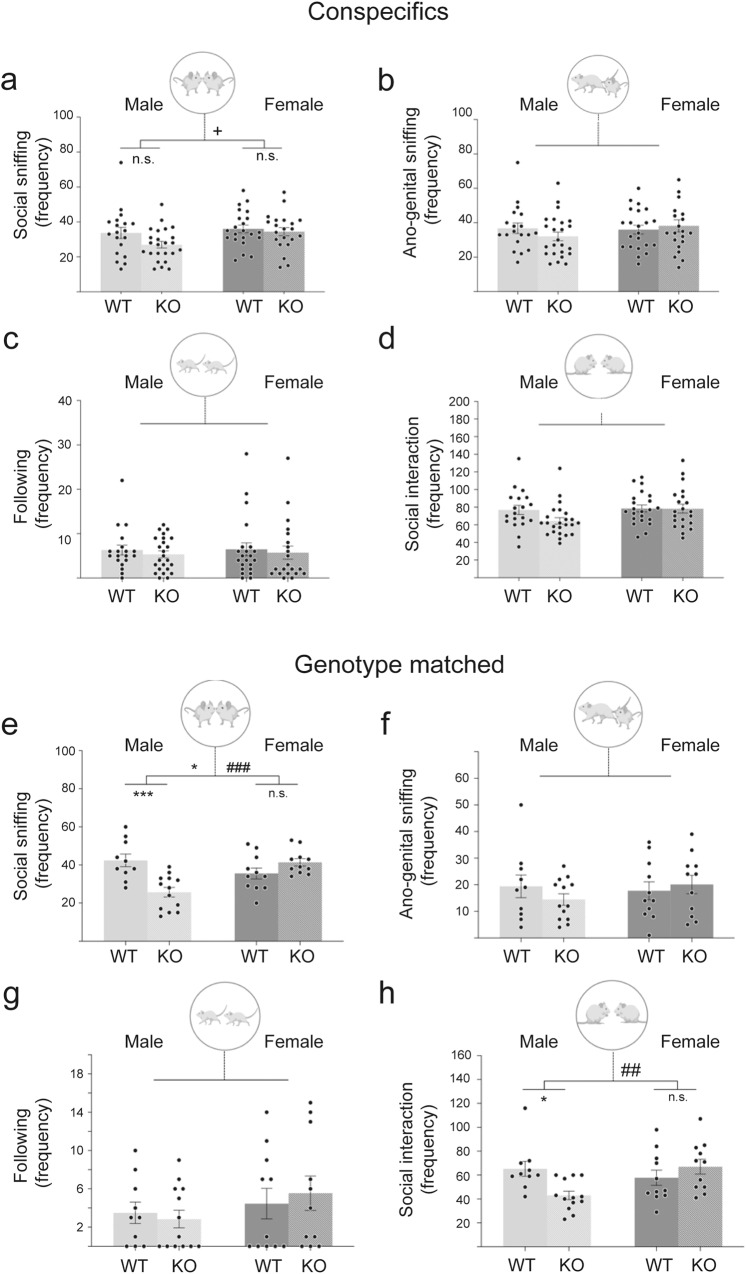
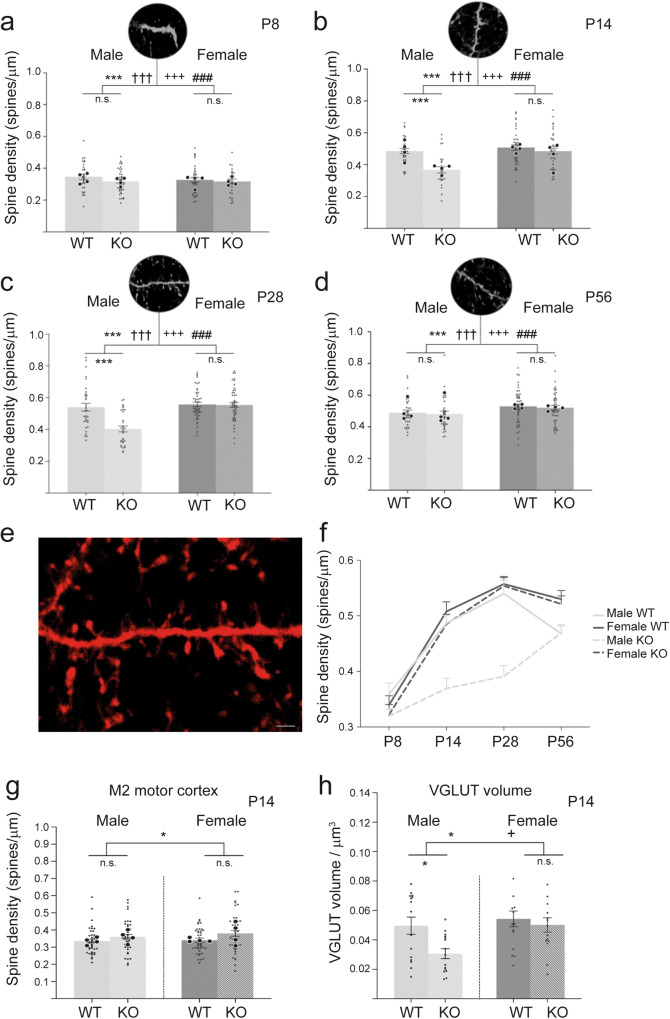
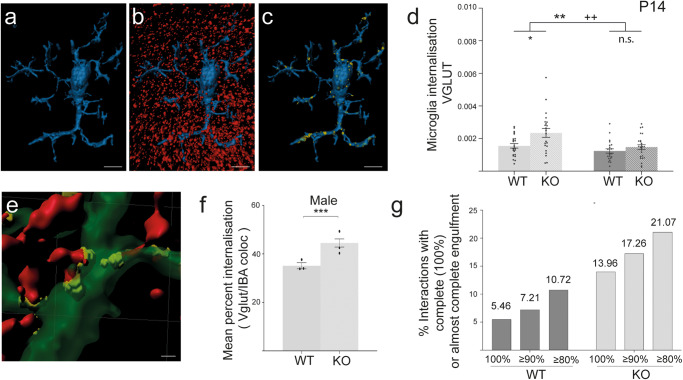
A biological understanding of the apparent sex bias in autism is lacking. Here we have identified Cntnap2 KO mice as a model system to help better understand this dimorphism. Using this model, we observed social deficits in juvenile male KO mice only. These male-specific social deficits correlated with reduced spine densities of Layer 2/3 and Layer 5 pyramidal neurons in the Anterior Cingulate Cortex, a forebrain region prominently associated with the control of social behaviour. Furthermore, in male KO mice, microglia showed an increased activated morphology and phagocytosis of synaptic structures compared to WT mice, whereas no differences were seen in female KO and WT mice. Our data suggest that sexually dimorphic microglial activity may be involved in the aetiology of ASD, disrupting the development of neural circuits that control social behaviour by overpruning synapses at a developmentally critical period.


Conflict of interest statement

The authors declare no competing interests.

Figures

Fig. 1
Fig. 1. Behavioural deficits of juvenile male Cntnap2 KO mice for frequency of interactions.
Juvenile mice were analysed in a social interaction assay, in which a test mouse (Cntnap2 KO or WT mice of either sex) was placed in a novel cage, and a sex-matched juvenile conspecific C57BL/6J mouse (ad) or an age-, sex- and genotype-matched conspecific (eh) was added. Specifically, social interaction with conspecifics was carried out at P34, and with genotype-matched mice at P38. The frequency of their interaction was scored for 10 min for social sniffing (a, e), anogenital sniffing (b, f) or following (c, g). The total interaction frequencies are given in (d, h). Single data points represent individual mice. Statistical analysis was performed using two-way ANOVA. Symbols above the bars represent an overall effect of genotype (*), sex (+) or interaction (#), while symbols below the chart represent Tukey’s post hoc significance between WT and Cntnap2 KO (*). In each case 1, 2 or 3 symbols represents P < 0.05, P < 0.01, or P < 0.001. Juvenile male KO mice show significantly reduced frequency of social sniffing (e) and total social interaction (h), compared to WT mice. Data presented as means, error bars represent SEM. For (ad): n = 20-26/group, for (eh): n = 10–13/group. Full two-way ANOVA results can be seen in Supplementary Data 1. Mouse images from Biorender.
Fig. 2
Fig. 2. Similar percentages of tdTomato-positive projection neurons are found in L2/3 and L5 of the ACC of WT and Cntnap2 KO mice.
a Coronal section of the prefrontal cortex from a Grp:cre, tdTomato+ mouse at P14, highlighting the location of the ACC, and the position of TOM+ cells in the respective layers. b A representative coronal section shows staining of the ACC with an anti-CUX-1 antibody (for layer 2/3 projection neurons; green); TOM+ cells (red), and DAPI (all cell nuclei, blue). c The percentage of TOM+ cells, and of CUX-1+ cells, which colocalize with DAPI (all cells), is similar between WT and KO. d The percentage of TOM+ cells colocalising with CUX-1+ cells is similar between WT and KO mice. e Layer 5 projection neurons stained for CTIP2 (green), combined with DAPI staining (blue), and TOM+ cells (red). f Percentages of TOM+ and CTIP2+ cells colocalising with DAPI (all cells) are similar between WT and KO. g Roughly 9% of CTIP2-positive cells are TOM+ cells in both WT and KO. Percentages in charts represent means. Error bars represent SEM. WT: n = 4; KO: n = 4. CC corpus callosum. Scale bar in a = 100 μm, in b, c = 50 μm. Details of statistical analyses are shown in Supplementary Data 2.
Fig. 3
Fig. 3. Transient reduction in dendritic spine density in the ACC of male—but not female—Cntnap2 KO mice.
Spine densities in layer 1 of the ACC of Cntnap2 KO and WT mice from male and female populations were analysed at four developmental timepoints P8, P14, P28 and P56. a At P8, no reduction in spine density was observed between WT and KO for both sexes, with male WT (light grey) and male Cntnap2 KO (striped, light grey), and female WT (grey) and female Cntnap2 KO (stripped, grey). b, c At P14 and P28, a reduction in spine densities was observed for male KO compared to male WT, and no changes between female KO and female WT. d At P56, no reduction in spine densities was observed between WT and KO for both sexes. e Representative images of dendrites and post-synaptic spines made visible using the Grp-Cre+; tdTomato+ mouse model which labels a subpopulation of pyramidal cells in the ACC (see this Fig.). White triangles indicate counted spines. a: male WT; b: male KO; c: female WT; d: female KO. f Overview of the spine densities of WT and KO mice of both sexes at the four different timepoints. g No differences in spine densities at P14 in L1 of the secondary motor cortex between WT (grey) and Cntnap2 KO (striped, light grey) mice of both sexes. h Density of pre-synaptic boutons (visualised by staining for VGLUT-1) at P14 in WT and KO mice of both sexes. A significant reduction in pre-synapse density was observed in male KO vs. male WT mice, but not between female KO and female WT mice. n = 3 KO, n = 3 WT for each timepoint and sex. For spine densities, a total of 29 to 48 dendrites were counted for each group. Larger dots represent mean spine density for individual brains, smaller dots the densities of individual dendrites. If not otherwise indicated, in all experiments, n = 4 KO, n = 4 WT for each timepoint and sex. Scale bar in (e) = 1 μm. Statistical analysis for (ad) was performed using three-way ANOVA, although to reduce complexity, the data are presented by age. Statistical analysis for (g, h) was via two-way ANOVA. Symbols above the bars represent an overall effect of genotype (*), sex (+), age (†) or interaction (#), while symbols below the chart represent Tukey’s post hoc significance between WT and Cntnap2 KO (*). In each case 1, 2 or 3 symbols represent P < 0.05, P < 0.01, or P < 0.001. Error bars represent SEM.
Fig. 4
Fig. 4. No major differences in the expression of CASPR2 between male and female WT mice.
a Western blot analysis of lysates from the dorsal prefrontal cortex (dPFC) of P28 WT mice show no major differences in the expression of CASPR2 between male and female (upper part). The expression of MAPK (lower part) was used as a loading control to normalise CASPR2 expression levels. No CASPR2 specific bands were detected in the dPFC from P28 Cntnap2 KO mice. b Quantification shows no statistically significant difference in expression levels of CASPR2 protein between male and female WT dPFC brains. Statistical analysis was done using an unpaired two-tail t test (t = 0.34, df = 6). Male and females: n = 4 for (labelled 1–4 in (a)). Data are represented as means, error bars represent SEM. Uncropped and unedited blot images are shown as Supplementary Fig. 4.
Fig. 5
Fig. 5. Microglia in male Cntnap2 KO mice show an altered morphology compared to those in male WT mice, with no differences between female WT and KO mice.
Microglial morphologies were investigated in layer 1 of the ACC of WT and Cntnap2 KO male and female mice at different ages. a Representative images of microglial surfaces reproduced in Imaris. b Total number of microglial branch points. At both P8 and P14, male KOs had significantly fewer branch points in their processes than WT mice. There were no differences in the female populations. c Total dendritic length of all processes. At P8, male KOs had significantly reduced total lengths of microglial processes compared to WT mice. There were no differences in the female populations. d Number of microglial primary processes. At both P8 and P14, male KOs had significantly fewer primary processes than WT mice. There were no differences in the female populations. e Total microglial volume. There were no differences in the male or female populations. For all microglial morphology experiments, n = 4 for KO, and n = 4 for WT, for each timepoint and sex. Three to four slices were analysed per mouse. Statistical analysis for (bf) was performed using three-way ANOVA. For microglial cell density the data is presented by sex in individual charts to reduce complexity. f qPCR analysis shows an increased expression of the microglial phagocytosis receptor P2Y6 in male KO mice compared to male WT mice. Large dots represent results from three independent qPCR experiments in which all four conditions (male and female, WT and KO) were analysed in parallel (on the same 96-well plate). The small dot represents individual results from 5 to 6 independent brain preparations of the dPFC of P14 mice (see also 'Methods'). Statistical analysis for (f) was performed using two-way ANOVA. Scale bar in (a) = 10 μm. Symbols above the bars represent an overall effect of genotype (*), sex (+), age (†) or interaction (#), while symbols below the chart represent Tukey’s post hoc significance between WT and Cntnap2 KO (*). In each case 1, 2 or 3 symbols represent P < 0.05, P < 0.01, or P < 0.001. Data presented as means, error bars represent SEM. Microglia images from Biorender.
Fig. 6
Fig. 6. Microglial engulfment of pre-synapses is more extended in male than female Cntnap2 KO mice.
The colocalisation of microglia (α-IBA stain) and pre-synapses (α-VGLUT-1 stain) in layer 1 of the ACC was analysed for P14 WT and Cntnap2 KO male and female populations. ac Representative images of microglia surface rendering (blue) (a), pre-synapse (red) and microglia surface (blue) rendering (b), and colocalisation between the two (yellow) (c). d Internalisation of pre-synapses by microglia, normalised to microglia size (volume) and pre-synaptic bouton density (volume). Microglia of male KO mice display a higher internalisation of pre-synapses than microglia of male WT mice. There was no difference for females. Each data point represents an individual microglia/synapse interaction. e Representative image of the volume of microglia (green), the volumes of whole pre-synapses (red), and the volumes of their colocalisation, i.e., presumed internalisation (yellow to yellow-greenish), which were used to calculate the percentage internalisation. f Mean percentage of individual internalised pre-synapses for male mice. Microglia in male KOs display a higher mean percentage internalisation than microglia in male WTs. g Categorisation of microglia/pre-synapse interactions based on different levels of engulfment (80–100%) shows an overall higher engulfment of pre-synapses in male KO mice compared to WT. For all experiments, n = 4 for KO, and n = 4 for WT, for each timepoint and sex. Three to four slices were analysed per mouse. Scale bars in (ac) = 10 μm, in (e) = 1 μm. Statistical analysis for (d) was performed using two-way ANOVA. Symbols above the bars represent an overall effect of genotype (*), sex (+), age (†) or interaction (#), while symbols below the chart represent Tukey’s post hoc significance between WT and Cntnap2 KO (*). Statistical analysis for (f) was analysed using an unpaired two-tail t test. In each case 1, 2 or 3 symbols represents P < 0.05, P < 0.01, or P< 0.001. Data presented as means, error bars represent SEM.

References

    1. Battle DE. Diagnostic and statistical manual of mental disorders (DSM) Codas. 2013;25:191–192. - PubMed
    1. Willsey HR, Willsey AJ, Wang B, State MW. Genomics, convergent neuroscience and progress in understanding autism spectrum disorder. Nat. Rev. Neurosci. 2022;23:323–341. doi: 10.1038/s41583-022-00576-7. - DOI - PMC - PubMed
    1. Roman-Urrestarazu A, et al. Association of race/ethnicity and social disadvantage with autism prevalence in 7 million school children in England. JAMA Pediatr. 2021;175:e210054. doi: 10.1001/jamapediatrics.2021.0054. - DOI - PMC - PubMed
    1. Loomes R, Hull L, Mandy WPL. What is the male-to-female ratio in autism spectrum disorder? A systematic review and meta-analysis. J. Am. Acad. Child Adolesc. Psychiatry. 2017;56:466–474. doi: 10.1016/j.jaac.2017.03.013. - DOI - PubMed
    1. Werling DM, Geschwind DH. Sex differences in autism spectrum disorders. Curr. Opin. Neurol. 2013;26:146–153. doi: 10.1097/WCO.0b013e32835ee548. - DOI - PMC - PubMed

Publication types