. 2023 Apr;2(4):399-416.
doi: 10.1038/s44161-023-00260-8. Epub 2023 Apr 6.

Defining cardiac functional recovery in end-stage heart failure at single-cell resolution

Affiliations

Defining cardiac functional recovery in end-stage heart failure at single-cell resolution

Junedh M Amrute et al. Nat Cardiovasc Res. 2023 Apr.

Abstract

Recovery of cardiac function is the holy grail of heart failure therapy yet is infrequently observed and remains poorly understood. In this study, we performed single-nucleus RNA sequencing from patients with heart failure who recovered left ventricular systolic function after left ventricular assist device implantation, patients who did not recover and non-diseased donors. We identified cell-specific transcriptional signatures of recovery, most prominently in macrophages and fibroblasts. Within these cell types, inflammatory signatures were negative predictors of recovery, and downregulation of RUNX1 was associated with recovery. In silico perturbation of RUNX1 in macrophages and fibroblasts recapitulated the transcriptional state of recovery. Cardiac recovery mediated by BET inhibition in mice led to decreased macrophage and fibroblast Runx1 expression and diminished chromatin accessibility within a Runx1 intronic peak and acquisition of human recovery signatures. These findings suggest that cardiac recovery is a unique biological state and identify RUNX1 as a possible therapeutic target to facilitate cardiac recovery.


Conflict of interest statement

Competing interests The authors declare no competing interests.

Figures
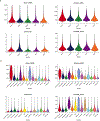
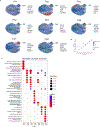
Extended Data Fig. 1 |
Extended Data Fig. 1 |. Quality control metrics.
nCount_RNA, nFeature_RNA, percent.mt, and scrublet doublet score split by (A) condition and (B) cell type.
Extended Data Fig. 2 |
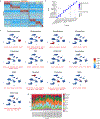
Extended Data Fig. 2 |. Global clustering.
(A) Heatmap of top10 marker gens for each cell type identified via DE analysis. (B) DotPlot for cell type gene set scores from (A) where the x-axis is cell type gene signature and y-axis is the cluster. (C) Gene set z-scores for top gene markers for each cell type plotted in the UMAP embedding. (D) Cell type composition for each of the patient samples.
Extended Data Fig. 3 |
Extended Data Fig. 3 |. Pseudobulk DE analysis to unravel cardiac recovery.
(A) Pseudobulk DE analysis in each cell type in 3 comparison groups: pre-LVAD HF vs donor, RR-post vs donor, and RR-post vs pre-LVAD HF. Red dots indicate statistically significant genes (adjusted p-value < 0.05). (B) Total number of statistically significant (adjusted p-value < 0.05 and log2FC > 0.58) per cell type in comparisons from (A). (C) Number of overlapping genes in five major cell populations which are up and down in the comparisons from (A). Red number is the number of cardiac recovery genes. P-values calculated using Wald test adjusted for multiple corrections.
Extended Data Fig. 4 |
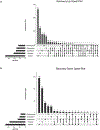
Extended Data Fig. 4 |. Cardiac recovery overlap amongst cell types.
UpSet plot showing overlap in cardiac recovery genes from (Fig. 2) in five major cell populations which are (A) up and (B) down in cardiac recovery.
Extended Data Fig. 5 |
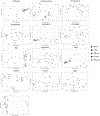
Extended Data Fig. 5 |. Cell-specific pseudobulk analysis.
Pseudobulk PCA analysis in each cell type colored by five conditions (donor, U-pre, U-post, RR-pre, and RR-post).
Extended Data Fig. 6 |
Extended Data Fig. 6 |. ABRA expression enriched in unloaded group.
(A) DotPlot of cardiomyocyte specific recovery up- and down signature grouped by CM cell states. (B) Density plot of ABRA expression in UMAP embedding. (C) DotPlot of ABRA expression in cardiomyocytes grouped by condition. (D) RNAscope images of ABRA in 5 conditions and scale bar is 100 um. (E) RNAscope images quantified across an array of patients. N = 37 biologically independent samples and p-values calculated using Wald test adjusted for multiple corrections; donor vs U-pre (*P = 0.023), U-pre vs RR-pre (***P < 0.0001), U-pre vs RR-post (***P = 0.0003), U-post vs RR-pre (***P = 0.0007), U-post vs RR-post (*P = 0.0188), and RR-pre vs RR-post (***P = 0.0007).
Extended Data Fig. 7 |
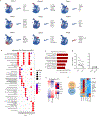
Extended Data Fig. 7 |. Macrophage diversity in recovery.
(A) Gene set z-scores for top gene markers for each cell state plotted in the UMAP embedding. (B) Enrich GO using compareclusters from cluster Prolifer across macrophage cell states. P-value calculated using Fisher exact test. (C) WikiPathways enriched in cardiac recovery. P-value calculated using Fisher exact test. (D) Paired comparison of Mac 2 cluster composition at patient level split by U and RR group from biologically independent samples. (E) DoRothEA TF enrichment analysis in U-post and RR-post zoomed in on some key differentially enriched TFs. (F) Overlap between Runx1 target genes and DE genes between U-pre and RR-pre with heatmap of respective genes split by condition.
Extended Data Fig. 8 |
Extended Data Fig. 8 |. Fibroblast diversity in recovery.
(A) Gene set z-scores for top gene markers for each cell state plotted in the UMAP embedding. (B) DotPlot for cell type gene set scores from (A) where the x-axis is cell type gene signature and y-axis is the cluster. (C) Enrich GO using compareclusters from cluster profiler across fibroblast cell states. P-value calculated using Fisher exact test.
Extended Data Fig. 9 |
Extended Data Fig. 9 |. CellOracle simulation in myeloid cells in TAC.
(A) Myeloid cell states, (B) Marker genes for cell states, (C) Cell state composition and cell density plots in TAC and TAC + JQ1, and (D) Cell oracle Runx1 KO perturbation score with vector field.
Extended Data Fig. 10 |
Extended Data Fig. 10 |. CellOracle simulation in fibroblasts in TAC.
(A) Fibroblast cell states, (B) Marker genes for cell states, (C) Cell state composition and cell density plots in TAC and TAC + JQ1, and (D) Cell oracle Runx1 KO perturbation score with vector field.
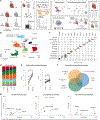
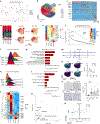
Fig. 1 |
Fig. 1 |. Study design, global clustering and DE analysis of cardiac remodeling after LVAD implantation.
a, Study design. b, Integrated UMAP embedding plot of snRNA-seq data across n = 40 samples and 185,881 nuclei. c, Violin plot for canonical marker genes for cell types. d, Cell cluster composition across conditions colored by cell type. e, Paired ejection fraction measured before and after LVAD implantation split by RR (left) and U (right) with n = 5 and 8 biologically independent samples. Paired two-tailed t-test where *P = 0.0134 (RR) and non-significant P = 0.1169 (U). f, Pseudobulk differential gene expression comparisons in cardiac remodeling after LVAD implantation categories. g, Number of statistically significant differentially expressed genes (adjusted P < 0.05 and log2 fold change > 0.58 from DEseq2) from f in each cell type as pairwise comparisons where size of dot refers to the sum of axis, and the color refers to the cell type. P values were calculated using the Wald test adjusted for multiple corrections. EF, ejection fraction; NK, natural killer; NS, non-significant.
Fig. 2 |
Fig. 2 |. Cell-type specific cardiac recovery.
a, Schematic of gene set from DE analysis that marks cardiac recovery. b, Number of statistically significant (adjusted P < 0.05 and log2 fold change > 0.58 from DESeq2) genes from pseudobulk DE analysis that are upregulated and downregulated in cardiac recovery across cell types. P values were calculated using the Wald test adjusted for multiple corrections. c, Pseudobulk heat maps of top genes upregulated (top) and downregulated (bottom) in cardiac recovery in major cell populations split by donor, HF pre-LVAD, reverse remodeled and unloaded. d, Overlapping genes between recovery predicted genes from bulk RNA sequencing in RR-pre and U-pre and pseudobulk cell-specific recovery genes. e, Number of unique and overlapping cardiac recovery genes in major cell populations. f, Pseudobulk expression of cardiac recovery genes that overlap among the major cell populations. g, Polygenic recovery score of upregulated and downregulated genes in cardiac recovery versus patient ejection fracrtion as a simple linear regression. Dotted line indicates 95% confidence interval; R2 indicates goodness of fit; and P value indicates whether the slope is significantly non-zero using an F-test. P values were calculated using two-tailed linear regression Wald test with t-distribution. EF, ejection fraction; NK, natural killer; SMC, smooth muscle cell.
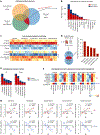
Fig. 3 |
Fig. 3 |. Cardiomyocytes do not revert to a healthy state in cardiac recovery.
a, Cardiomyocyte pseudobulk PCA representation of each patient sample colored by condition. b, UMAP embedding plot of cardiomyocytes. c, Heat map of marker genes for distinct cardiomyocyte cell states. d, Dot plot of gene set z-scores for the top ten genes in each cardiomyocyte cell state. e, Enriched GO pathways for cardiomyocyte cell states using statistically significant marker genes identified using a Wilcoxon rank-sum test (adjusted P < 0.05 and log2 fold change > 0.58). Dot size refers to gene ratio, and color of dots refers to the adjusted P value. P value was calculated using the Fisher exact test. f, Gaussian kernel density estimation of number of nuclei split by condition. g, Pseudobulk heat map of canonical genes up and down in HF split by condition. h, Fluorescence RNAscope in situ hybridization for MYH6 and NPPA in donor, pre-LVAD unloaded, pre-LVAD reverse remodeled, post-LVAD unloaded and post-LVAD reverse remodeled. Images are at ×10 magnification. i, Quantification of number cells per ×10 field for MYH6 and NPPA across the five conditions. P values were calculated using the Brown–Forsythe and Welch ANOVA tests comparing each condition to donor. For MYH6, n = 38 biologically independent samples and Brown–Forsythe ANOVA test F = 28.91, DFn = 4 and P < 0.0001; U-pre (***P = 0.001), U-post (**P = 0.0011), RR-pre (***P = 0.0004) and RR-post (**P = 0.0019) relative to donor. For NPPA, n = 38 biologically independent samples and Brown–Forsythe ANOVA test F = 6.040, DFn = 4 and P = 0.004; U-pre (***P = 0.0001), U-post (**P = 0.0033), RR-pre (non-significant P = 0.086) and RR-post (non-significant P = 0.1017) relative to donor. Error bars are mean ± s.e.m. j, Density plots of MYH6 and NPPA expression in UMAP embedding. k, Upregulated pseudobulk recovery signature ridge plot split across five conditions. l, Transcription factor protein–protein interactions for genes upregulated in recovery. m, Downregulated pseudobulk recovery signature ridge plot split across five conditions. n, Transcription factor protein–protein interactions for CM2 marker genes downregulated in cardiac recovery. PC, principal component.
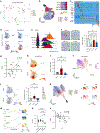
Fig. 4 |
Fig. 4 |. Pro-inflammatory macrophages and RUNX1 are diminished in reverse remodeling, whereas tissue resident macrophages show signs of recovery.
a, Myeloid pseudobulk PCA representation of each patient sample colored by condition. b, UMAP of myeloid cell states (left) and cell state composition across conditions (right). c, Heat map of marker genes for distinct myeloid cell states. d, Recovery upregulated signature in four conditions. e, Ridge plot of CD163 expression split by five conditions. f, RNAscope in situ hybridization of representative ×10 fields across conditions (left) and quantification of number of CD163+ cells per ×10 field (right) (n = 26). Donor versus pre-LVAD HF (***P = 0.0002), donor versus RR-post (non-significant P = 0.1251), donor versus U-post (**P = 0.0034), pre-LVAD HF versus RR-post (***P = 0.0001), pre-LVAD HF versus U-post (*P = 0.0256) and RR-post versus U-post (*P = 0.0108). g, Linear regression of CD163 pseudobulk expression and patient ejection fraction in pre and post cohorts. h, Nuclei density in unloaded pre-LVAD and reverse remodeled pre-LVAD. i, Mac2 composition in donors and pre-LVAD patients (n = 27). Donor versus U-pre (**P = 0.0067), U-pre versus RR-pre (**P = 0.0027) and donor versus RR-pre (non-significant P > 0.145). j, Inflammation score in U-pre and RR-pre (left) and quantified (right) (n = 27). U-pre versus RR-pre (*P = 0.0321), donor versus U-pre (non-significant P = 0.1006) and donor versus RR-pre (non-significant P = 0.1602). k, FDL plot of myeloid cell states with colors from b. l, Palantir pseudotime in FDL space with terminal states (Mac1, cDC2 and Mono2) (top) and nuclei split by four conditions (bottom). m, CHKA, PLAUR and RUNX1 gene expression along pseudotime (left) (shaded area indicating 1 s.d.) in FDL space (right). n, Pseudobulk RUNX1 expression in pre-LVAD HF, U-post and RR-post (n = 40), pre-LVAD HF versus U-post (non-significant P = 0.1177), donor versus RR-post and pre-LVAD HF versus RR-post (****P < 0.0001) and U-post versus RR-post (**P = 0.0058). o, Linear regression of RUNX1 pseudobulk expression and patient ejection fraction in pre and post cohorts. Dotted line indicates 95% confidence interval; R2 indicates goodness of fit; and P value indicates whether the slope is significantly non-zero using an F-test. P values were calculated using two-tailed linear regression Wald test with t-distribution in g and o. Error bars are mean ± s.e.m. in f, i and j. P values were calculated using unpaired t-test with Welch’s correction from biologically independent samples in f, i, j and n. EF, ejection fraction; NS, non-significant; PC, principal component.
Fig. 5 |
Fig. 5 |. RUNX1 is downregulated in fibroblasts in cardiac recovery.
a, Fibroblast pseudobulk sample PCA colored by condition. b, UMAP of fibroblast cell states. c, Heat map of marker genes for distinct fibroblast cell states. d, Cell composition of fibroblast cell states across five conditions (left) and nuclei density in four conditions (right). e, Pseudobulk expression heat map of canonical genes upregulated and downregulated in fibroblasts in HF across five conditions. Upregulated (f) and downregulated (h) pseudobulk recovery signature ridge plot split across five conditions. GO biological processes pathways enriched in recovery (g) and pathways down in recovery (i). j, Heat map of pseudobulk DE analysis between RR-pre and U-pre split across five conditions. k, Volcano plot of pathways enriched in unloaded group pre-LVAD implantation where each point is a gene set pathway, and the color of the points represents the degree of statistical significance. l, Transcription factors down in cardiac recovery from ENCODE/ ChEA consensus; x axis is transcription factors, and red dots are transcription factors that are statistically significant. Heat map showing expression of RUNX1 target genes across five conditions. m, PRO-seq coverage in unstimulated and TGF-β-treated in vitro fibroblasts (GSE15582) at the RUNX1 locus. n, Density plots of HF genes in UMAP embedding (left) and linear regression of RUNX1 pseudobulk expression and patient ejection fraction in pre and post cohorts (right). o. RNAscope in situ hybridization of representative ×10 fields from a donor, pre-LVAD HF, U-post and RR-post sample (left); n = 23 biologically independent samples and quantification of number of POSTN+ cells per ×10 field across the four conditions (right). P values were calculated using unpaired t-test with Welch’s correction. Donor versus pre-LVAD HF (**P = 0.0051). Error bars are mean ± s.e.m. p, Linear regression of RUNX1 pseudobulk expression in fibroblasts and inflammatory signature in macrophages in post-LVAD cohort. Dotted line indicates 95% confidence interval; R2 indicates goodness of fit; and P value indicates whether the slope is significantly non-zero using an F-test. P values were calculated using two-tailed linear regression Wald test with t-distribution in n and p. P values were calculated with Fisher exact test in g, i, k and l. BP, biological process; EF, ejection fraction; PC, principal component; TF, transcription factor.
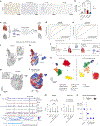
Fig. 6 |
Fig. 6 |. RUNX1 perturbation in silico and in vivo facilitates cardiac recovery.
a, RUNX1 RNAscope in situ hybridization across conditions. b, Quantification of a as proportion of positive interstitial nuclei/total interstitial nuclei per ×10 field. n = 37 biologically independent samples and unpaired t-test with Welch’s correction. *P = 0.0188, **P = 0.007 and ***P < 0.001. Error bars are mean ± s.e.m. c, Schematic of machine learning approach used to predict recovery in macrophages and fibroblasts with Runx1 target genes as features. ROC curves with accuracy metrics for test dataset in predicting recovery in macrophages (d) and fibroblasts (e) using a Keras deep neural net classifier model and an RF classifier. CellOracle in silico Runx1 KO simulation quiver plot of vector field in macrophages (f) and fibroblasts (g). Perturbation score with vector field in macrophages (h) and fibroblasts (i). j, Study design of external validation dataset. k, scRNA-seq and scATAC-seq UMAP embedding with cell labels from RNA sequencing label transferred onto ATAC-seq dataset using publicly available data (GSE15582). l, Mouse Runx1 locus showing from top to bottom: ChIP-seq for BRD4 (GSE46668) and H3K27ac (ENCSR000CDF) in adult mouse heart and scATAC-seq in mouse fibroblasts split by four conditions with called peaks (GSE15582) and peak2gene links from ArchR. Numbers above tract indicate ranges of normalized tag densities. Highlighted area is a Runx1 intronic peak. m, Runx1 expression in macrophages (left) and Postn fibroblasts (right) in sham, TAC, TAC + JQ1 and TAC + JQ1 withdrawn. Each dot represents a single cell. P values were adjusted with ordinary one-way ANOVA and Turkey’s multiple comparisons test. Myeloid: sham versus TAC + JQ1 withdrawm (*P = 0.0492), TAC versus TAC + JQ1 (***P = 0.0003) and TAC + JQ1 versus TAC + JQ1 withdrawn (**P = 0.0021). Fibroblast: ****P < 0.0001 for all pairwise comparisons. n, Dot plot of human myeloid and fibroblast recovery signature plotted in mouse macrophages in fibroblasts split by four conditions. NK, natural killer; SMC, smooth muscle cell.

References

    1. Roger VL Epidemiology of heart failure. Circ. Res 113, 646 (2013). - PMC - PubMed
    1. Jessup M & Brozena S Heart failure. N. Engl. J. Med 348, 2007–2018 (2003). - PubMed
    1. Topkara VK et al. Myocardial recovery in patients receiving contemporary left ventricular assist devices: results from the Interagency Registry for Mechanically Assisted Circulatory Support (INTERMACS). Circ. Heart Fail 9, e003157 (2016). - PMC - PubMed
    1. Burkhoff D, Topkara VK, Sayer G & Uriel N Reverse remodeling with left ventricular assist devices. Circ. Res 128, 1594–1612 (2021). - PMC - PubMed
    1. Selzman CH et al. Bridge to removal: a paradigm shift for left ventricular assist device therapy. Ann. Thorac. Surg 99, 360 (2015). - PMC - PubMed