. 2023 Jul 31:14:1177847.
doi: 10.3389/fimmu.2023.1177847. eCollection 2023.

Identification of novel gene signature for lung adenocarcinoma by machine learning to predict immunotherapy and prognosis

Affiliations

Identification of novel gene signature for lung adenocarcinoma by machine learning to predict immunotherapy and prognosis

Jianfeng Shu et al. Front Immunol. .

Abstract

Background: Lung adenocarcinoma (LUAD) as a frequent type of lung cancer has a 5-year overall survival rate of lower than 20% among patients with advanced lung cancer. This study aims to construct a risk model to guide immunotherapy in LUAD patients effectively.

Materials and methods: LUAD Bulk RNA-seq data for the construction of a model, single-cell RNA sequencing (scRNA-seq) data (GSE203360) for cell cluster analysis, and microarray data (GSE31210) for validation were collected from The Cancer Genome Atlas (TCGA) and Gene Expression Omnibus (GEO) database. We used the Seurat R package to filter and process scRNA-seq data. Sample clustering was performed in the ConsensusClusterPlus R package. Differentially expressed genes (DEGs) between two groups were mined by the Limma R package. MCP-counter, CIBERSORT, ssGSEA, and ESTIMATE were employed to evaluate immune characteristics. Stepwise multivariate analysis, Univariate Cox analysis, and Lasso regression analysis were conducted to identify key prognostic genes and were used to construct the risk model. Key prognostic gene expressions were explored by RT-qPCR and Western blot assay.

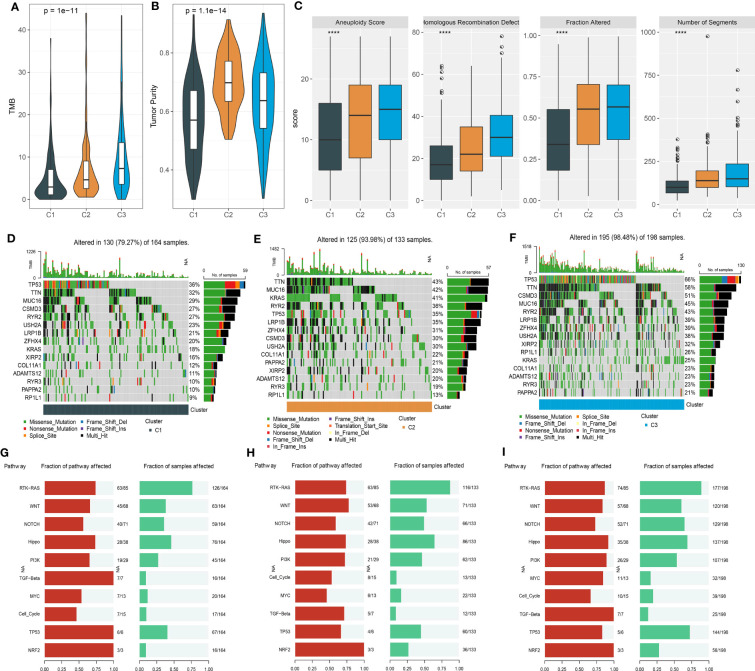
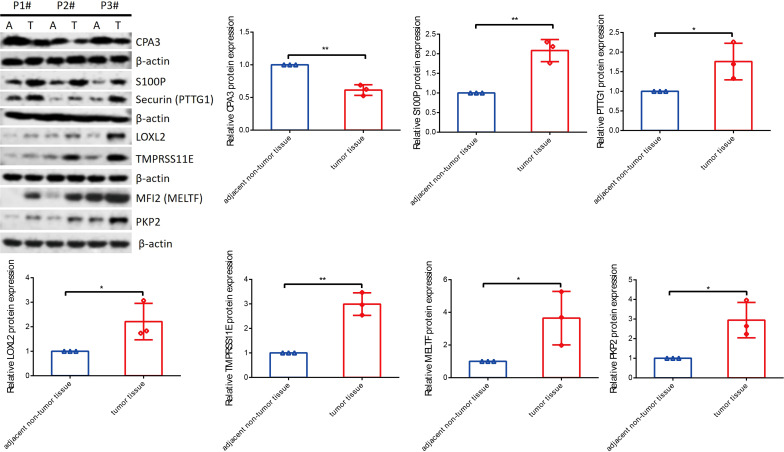
Results: A total of 27 immune cell marker genes associated with prognosis were identified for subtyping LUAD samples into clusters C3, C2, and C1. C1 had the longest overall survival and highest immune infiltration among them, followed by C2 and C3. Oncogenic pathways such as VEGF, EFGR, and MAPK were more activated in C3 compared to the other two clusters. Based on the DEGs among clusters, we confirmed seven key prognostic genes including CPA3, S100P, PTTG1, LOXL2, MELTF, PKP2, and TMPRSS11E. Two risk groups defined by the seven-gene risk model presented distinct responses to immunotherapy and chemotherapy, immune infiltration, and prognosis. The mRNA and protein level of CPA3 was decreased, while the remaining six gene levels were increased in clinical tumor tissues.

Conclusion: Immune cell markers are effective in clustering LUAD samples into different subtypes, and they play important roles in regulating the immune microenvironment and cancer development. In addition, the seven-gene risk model may serve as a guide for assisting in personalized treatment in LUAD patients.

Keywords: immune cells; immunotherapy; lung adenocarcinoma; molecular subtyping; risk model; single-cell analysis.


Conflict of interest statement

The authors declare that the research was conducted in the absence of any commercial or financial relationships that could be construed as a potential conflict of interest.

Figures

Figure 1
Figure 1
Analysis of scRNA-seq data. (A) Cell counts before and after data filtering. (B) T-SNE plot of clustering cells. (C) The proportion of eight cell types in six samples. (D) The distribution of eight cell types is shown in the T-SNE plot. (E) The expression of marker genes of eight cell types. (F) The top five DEGs (marker genes) of eight cell types. CAF, cancer-associated fibroblasts; AT, alveolar type.
Figure 2
Figure 2
KEGG (A) and GO (B) function analysis of DEGs of immune cells (monocytes/macrophages, mast cells, T cells, dendritic cells, and B cells) in the TCGA dataset. FDR, false discovery rate.
Figure 3
Figure 3
Constructing molecular subtypes based on DEGs. (A) Venn plot of DEGs (identified between tumor and normal samples in the TCGA dataset) and prognostic marker genes (identified in scRNA-seq data). (B) Univariate Cox regression result of 27 intersected genes. (C) Kaplan-Meier survival analysis of three clusters in the TCGA dataset. (D) Kaplan-Meier survival analysis of three clusters in the GSE31210 dataset. (E) The distribution of different clinical features in three clusters in the TCGA dataset.
Figure 4
Figure 4
Analysis of immune infiltration and tumor-related pathways in the TCGA dataset. (A) The heat map showed the distribution of 22 immune cells in three clusters. (B) The box plot showed the estimated enrichment of 22 immune cells in three clusters. (C) ESTIMATE analysis revealed immune and stromal infiltration of three clusters. (D) IFN-γ expression level in three clusters. (E) Comparison of the enrichment of 10 immune-related cells calculated by MCP-counter among three clusters. (F) Comparison of the enrichment of 28 immune-related cells calculated by ssGSEA among three clusters. (G) Comparison of the enrichment of 11 tumor-related pathways calculated by PROGENy among three clusters. *p < 0.05, **p < 0.01, ****p < 0.0001; ns, no significant.
Figure 5
Figure 5
Mutation analysis of three clusters in the TCGA dataset. (A, B) TMB and tumor purity of three clusters. (C) The scores of aneuploidy, homologous recombination defect, fraction altered, and number of segments. (D–F) The top 15 mutated genes in C1 (D), C2 (E), and C3 (F). (G–I) The fraction of affected oncogenic pathways and the fraction of samples with mutated pathways in C1 (G), C2 (H), and C3 (I). ****p < 0.0001.
Figure 6
Figure 6
Establishment and verification of a risk model. (A) The change of Lasso coefficients with the increasing lambda. (B) Partial likelihood of deviance from changing lambda values. (C) The hazard ratio of seven prognostic genes was analyzed by stepAIC. (D) The division of two risk groups and the distribution of samples ranking by risk score in the TCGA dataset. (E) ROC curve of 1-year, 3-year, and 5-year survival in TCGA dataset. (F) Kaplan-Meier survival curve of high- and low-risk groups in the TCGA dataset. (G) The percentage of alive and dead samples in the two risk groups in the TCGA dataset. (H–K) The validation of the risk model in the GSE31210 dataset.
Figure 7
Figure 7
Optimization of the risk model in the TCGA dataset. (A, B) Univariate (A) and multivariate (B) Cox regression analysis of age, gender, stage, and risk score. (C) A nomogram based on risk score and stage. (D) Comparison of observed overall survival (OS) and nomogram-predicted OS. (E) Decision curve analysis of nomogram, stage, and risk score. (F–H) ROC curves of age, gender, stage, risk score, and nomogram at 1 year, 3 years, and 5 years.
Figure 8
Figure 8
The relation of risk score to immune infiltration and chemotherapeutic response. (A) Immune and stromal infiltration of the two risk groups were calculated by the ESTIMATE algorithm. (B) The estimated enrichment of 22 immune cells in the two risk groups was calculated by CIBERSORT. (C–F) Spearman correlation analysis of risk score with the enrichment of different immune cells and stromal cells was calculated by different tools [CIBERSORT (C), ssGSEA (D), MCP-counter (E), and TIMER (F)]. Significant correlation pairs were presented. (G) Correlation heatmap of risk score with TIDE, IFN-γ, T cell exclusion, T cell dysfunction, and MDSC. (H) The estimated IC50 of eight chemotherapeutic drugs in the high- and low-risk groups. *p < 0.05, **p < 0.01, ***p < 0.001, ****p < 0.0001; ns, no significant.
Figure 9
Figure 9
The performance of the risk model in immunotherapy-treated patients. (A–C) Kaplan-Meier survival analysis of the two risk groups in all patients (A), patients of early stages (I+II) (B), and patients of late stages (III+IV) (C) in the IMvigor210 dataset. (D) Comparison of the risk score in CR/PR and SD/PD groups. (E) Kaplan-Meier survival analysis of the high- and low-TIDE score groups. (F) ROC curve of TIDE score and risk score in the response to immunotherapy.
Figure 10
Figure 10
The mRNA levels of seven genes were determined by RT-qPCR. *p < 0.05.
Figure 11
Figure 11
The protein levels of seven genes were detected by Western blot. *p < 0.05, **p < 0.01.

References

    1. Sung H, Ferlay J, Siegel RL, Laversanne M, Soerjomataram I, Jemal A, et al. . Global cancer statistics 2020: GLOBOCAN estimates of incidence and mortality worldwide for 36 cancers in 185 countries. CA: Cancer J Clin (2021) 71(3):209–49. doi: 10.3322/caac.21660 - DOI - PubMed
    1. Allemani C, Matsuda T, Di Carlo V, Harewood R, Matz M, Nikšić M, et al. . Global surveillance of trends in cancer survival 2000-14 (CONCORD-3): analysis of individual records for 37 513 025 patients diagnosed with one of 18 cancers from 322 population-based registries in 71 countries. Lancet (2018) 391(10125):1023–75. doi: 10.1016/S0140-6736(17)33326-3 - DOI - PMC - PubMed
    1. Bade BC, Dela Cruz CS. Lung cancer 2020: epidemiology, etiology, and prevention. Clinics chest Med (2020) 41(1):1–24. doi: 10.1016/j.ccm.2019.10.001 - DOI - PubMed
    1. Lin JJ, Cardarella S, Lydon CA, Dahlberg SE, Jackman DM, Jänne PA, et al. . Five-year survival in EGFR-mutant metastatic lung adenocarcinoma treated with EGFR-TKIs. J Thorac oncology: Off Publ Int Assoc Study Lung Cancer (2016) 11(4):556–65. doi: 10.1016/j.jtho.2015.12.103 - DOI - PMC - PubMed
    1. Sullivan I, Planchard D. ALK inhibitors in non-small cell lung cancer: the latest evidence and developments. Ther Adv Med Oncol (2016) 8(1):32–47. doi: 10.1177/1758834015617355 - DOI - PMC - PubMed

Publication types