A genotype × environment experiment reveals contrasting response strategies to drought between populations of a keystone species (Artemisia tridentata; Asteraceae)
- PMID: 37583876
- PMCID: PMC10423975
- DOI: 10.1002/pei3.10119
A genotype × environment experiment reveals contrasting response strategies to drought between populations of a keystone species (Artemisia tridentata; Asteraceae)
Abstract
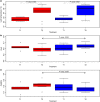
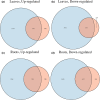
Western North America has been experiencing persistent drought exacerbated by climate change for over two decades. This extreme climate event is a clear threat to native plant communities. Artemisia tridentata is a keystone shrub species in western North America and is threatened by climate change, urbanization, and wildfire. A drought Genotype × Environment (G × E) experiment was conducted to assess phenotypic plasticity and differential gene expression in A. tridentata. The G × E experiment was performed on diploid A. tridentata seedlings from two populations (one from Idaho, USA and one from Utah, USA), which experience differing levels of drought stress during the summer months. Photosynthetic data, leaf temperature, and gene expression levels were compared between treatments and populations. The Utah population maintained higher photosynthetic rates and photosynthetic efficiency than the Idaho population under drought stress. The Utah population also exhibited far greater transcriptional plasticity than the Idaho population and expressed genes of response pathways distinct from those of the Idaho population. Populations of A. tridentata differ greatly in their drought response pathways, likely due to differences in response pathways that have evolved under distinct climatic regimes. Epigenetic processes likely contribute to the observed differences between the populations.
Keywords: Artemisia tridentata; differential gene expression; drought response; epigenetics; keystone species; local adaptation; megadrought; sagebrush.
© 2023 The Authors. Plant‐Environment Interactions published by New Phytologist Foundation and John Wiley & Sons Ltd.
Conflict of interest statement
The authors have no competing interests to declare.
Figures


References
-
- Adams, D. K. , & Comrie, A. C. (1997). The north American monsoon. Bulletin of the American Meteorological Society, 78, 2197–2213.
-
- Arkle, R. S. , Pilliod, D. S. , Hanser, S. E. , Brooks, M. L. , Chambers, J. C. , Grace, J. B. , Knutson, K. C. , Pyke, D. A. , Welty, J. L. , & Wirth, T. A. (2014). Quantifying restoration effectiveness using multi‐scale habitat models: Implications for sage‐grouse in the Great Basin. Ecosphere, 5, 1–32.
-
- Augustine, S. M. (2016). Function of heat‐shock proteins in drought tolerance regulation of plants. In Hossain M., Wani S., Bhattacharjee S., Burritt D., Tran L. S. (Eds.), Drought stress tolerance in plants, (Vol 1). Springer, Cham. 10.1007/978-3-319-28899-4_7 - DOI
-
- Ault, T. R. (2020). On the essentials of drought in a changing climate. Science, 368, 256–260. - PubMed
LinkOut - more resources
Full Text Sources
