. 2023 Jul 31:17:1214793.
doi: 10.3389/fncom.2023.1214793. eCollection 2023.

The decoupling between hemodynamic parameters and neural activity implies a complex origin of spontaneous brain oscillations

Affiliations

The decoupling between hemodynamic parameters and neural activity implies a complex origin of spontaneous brain oscillations

Ming Li et al. Front Comput Neurosci. .

Abstract

Introduction: Spontaneous low-frequency oscillations play a key role in brain activity. However, the underlying mechanism and origin of low-frequency oscillations remain under debate.

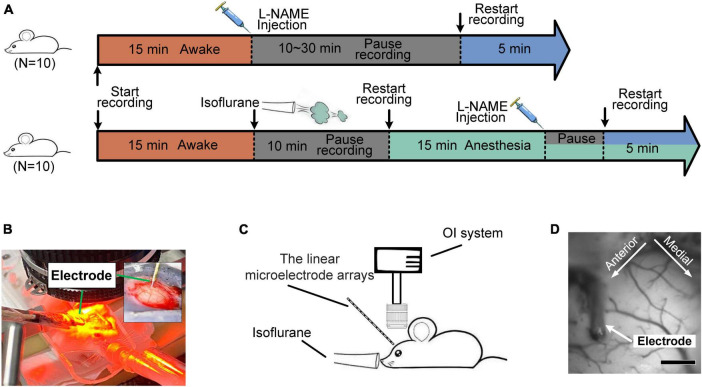
Methods: Optical imaging and an electrophysiological recording system were combined to investigate spontaneous oscillations in the hemodynamic parameters and neuronal activity of awake and anesthetized mice after Nω-nitro-L-arginine methyl ester (L-NAME) administration.

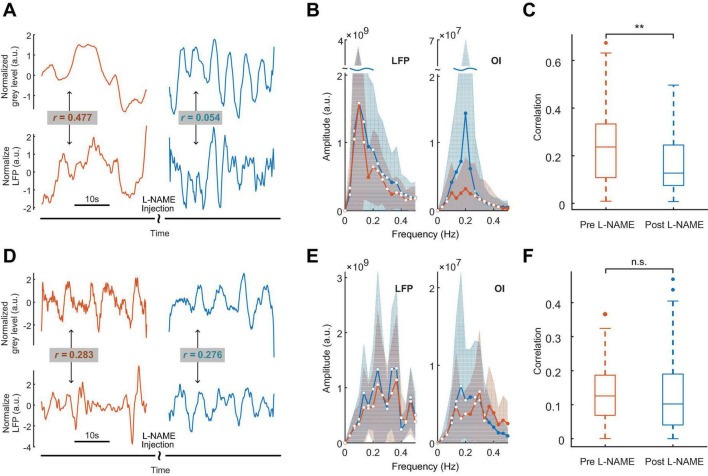
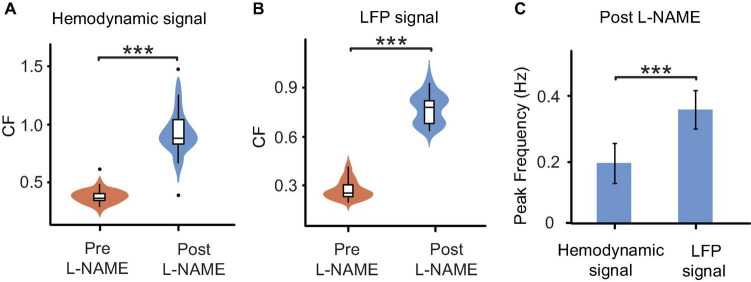
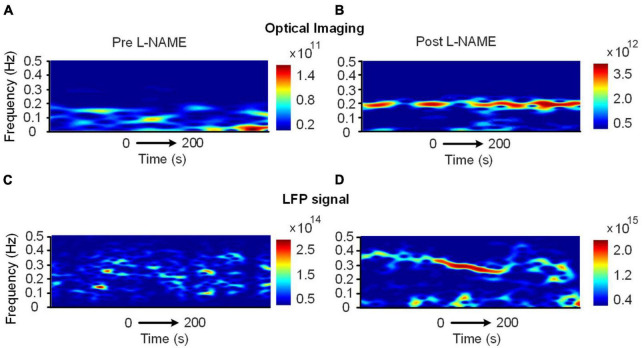
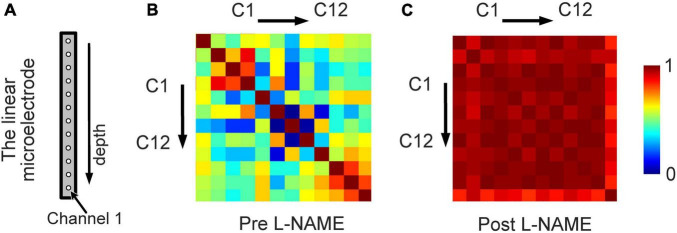
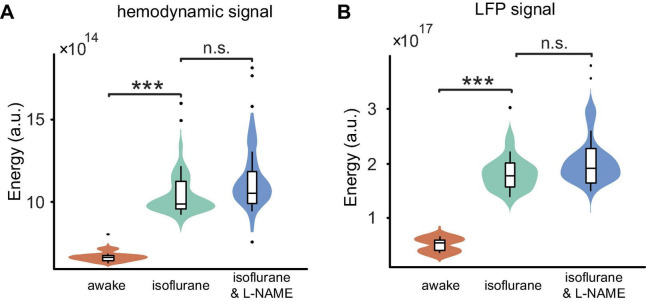
Results: The spectrum of local field potential (LFP) signals was significantly changed by L-NAME, which was further corroborated by the increase in energy and spatial synchronization. The important finding was that L-NAME triggered regular oscillations in both LFP signals and hemodynamic signals. Notably, the frequency peak of hemodynamic signals can be different from that of LFP oscillations in awake mice.

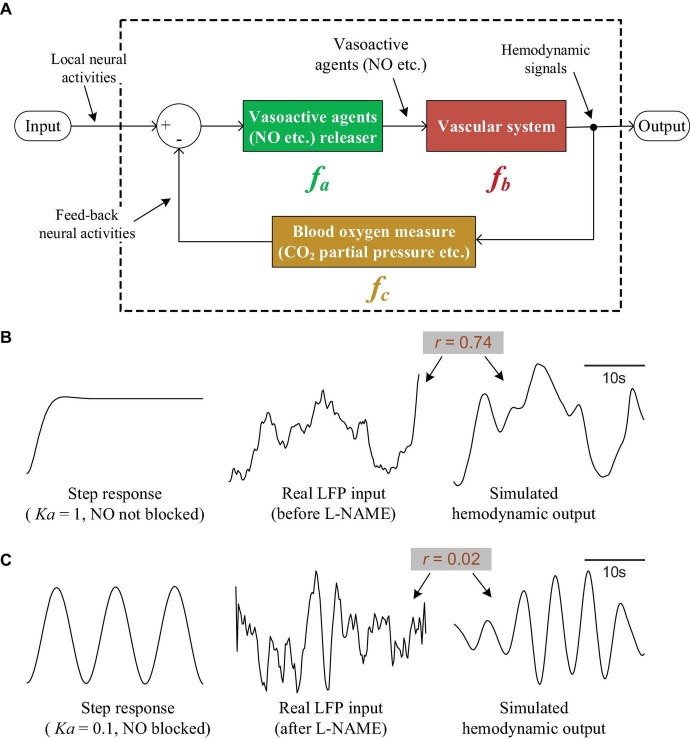
Discussion: A model of the neurovascular system was proposed to interpret this mismatch of peak frequencies, supporting the view that spontaneous low-frequency oscillations arise from multiple sources.

Keywords: local field potential; nitric oxide synthase inhibitor; optical imaging; signal decoupling; spontaneous oscillations.


Conflict of interest statement

The authors declare that the research was conducted in the absence of any commercial or financial relationships that could be construed as a potential conflict of interest.

Figures

FIGURE 1
FIGURE 1
Diagrams of the experiments for the hemodynamic and electrophysiological signals. (A) Flow chart of the experiment on awake (top) and anesthetized (bottom) mice. Orange segment: awake; blue: after the injection of L-NAME; green: anesthesia with isoflurane; gray: a pause in recording for a rest period. (B,C) Diagram of the experimental setup. The inset graph in panel (B) is a magnified view of the electrode implant location. (D) Light reflection image recorded from the somatosensory cortex. Scale bar: 500 μm.
FIGURE 2
FIGURE 2
The effects of L-NAME on oscillations of both hemodynamic and LFP signals. Panels (A–C) for awake mice, (D–F) for anesthetized mice. Orange and blue represent before and after the injection of L-NAME, respectively. (A) An example of hemodynamic (upper panel) and LFP (lower panel) signals before and after the injection of L-NAME. Low-frequency oscillations were induced after L-NAME administration. Following the injection of L-NAME, the correlation between hemodynamic and LFP signals decreased remarkably (R-value: 0.477 vs. 0.054). (B) Group statistics of the power spectrum of LFP (left) and OI (right) signals for awake mice. The solid curves are the mean power spectrum, and the shaded areas represent the standard deviation. The filled-circle markers indicate significant differences before and after L-NAME (p < 0.05), and the hollow circles indicate no significance. (C) A statistical comparison of the correlation between LFP and hemodynamics. L-NAME administration induces a significant decrease in the correlation. The median value drops from 0.24 to 0.13. **Indicates significance at the 0.01 level. (D) An example from anesthetized mice. The correlations of hemodynamic (upper panel) and LFP (lower panel) signals are 0.283 and 0.276, respectively. (E) Group statistics of the power spectra of LFP and OI signals for anesthetized mice. The solid curves are the mean power spectra, and the shaded areas represent the standard deviation. The filled-circle markers indicate significant differences before and after L-NAME (p < 0.05), and the hollow circles indicate no significance. (F) A statistical comparison of correlation. In anesthetized mice, L-NAME administration did not change the correlation significantly. The correlations are relatively small, and the median values are 0.13 and 0.10, respectively. n.s. indicates no significant difference.
FIGURE 3
FIGURE 3
Comparisons of oscillations before and after L-NAME administration in all awake mice. (A) Boxplot of the CF coefficients of hemodynamic signals. The CF coefficients after the injection of L-NAME (blue) are significantly larger than those before injection (orange), which illustrates that oscillations were significantly enhanced by L-NAME (P < 0.001). (B) Boxplot of the CF coefficients of LFP signals. The CF coefficients showed similar increases after the injection of L-NAME (P < 0.001). The shadow beside the boxplot indicates the value distribution. (C) Comparisons of the peak frequency between hemodynamic and LFP oscillations after the injection of L-NAME. L-NAME triggered oscillations in both hemodynamic parameters and neural activity; however, the two oscillations occurred at different frequencies (P < 0.001). This result implies decoupling hemodynamic and LFP oscillations. Violin plots behind the boxplots represent the distributions of CF values. ***Indicates significance at the 0.001 level.
FIGURE 4
FIGURE 4
Time-varying spectrum of the low-frequency oscillations (<0.5 Hz) before and after the injection of L-NAME, as revealed by the STFT in awake mice. (A,B) The spectrum of hemodynamic signals, (C,D) the spectrum of the LFP signals synchronously recorded with panels (A,B). Panels (A,C): before L-NAME injection; Panels (B,D): after injection. After the injection of L-NAME, a stable low-frequency oscillation was triggered, while the hemodynamic and LFP oscillations were not present in the same frequency band.
FIGURE 5
FIGURE 5
An increase in the synchronization of the LFP from different locations owing to L-NAME administration. (A) Schematic illustration of the 12-channel distribution from different positions of the linear microelectrode arrays. (B) The correlation coefficient matrix of the LFP signals from 12 channels for awake mice without L-NAME administration. (C) The correlation coefficient matrix after the injection of L-NAME. The correlation coefficients were larger after L-NAME administration, which means that the spontaneous oscillations of different locations became consistent.
FIGURE 6
FIGURE 6
Comparisons of the energy among the three stages (awake, anesthesia, and anesthesia with injection of L-NAME). (A) Boxplot of the hemodynamic low-frequency oscillation energy. Under anesthesia (green), the energy was significantly larger than that of awake mice (orange) (P < 0.001), while the injection of L-NAME (blue) had no effect on the energy (P > 0.05) in anesthetized mice. (B) The energy of LFP low-frequency oscillation changes similar to hemodynamic signals throughout the three stages. Violin plots behind the boxplots represent the energy distributions. Error bars indicate the standard errors. ***Indicates significance at the 0.001 level. n.s., no significant difference.
FIGURE 7
FIGURE 7
The neurovascular coupling model and simulations. (A) The theoretical neurovascular coupling model, which is designed as a control system with negative feedback. (B) The input/output characteristics of the model when NO is not blocked. The left curve is the step response of the system. The right curve is the response of the system when feeding a real LFP signal (the middle curve). (C) The input/output characteristics of the model when NO is blocked. Left: the step response. Right curve: the response of the system when feeding a real LFP signal (the middle curve).

References

    1. Ances B. M., Greenberg J. H., Detre J. A. (2010). Interaction between nitric oxide synthase inhibitor induced oscillations and the activation flow coupling response. Brain Res. 1309 19–28. 10.1016/j.brainres.2009.09.119 - DOI - PMC - PubMed
    1. Biswal B. B., Hudetz A. G. (1996). Synchronous oscillations in cerebrocortical capillary red blood cell velocity after nitric oxide synthase inhibition. Microvasc. Res. 52 1–12. 10.1006/mvre.1996.0039 - DOI - PubMed
    1. Biswal B., Yetkin F. Z., Haughton V. M., Hyde J. S. (1995). Functional connectivity in the motor cortex of resting human brain using echo-planar MRI. Magn. Reson. Med. 34 537–541. 10.1002/mrm.1910340409 - DOI - PubMed
    1. Box J. F. (1987). Guinness, gosset, fisher, and small samples. Stat. Sci. 2 45–52. 10.1214/ss/1177013437 - DOI
    1. Bumstead J. R., Bauer A. Q., Wright P. W., Culver J. P. (2017). Cerebral functional connectivity and Mayer waves in mice: Phenomena and separability. J. Cereb. Blood Flow Metab. 37 471–484. 10.1177/0271678X16629977 - DOI - PMC - PubMed

LinkOut - more resources