

Validation of Childhood Pneumonia Prognostic Models for Use in Emergency Care Settings
- PMID: 37584111
- PMCID: PMC10469586
- DOI: 10.1093/jpids/piad054
Validation of Childhood Pneumonia Prognostic Models for Use in Emergency Care Settings
Abstract
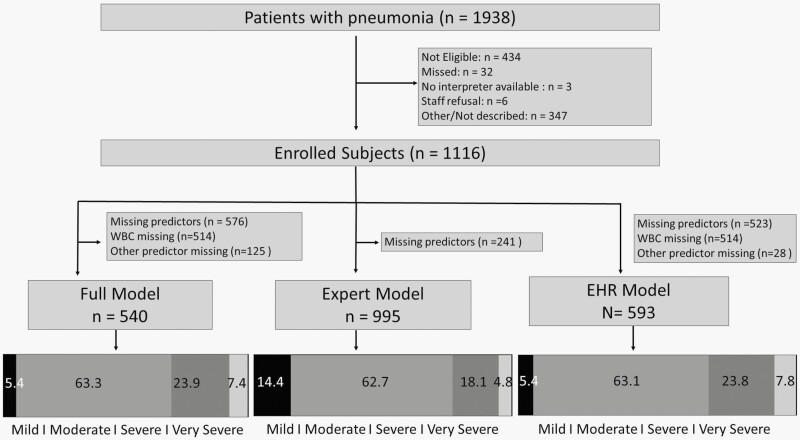
Background: Unwarranted variation in disposition decisions exist among children with pneumonia. We validated three prognostic models for predicting pneumonia severity among children in the emergency department (ED) and hospital.
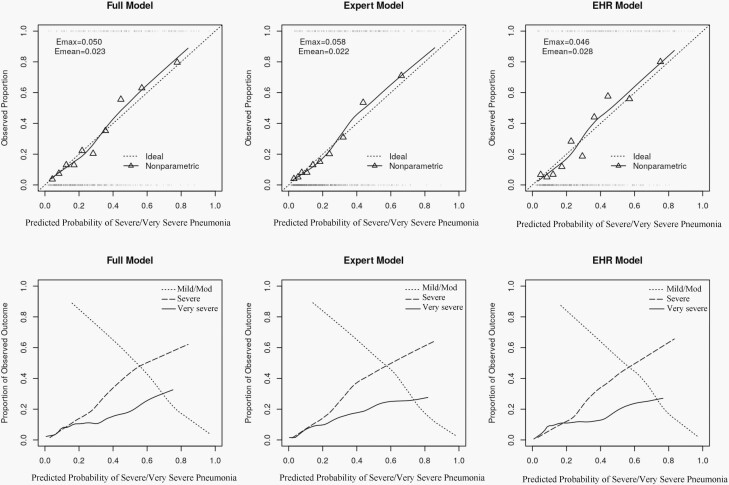
Methods: We performed a two-center, prospective study of children 6 months to <18 years presenting to the ED with pneumonia from January 2014 to May 2019. We evaluated three previously developed disease-specific prognostic models which use demographic, clinical, and diagnostic predictor variables, with each model estimating risk for Very Severe (mechanical ventilation or shock), Severe (ICU without very severe features), and Moderate/Mild (Hospitalization without severe features or ED discharge) pneumonia. Predictive accuracy was measured using discrimination (concordance or c-statistic) and re-calibration.
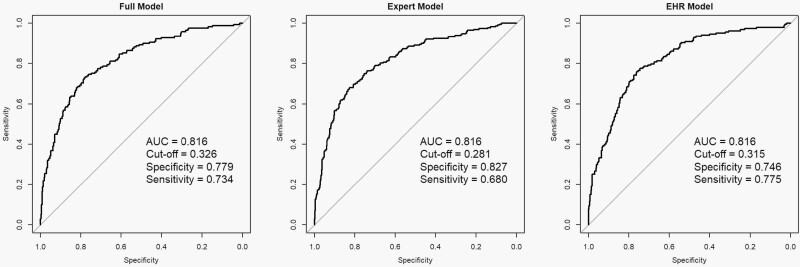
Results: There were 1088 children included in one or more of the three models. Median age was 3.6 years and the majority of children were male (53.7%) and identified as non-Hispanic White (63.7%). The distribution for the ordinal severity outcome was mild or moderate (79.1%), severe (15.9%), and very severe (4.9%). The three models each demonstrated excellent discrimination (C-statistic range across models [0.786-0.803]) with no appreciable degradation in predictive accuracy from the derivation cohort.
Conclusions: All three prognostic models accurately identified risk for three clinically meaningful levels of pneumonia severity and demonstrated very good predictive performance. Physiologic variables contributed the most to model prediction. Application of these objective tools may help standardize and improve disposition and other management decisions for children with pneumonia.
Keywords: pediatrics; pneumonia; prognostic model; validation.
© The Author(s) 2023. Published by Oxford University Press on behalf of The Journal of the Pediatric Infectious Diseases Society. All rights reserved. For permissions, please e-mail: journals.permissions@oup.com.
Figures
References
-
- Fine MJ, Auble TE, Yealy DM, et al. A prediction rule to identify low-risk patients with community-acquired pneumonia. N Engl J Med 1997; 336:243–50. - PubMed
MeSH terms
Grants and funding
LinkOut - more resources
Full Text Sources
Medical
