Review
. 2023 Oct 13;120(41):681-687.
doi: 10.3238/arztebl.m2023.0175.

Mediation Analysis in Medical Research

Affiliations
Review

Mediation Analysis in Medical Research

Thaddäus Tönnies et al. Dtsch Arztebl Int. .

Abstract

Background: Mediation analysis addresses the question of the mechanisms by which an exposure causes an outcome. This article is intended to convey basic knowledge of statistical mediation analysis.

Methods: Selected articles and examples are used to explain the principle of mediation analysis.

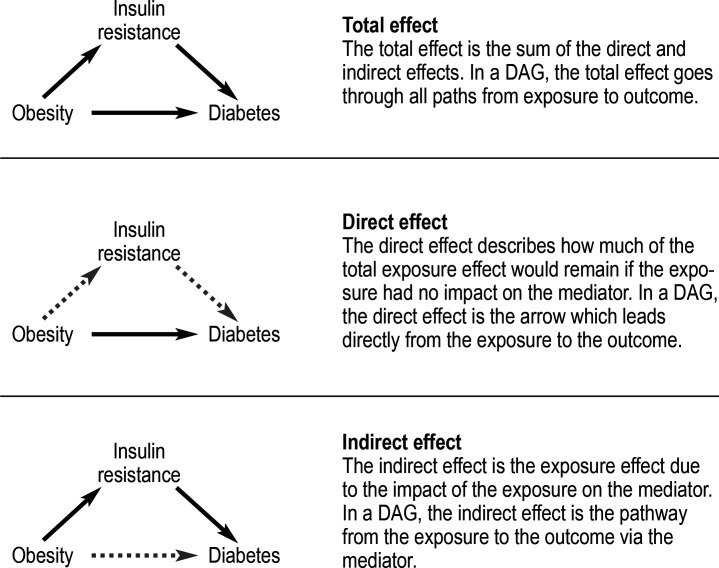
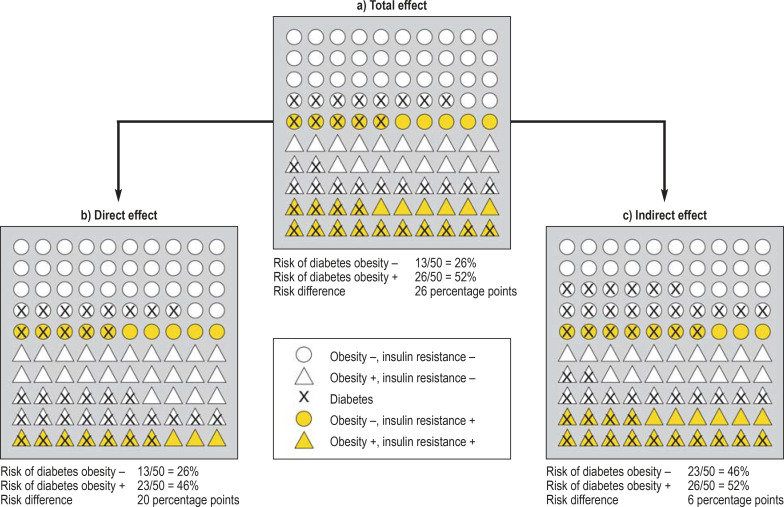
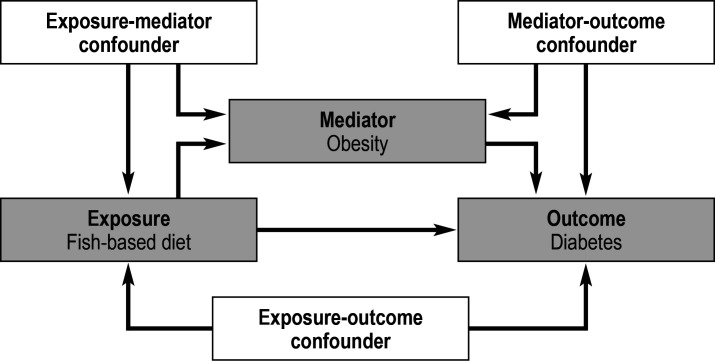
Results: The goal of mediation analysis is to express an overall exposure effect as a combination of an indirect and a direct effect. For example, it might be of interest whether the increased risk of diabetes (outcome) due to obesity (exposure) is mediated by insulin resistance (indirect effect), and, if so, how much of a direct effect remains. In this example, insulin resistance is a potential mediator of the effect of obesity on the risk of diabetes. In general, for a mediation analysis to be valid, more confounders must be taken into account than in the estimation of the overall effect size. A regression-based approach can be used to ensure the consideration of all relevant confounders in a mediation analysis.

Conclusion: By decomposing the overall exposure effect into indirect and direct components, a mediation analysis can reveal not just whether an exposure causes an outcome, but also how. For a mediation analysis to be valid, however, multiple assumptions must be satisfied that cannot easily be checked, potentially compromising such analyses as compared to the estimation of an overall effect.


Figures

Figure 1
Figure 1
Directed Acyclic Graphs (DAG) to demonstrate mediation analysis—decomposition of the total effect into a direct and an indirect effect
Figure 2
Figure 2
Decomposition of the effect of obesity on the risk of diabetes into a direct and an indirect effect. Presented here are 100 hypothetical study participants of which half are obese. Color is used to distinguish the presence of insulin resistance in the study participants. It is assumed that obesity increases the risk of insulin resistance from 20% to 40%. Accordingly, Figure 2a shows that, of the 50 individuals without obesity (circles), 10 individuals, or 20%, have insulin resistance (yellow circles). On the other hand, twenty individuals, or 40%, in the group with obesity (triangles) have insulin resistance (yellow triangles). Without obesity and without insulin resistance, the risk of diabetes is 20%. Accordingly, in Figure 2a, out of 40 individuals without obesity and insulin resistance (white circles), eight individuals, or 20%, have diabetes (white circles with cross). Obesity and insulin resistance increase the risk of diabetes by 20 and 30 percentage points, respectively. Accordingly, five out of ten individuals, or 50% without obesity but with insulin resistance suffer from diabetes (white circles with cross). Of 30 individuals with obesity but without insulin resistance (white triangles), 12, or 40%, suffer from diabetes. Individuals with obesity and insulin resistance (yellow triangles) have the highest risk of developing diabetes. Here, 14 of 20 individuals, or 70%, suffer from diabetes. To calculate the total effect of obesity on the risk of diabetes, the proportion of study participants with diabetes is compared between individuals with and without obesity. In this example, this results in 13 and 26 people with diabetes in the group without and the group with obesity, respectively, corresponding to a risk of diabetes of 26% and 52%, respectively. The total effect of obesity on the risk of diabetes (Figure 2a) takes into account both the direct risk increase due to obesity and the indirect risk increase via insulin resistance in the presence of obesity. For the direct effect (Figure 2b), the figures were calculated similar to Figure 2a, with the difference that here the effect of obesity on insulin resistance was “eliminated”. This is recognizable by the fact that the number of individuals with insulin resistance in the group with and in the group without obesity is the same (ten yellow circles and ten yellow triangles). The calculation of the figures for the indirect effect (Figure 2c) is also analogous to the total effect, with the difference that here individuals without insulin resistance and obesity have the same risk of diabetes (12 of 30 individuals, 40%) as persons without insulin resistance and with obesity (16 of 40 individuals, 40%). In this case, obesity only influences the risk of diabetes via the increased risk of insulin resistance.
Figure 3
Figure 3
Directed acyclic graph showing the causal relationship between a fish-based diet, obesity, and diabetes

References

    1. Gianicolo EAL, Eichler M, Muensterer O, Strauch K, Blettner M. Methods for evaluating causality in observational studies—part 27 of a series on evaluation of scientific publications. Dtsch Arztebl Int. 2020;117:101–107. - PMC - PubMed
    1. Stang A. Eine Einführung in Kausalitätsprinzipien in der biomedizinischen Forschung. Gesundheitswesen. 2014;76:874–882. - PubMed
    1. Richiardi L, Bellocco R, Zugna D. Mediation analysis in epidemiology: methods, interpretation and bias. Int J Epidemiol. 2013;42:1511–1519. - PubMed
    1. VanderWeele TJ. Mediation analysis: a practitioner‘s guide. Annu Rev Public Health. 2016;37:17–32. - PubMed
    1. VanderWeele T. Explanation in causal inference: methods for mediation and interaction. Oxford University Press. 2015