. 2023 Oct 17;32(21):3105-3120.
doi: 10.1093/hmg/ddad123.

Mutations in human DNA methyltransferase DNMT1 induce specific genome-wide epigenomic and transcriptomic changes in neurodevelopment

Affiliations

Mutations in human DNA methyltransferase DNMT1 induce specific genome-wide epigenomic and transcriptomic changes in neurodevelopment

Kasey N Davis et al. Hum Mol Genet. .

Abstract

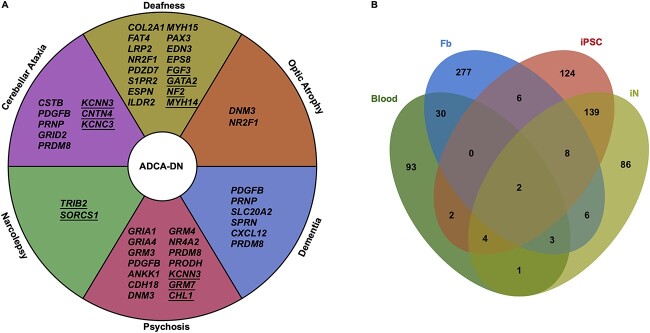
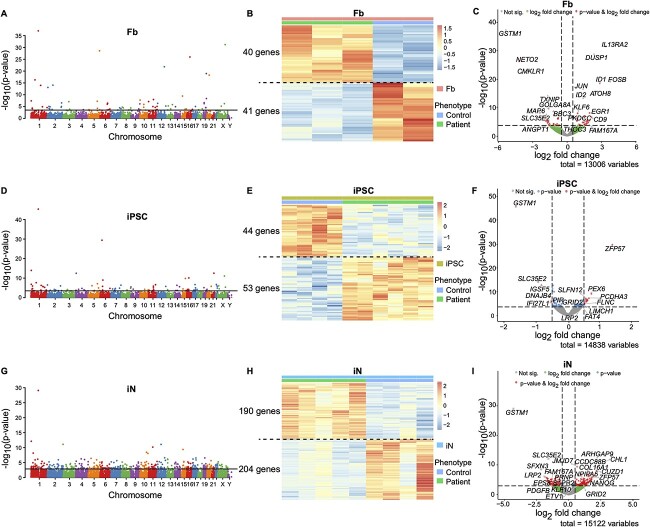
DNA methyltransferase type 1 (DNMT1) is a major enzyme involved in maintaining the methylation pattern after DNA replication. Mutations in DNMT1 have been associated with autosomal dominant cerebellar ataxia, deafness and narcolepsy (ADCA-DN). We used fibroblasts, induced pluripotent stem cells (iPSCs) and induced neurons (iNs) generated from patients with ADCA-DN and controls, to explore the epigenomic and transcriptomic effects of mutations in DNMT1. We show cell type-specific changes in gene expression and DNA methylation patterns. DNA methylation and gene expression changes were negatively correlated in iPSCs and iNs. In addition, we identified a group of genes associated with clinical phenotypes of ADCA-DN, including PDGFB and PRDM8 for cerebellar ataxia, psychosis and dementia and NR2F1 for deafness and optic atrophy. Furthermore, ZFP57, which is required to maintain gene imprinting through DNA methylation during early development, was hypomethylated in promoters and exhibited upregulated expression in patients with ADCA-DN in both iPSC and iNs. Our results provide insight into the functions of DNMT1 and the molecular changes associated with ADCA-DN, with potential implications for genes associated with related phenotypes.


Figures

Figure 1
Figure 1
Protein structure of human DNMT1 (PDB accession number 4WXX, image generated with PyMol2). (A) Cartoon representation of human DNMT1 with domains RFTS, CXXC, BAH1, BAH2 and MTase. Sites of ADCA-DN mutations are (denoted by arrows) in the RFTS domain. Magnification structure was tilted in order to show the mutations. (B) Domain architecture of human DNMT1. Locations of the DNMT1 mutations are located in the RFTS domain. (C) Time-course of differentiation showing the generation of iNs including infection with lentivirus at day 1, dox treatment at day 2 and finally day 6 during puromycin selection. (D, E) Representative immunostaining images of iNs 7 days after infection stained with MAP2 and DAPI and TUJ1 and DAPI.
Figure 2
Figure 2
Methylation levels of CpGs across tissues (Fb: fibroblast; iPSC: induced pluripotent stem cell; iN: induced neuron; Blood: blood). (A) Density plot for methylation levels of CpGs for each sample across tissues. Patients with ADCA- DN and controls are denoted by solid and dashed lines, respectively. (B) Distribution of methylation level difference between patients with ADCA-DN and controls within each tissue and between any two different tissues. Diamonds and blocks in each box represent the mean and median values respectively. Comparisons on methylation levels between patients with ADCA-DN and controls within each tissue and between any two different tissues were conducted using the Wilcoxon rank-sum test. The red asterisks (*) on the boxplots denote P-value <0.05 in the corresponding comparisons.
Figure 3
Figure 3
DMRs between patients with ADCA-DN and controls for each tissue. Distribution of DMRs in blood, fibroblasts, iPSCs and iNs are shown in (A), (C), (E) and (G), respectively. The scaled methylation levels of CpGs in the DMRs of blood, fibroblasts, iPSCs and iNs are shown in (B), (D), (F) and (H), respectively. In (A), (C), (E) and (G), x axis is the methylation difference between patients and controls with >0 meaning hypermethylation and < 0 meaning hypomethylation in patients, while the y axis is the number of DMRs at a specific interval of methylation level difference. The total number of DMRs is shown separately for hypermethylation and hypomethylation. In (B), (D), (F) and (H), the dashed black line separates hypermethylated and hypomethylated CpGs in patients. DMR calling cutoff: methylation difference > = 0.2, q value <0.05, number of CpG ≥ 3.
Figure 4
Figure 4
(A) Genes associated with differentially methylated regions (DMRs) and differentially expressed genes associated with phenotypes of ADCA-DN. The clinical phenotypes of ADCA-DN are classified into six categories. Shown is the genes associated with DMRs (underlined italic) and the differentially expressed genes (italic) between patients and controls in iNs, which have been associated with the corresponding phenotypes of ADCA-DN. (B) Overlap of genes associated with DMRs across tissues. DMRs called between patients with ADCA-DN and control within each tissue were assigned to their closest transcriptional start site (TSS), and the related genes were referred to as ‘genes associated with DMRs’. Shown is the number of the overlapping genes associated with DMRs across tissues.
Figure 5
Figure 5
Differential expression analyses between patients with ADCA-DN and controls in three cell types. Genome-wide distribution of DEGs between patients and controls are shown in Manhattan plots for (A) fibroblasts, (D) iPSCs and (G) iNs. The x-axis denotes the −log10(P-values) of genes across the genome (y-axis) in the Manhattan plots. Genome-wide significance is based on FDR < 0.05 indicated by the horizontal black lines. Heatmaps show the scaled normalized expression for the DEGs in fibroblasts (B), iPSCs (E) and iNs (H), where the color scale goes from low expression to high expression. Volcano plots present the up- and downregulation of DEGs between patients and controls in fibroblasts (C), iPSCs (F) and iNs (I). Two vertical dashed lines in each volcano plot indicates a range of log2 fold change values from −0.5 to 0.5, and the horizontal dashed line denotes the adjusted P-value cutoff of 0.05. A portion of important DEGs are labeled with gene names.
Figure 6
Figure 6
Tissue-specific expression and differential expression between patients with ADCA-DN and controls. (A) Distinct expression patterns across tissues. Heatmap shows normalized expression of genes in modules clustered by weighted correlation network analysis (WGCNA). Different modules are separated by black dashed lines. The color scale goes from low to high expression. (B, C) Pathways enriched in genes with exclusive high expression in iNs. The difference between the two gene modules is medium expression in iPSCs versus low expression in iPSCs. (D) DEGs in each tissue. Heatmap shows normalized expression of DEGs between patients and controls exclusively in fibroblasts, iPSCs and iNs as well as the shared DEGs among tissues. The color scale goes from low to high expression. The black dashed line separates the upregulated and downregulated DEGs within each box. (E) Share DEGs among tissues. Heatmap shows the zoomed-in view of the top box with dashed lines in (D).

References

    1. Feng, J. and Fan, G. (2009) The role of DNA methylation in the central nervous system and neuropsychiatric disorders. Int. Rev. Neurobiol., 89, 67–84. - PubMed
    1. Golshani, P., Hutnick, L., Schweizer, F. and Fan, G. (2005) Conditional Dnmt1 deletion in dorsal forebrain disrupts development of somatosensory barrel cortex and thalamocortical long-term potentiation. Thalamus Relat. Syst., 3, 227–233. - PMC - PubMed
    1. Hutnick, L.K., Golshani, P., Namihira, M., Xue, Z., Matynia, A., Yang, X.W., Silva, A.J., Schweizer, F.E. and Fan, G. (2009) DNA hypomethylation restricted to the murine forebrain induces cortical degeneration and impairs postnatal neuronal maturation. Hum. Mol. Genet., 18, 2875–2888. - PMC - PubMed
    1. Feng, J., Zhou, Y., Campbell, S.L., Le, T., Li, E., Sweatt, J.D., Silva, A.J. and Fan, G. (2010) Dnmt1 and Dnmt3a maintain DNA methylation and regulate synaptic function in adult forebrain neurons. Nat. Neurosci., 13, 423–430. - PMC - PubMed
    1. Li, E., Bestor, T.H. and Jaenisch, R. (1992) Targeted mutation of the DNA methyltransferase gene results in embryonic lethality. Cell, 69, 915–926. - PubMed

Publication types

Substances