. 2023 Nov 1;13(11):2370-2393.
doi: 10.1158/2159-8290.CD-23-0131.

Clinical Efficacy of ONC201 in H3K27M-Mutant Diffuse Midline Gliomas Is Driven by Disruption of Integrated Metabolic and Epigenetic Pathways

Sriram Venneti #  1 Abed Rahman Kawakibi #  1 Sunjong Ji #  1 Sebastian M Waszak #  2   3   4 Stefan R Sweha #  1   5 Mateus Mota #  1 Matthew Pun #  1 Akash Deogharkar  1 Chan Chung  1   6 Rohinton S Tarapore  7 Samuel Ramage  7 Andrew Chi  8 Patrick Y Wen  9 Isabel Arrillaga-Romany  10 Tracy T Batchelor  11 Nicholas A Butowski  2 Ashley Sumrall  12 Nicole Shonka  13 Rebecca A Harrison  14 John de Groot  2 Minesh Mehta  15 Matthew D Hall  15 Doured Daghistani  15 Timothy F Cloughesy  16 Benjamin M Ellingson  16 Kevin Beccaria  17 Pascale Varlet  18 Michelle M Kim  1 Yoshie Umemura  1 Hugh Garton  1 Andrea Franson  1 Jonathan Schwartz  13 Rajan Jain  8 Maureen Kachman  1 Heidi Baum  1 Charles F Burant  1 Sophie L Mottl  3 Rodrigo T Cartaxo  1 Vishal John  1 Dana Messinger  1 Tingting Qin  1 Erik Peterson  1 Peter Sajjakulnukit  1 Karthik Ravi  1 Alyssa Waugh  1 Dustin Walling  1 Yujie Ding  1 Ziyun Xia  1 Anna Schwendeman  1 Debra Hawes  19 Fusheng Yang  19 Alexander R Judkins  19 Daniel Wahl  1 Costas A Lyssiotis  1 Daniel de la Nava  20   21   22 Marta M Alonso  20   21   22 Augustine Eze  23 Jasper Spitzer  24   25 Susanne V Schmidt  24   25 Ryan J Duchatel  26   27   28 Matthew D Dun  26   27   28 Jason E Cain  29   30 Li Jiang  31   32 Sylwia A Stopka  33   34 Gerard Baquer  33 Michael S Regan  33 Mariella G Filbin  31   32 Nathalie Y R Agar  33   34   35 Lili Zhao  1 Chandan Kumar-Sinha  1 Rajen Mody  1 Arul Chinnaiyan  1 Ryo Kurokawa  1   36 Drew Pratt  37 Viveka N Yadav  38 Jacques Grill  39 Cassie Kline  40   41 Sabine Mueller  2   42 Adam Resnick  40   41 Javad Nazarian  43   44   45 Joshua E Allen  7 Yazmin Odia  15 Sharon L Gardner  8 Carl Koschmann  1
Affiliations

Clinical Efficacy of ONC201 in H3K27M-Mutant Diffuse Midline Gliomas Is Driven by Disruption of Integrated Metabolic and Epigenetic Pathways

Sriram Venneti et al. Cancer Discov. .

Erratum in

  • Correction: Clinical Efficacy of ONC201 in H3K27M-Mutant Diffuse Midline Gliomas Is Driven by Disruption of Integrated Metabolic and Epigenetic Pathways.
    Venneti S, Kawakibi AR, Ji S, Waszak SM, Sweha SR, Mota M, Pun M, Deogharkar A, Chung C, Tarapore RS, Ramage S, Chi A, Wen PY, Arrillaga-Romany I, Batchelor TT, Butowski NA, Sumrall A, Shonka N, Harrison RA, de Groot J, Mehta M, Hall MD, Daghistani D, Cloughesy TF, Ellingson BM, Beccaria K, Varlet P, Kim MM, Umemura Y, Garton H, Franson A, Schwartz J, Jain R, Kachman M, Baum H, Burant CF, Mottl SL, Cartaxo RT, John V, Messinger D, Qin T, Peterson E, Sajjakulnukit P, Ravi K, Waugh A, Walling D, Ding Y, Xia Z, Schwendeman A, Hawes D, Yang F, Judkins AR, Wahl D, Lyssiotis CA, Nava D, Alonso MM, Eze A, Spitzer J, Schmidt SV, Duchatel RJ, Dun MD, Cain JE, Jiang L, Stopka SA, Baquer G, Regan MS, Filbin MG, Agar NYR, Zhao L, Kumar-Sinha C, Mody R, Chinnaiyan A, Kurokawa R, Pratt D, Yadav VN, Grill J, Kline C, Mueller S, Resnick A, Nazarian J, Allen JE, Odia Y, Gardner SL, Koschmann C. Venneti S, et al. Cancer Discov. 2025 Mar 3;15(3):657. doi: 10.1158/2159-8290.CD-25-0208. Cancer Discov. 2025. PMID: 40025951 Free PMC article. No abstract available.

Abstract

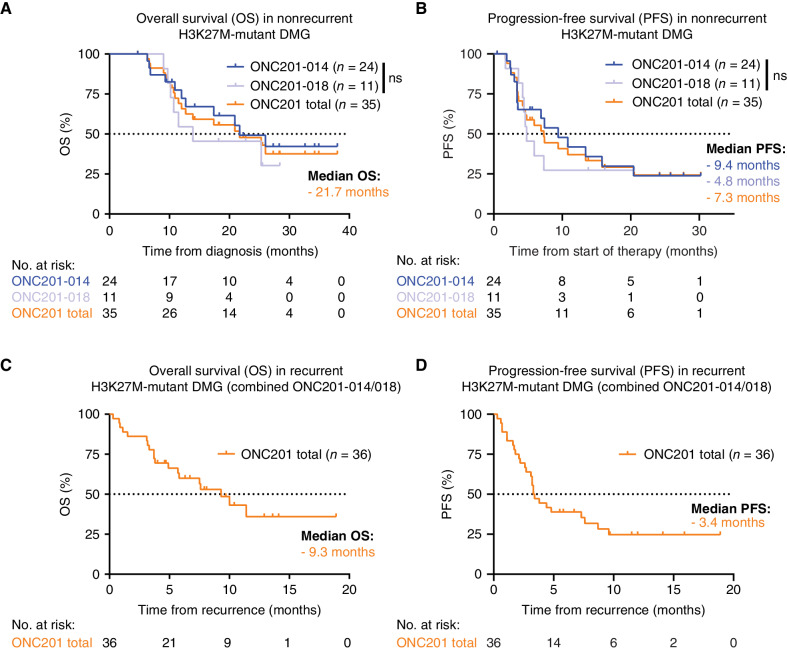
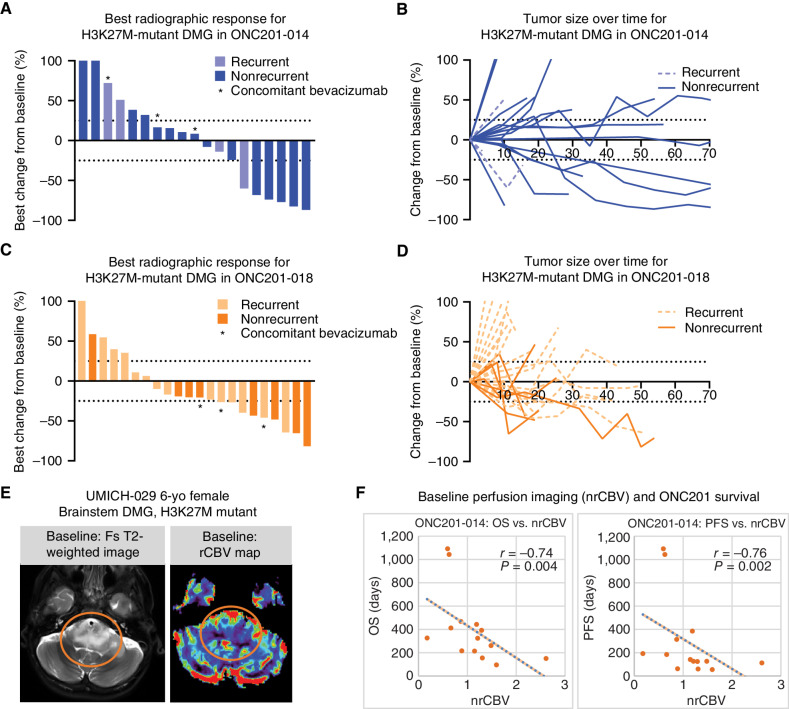
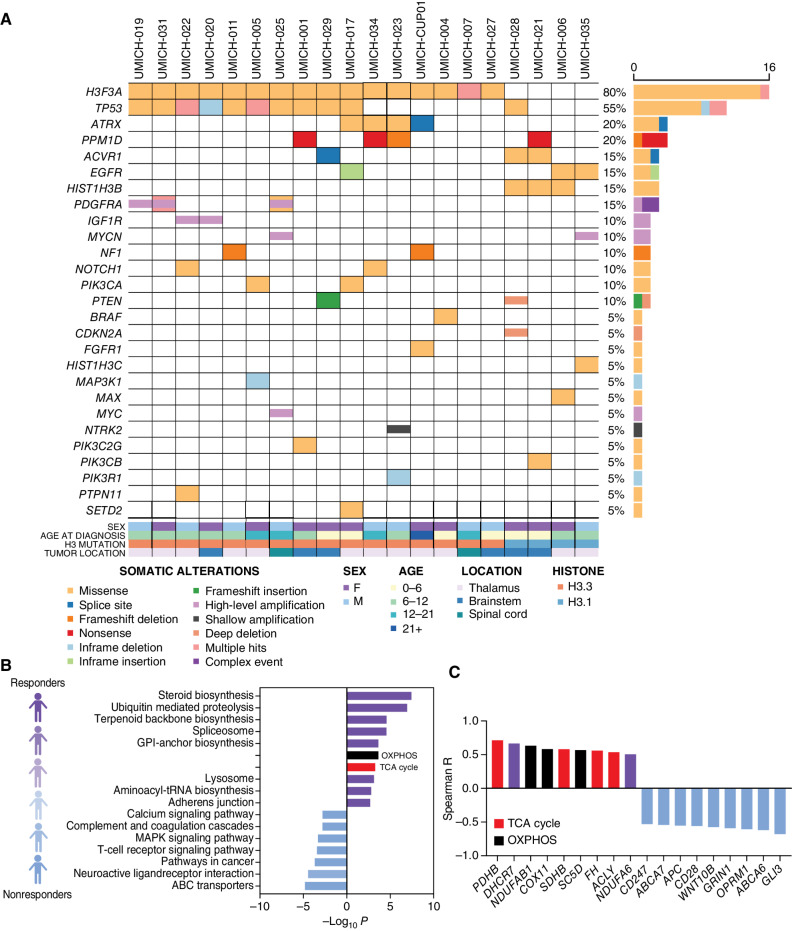
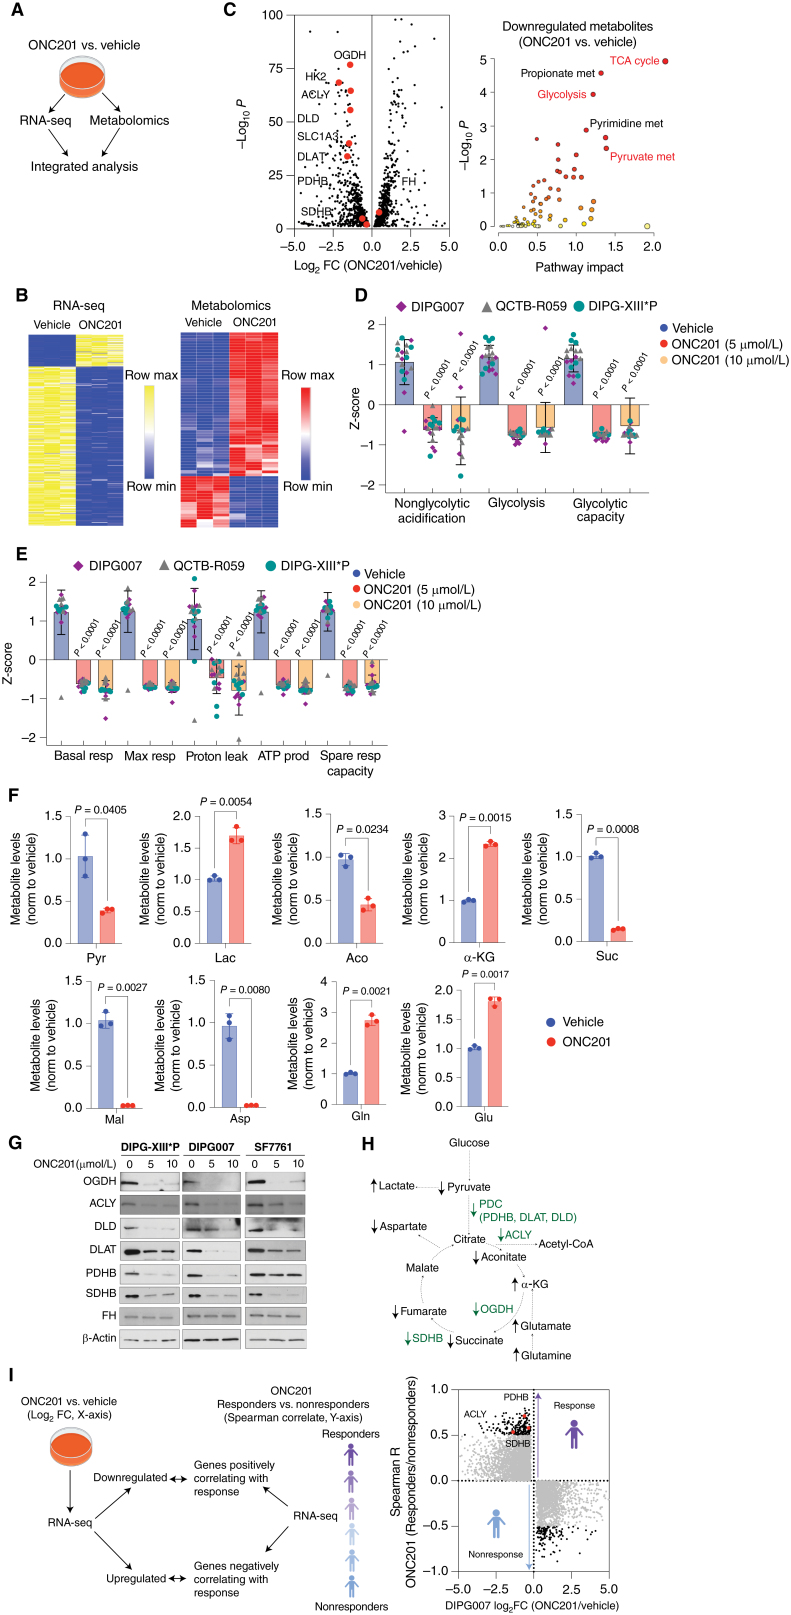
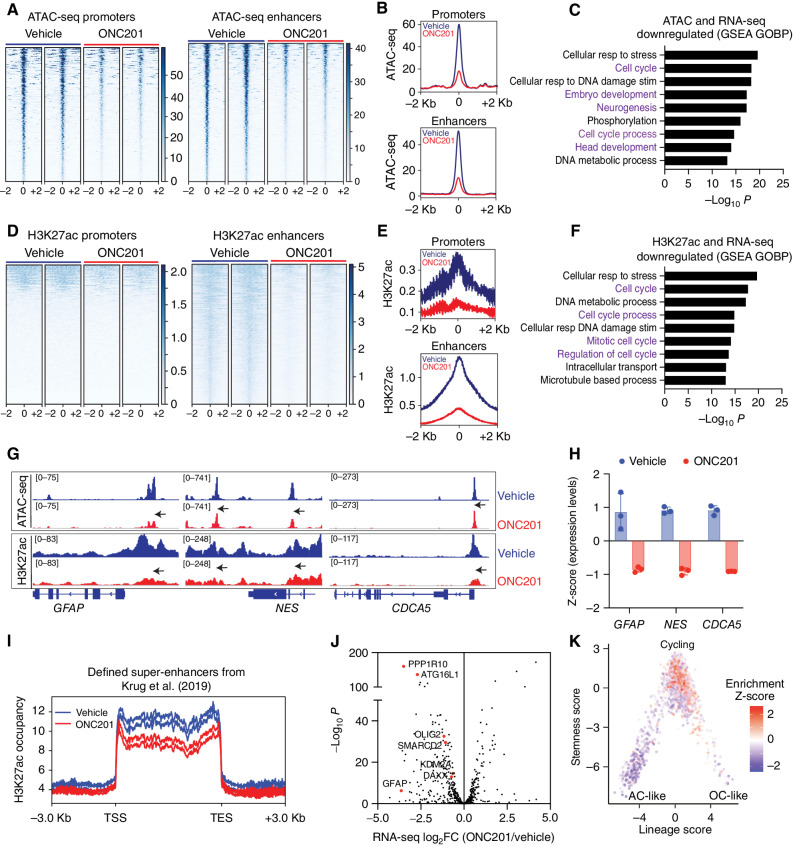
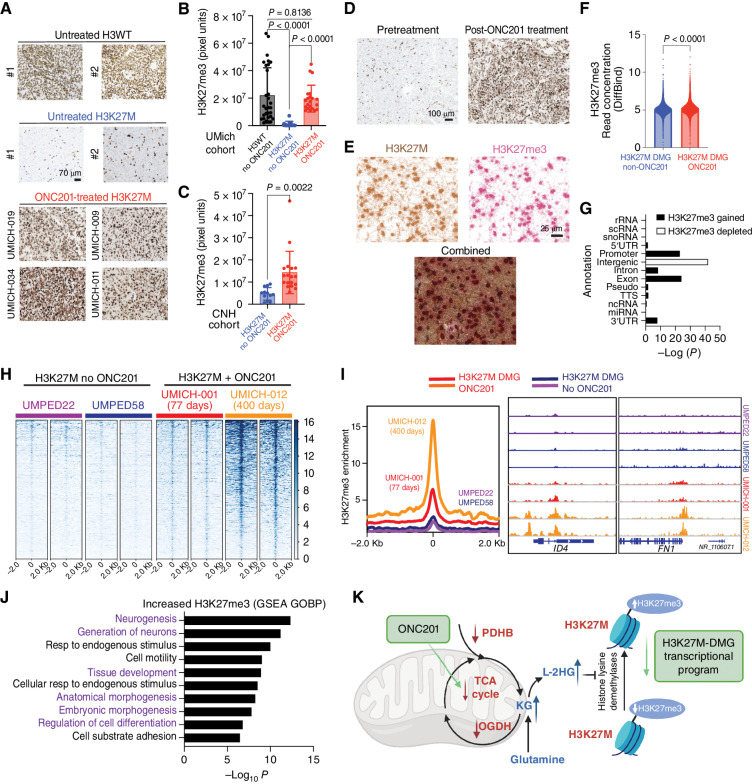
Patients with H3K27M-mutant diffuse midline glioma (DMG) have no proven effective therapies. ONC201 has recently demonstrated efficacy in these patients, but the mechanism behind this finding remains unknown. We assessed clinical outcomes, tumor sequencing, and tissue/cerebrospinal fluid (CSF) correlate samples from patients treated in two completed multisite clinical studies. Patients treated with ONC201 following initial radiation but prior to recurrence demonstrated a median overall survival of 21.7 months, whereas those treated after recurrence had a median overall survival of 9.3 months. Radiographic response was associated with increased expression of key tricarboxylic acid cycle-related genes in baseline tumor sequencing. ONC201 treatment increased 2-hydroxyglutarate levels in cultured H3K27M-DMG cells and patient CSF samples. This corresponded with increases in repressive H3K27me3 in vitro and in human tumors accompanied by epigenetic downregulation of cell cycle regulation and neuroglial differentiation genes. Overall, ONC201 demonstrates efficacy in H3K27M-DMG by disrupting integrated metabolic and epigenetic pathways and reversing pathognomonic H3K27me3 reduction.

Significance: The clinical, radiographic, and molecular analyses included in this study demonstrate the efficacy of ONC201 in H3K27M-mutant DMG and support ONC201 as the first monotherapy to improve outcomes in H3K27M-mutant DMG beyond radiation. Mechanistically, ONC201 disrupts integrated metabolic and epigenetic pathways and reverses pathognomonic H3K27me3 reduction. This article is featured in Selected Articles from This Issue, p. 2293.


Figures

Figure 1. Survival outcomes of trial patients with H3K27M-DMG treated with ONC201. A, Kaplan–Meier curve (Y-axis, % OS; X-axis, time in months) showing OS from diagnosis for patients with nonrecurrent H3K27M-DMG treated with ONC201 by study (ONC201-014, blue, n = 24; ONC201-018, light blue, n = 11; and ONC201-014/018 combined, orange, n = 35). B, Kaplan–Meier curve (Y-axis, % PFS; X-axis, time in months) showing PFS from the start of therapy for patients with nonrecurrent H3K27M-DMG treated with ONC201 by study (ONC201-014, ONC201-018, and ONC201-014/018 combined). C, Kaplan–Meier curve (Y-axis, % OS; X-axis, time in months) showing OS from recurrence for recurrent H3K27M-DMG patients treated with ONC201 (ONC201-014/018 combined, orange, n = 36). D, Kaplan–Meier curve (Y-axis, % PFS; X-axis, time in months) showing PFS from recurrence for patients with recurrent H3K27M-DMG treated with ONC201 (ONC201-014/018 combined).
Figure 1.
Survival outcomes of trial patients with H3K27M-DMG treated with ONC201. A, Kaplan–Meier curve (Y-axis, % OS; X-axis, time in months) showing OS from diagnosis for patients with nonrecurrent H3K27M-DMG treated with ONC201 by study (ONC201-014, blue, n = 24; ONC201-018, light blue, n = 11; and ONC201-014/018 combined, orange, n = 35). B, Kaplan–Meier curve (Y-axis, % PFS; X-axis, time in months) showing PFS from the start of therapy for patients with nonrecurrent H3K27M-DMG treated with ONC201 by study (ONC201-014, ONC201-018, and ONC201-014/018 combined). C, Kaplan–Meier curve (Y-axis, % OS; X-axis, time in months) showing OS from recurrence for recurrent H3K27M-DMG patients treated with ONC201 (ONC201-014/018 combined, orange, n = 36). D, Kaplan–Meier curve (Y-axis, % PFS; X-axis, time in months) showing PFS from recurrence for patients with recurrent H3K27M-DMG treated with ONC201 (ONC201-014/018 combined).
Figure 2. Radiographic assessment of trial patients with H3K27M-DMG treated with ONC201. A and B, Waterfall (A) and spider (B) plots representing a radiographic response to ONC201 for patients with H3K27M-DMG from ONC201-014 (n = 4, recurrent, light blue; and n = 15, nonrecurrent, blue). Waterfall plot shows the best change from baseline in tumor burden (Y-axis) by RANO-HGG. C and D, Waterfall (C) and spider (D) plots representing a radiographic response to ONC201 for patients with H3K27M-DMG from ONC201-018 (n = 14, recurrent, light orange; and n = 8, nonrecurrent, orange). Waterfall plot shows the best change from baseline in tumor burden (Y-axis) by RANO-HGG. E, Representative dynamic susceptibility contrast perfusion MRI images from UMICH-029 (nonrecurrent brainstem H3K27M-DMG; post-radiation). F, Correlation between normalized relative cerebral blood volume (X-axis, nrCBV) versus OS (left) or PFS (right) in H3K27M-DMGs from ONC201-014 (n = 14). Spearman correlation coefficient R and P values are indicated.
Figure 2.
Radiographic assessment of trial patients with H3K27M-DMG treated with ONC201. A and B, Waterfall (A) and spider (B) plots representing a radiographic response to ONC201 for patients with H3K27M-DMG from ONC201-014 (n = 4, recurrent, light blue; and n = 15, nonrecurrent, blue). Waterfall plot shows the best change from baseline in tumor burden (Y-axis) by RANO-HGG. C and D, Waterfall (C) and spider (D) plots representing a radiographic response to ONC201 for patients with H3K27M-DMG from ONC201-018 (n = 14, recurrent, light orange; and n = 8, nonrecurrent, orange). Waterfall plot shows the best change from baseline in tumor burden (Y-axis) by RANO-HGG. E, Representative dynamic susceptibility contrast perfusion MRI images from UMICH-029 (nonrecurrent brainstem H3K27M-DMG; post-radiation). F, Correlation between normalized relative cerebral blood volume (X-axis, nrCBV) versus OS (left) or PFS (right) in H3K27M-DMGs from ONC201-014 (n = 14). Spearman correlation coefficient R and P values are indicated.
Figure 3. Molecular attributes of trial patients with H3K27M-DMG treated with ONC201. A, Somatic driver gene alterations in the UMich cohort (n = 20, nonrecurrent H3K27M-DMG) treated with ONC201 for whom baseline DNA (n = 20)/mRNA (n = 13) sequencing was obtained. B, Correlation between individual gene expression levels (RNA) and best tumor response (defined as percentage radiographic reduction in tumor area relative to diagnosis) was performed in nonrecurrent H3K27M-DMG (n = 13). Bar graph depicts GSEA of genes associated with positive (top 500 genes, purple; red = TCA cycle; black = OXPHOS) or negative (bottom 500 genes, light blue) correlation with radiographic response to ONC201 treatment. C, Representative significant TCA cycle–related (red), OXPHOS (black), and other genes with positive (purple) or negative (light blue) correlation (Y-axis, Spearman correlation coefficient R).
Figure 3.
Molecular attributes of trial patients with H3K27M-DMG treated with ONC201. A, Somatic driver gene alterations in the UMich cohort (n = 20, nonrecurrent H3K27M-DMG) treated with ONC201 for whom baseline DNA (n = 20)/mRNA (n = 13) sequencing was obtained. B, Correlation between individual gene expression levels (RNA) and best tumor response (defined as percentage radiographic reduction in tumor area relative to diagnosis) was performed in nonrecurrent H3K27M-DMG (n = 13). Bar graph depicts GSEA of genes associated with positive (top 500 genes, purple; red = TCA cycle; black = OXPHOS) or negative (bottom 500 genes, light blue) correlation with radiographic response to ONC201 treatment. C, Representative significant TCA cycle–related (red), OXPHOS (black), and other genes with positive (purple) or negative (light blue) correlation (Y-axis, Spearman correlation coefficient R).
Figure 4. ONC201 radiographic response relates to expression of metabolic enzymes. A, H3.3K27M DIPG007 cells were treated with vehicle or 5 μmol/L ONC201 for 48 hours (n = 3, each), following which RNA-seq and unbiased metabolomics were performed. Joint pathway impact analysis was performed in an integrated manner using metaboanalyst (https://www.metaboanalyst.ca/). B, Heat maps demonstrating both upregulated and downregulated genes from RNA-seq (left) and metabolites (right) upon ONC201 versus vehicle treatment. C, Integrated results from downregulated genes are represented as a volcano plot (left, gene expression; X-axis, Log2 fold change in expression levels, ONC201 versus vehicle; Y-axis, corresponding −Log10 P) and a pathway impact analysis plot (right, metabolites; X-axis, pathway impact, ONC201 versus vehicle; Y-axis, corresponding −Log10 P). D, Seahorse data of glycolysis stress tests in H3.3K27M-DMG cells (n = 6–8 replicates per cell line; see Supplementary Fig. S10C). E, Seahorse data of oxidative phosphorylation stress tests in H3.3K27M-DMG cells (n = 6–8 replicates per cell line; see Supplementary Fig. S10D). F, Bar graph illustrating differential glycolysis and TCA cycle–related metabolites in ONC201-treated (n = 3, red) or vehicle-treated (n = 3, blue) cells. G, Immunoblots for OGDH, ACLY, DLD, DLAT, PDHB, SDHB, and FH in H3.3K27M DIPGXIII*P, DIPG007, and SF7761 low passage, patient-derived cell lines. β-actin was probed as a loading control. H, Abbreviated scheme of glycolysis and TCA cycle metabolism demonstrating altered genes (green) and metabolites (black). I, RNA-seq data in ONC201- or vehicle-treated DIPG007 cells from A (X-axis, Log2 fold change) were compared with Spearman correlation coefficient R (Y-axis, correlation between gene expression levels and best tumor response from Fig. 3B) in ONC201-treated nonrecurrent H3K27M-DMGs. Pyr, pyruvate; Lac, lactate; Aco, aconitate; ±-KG, alpha-ketoglutarate; Suc, succinate; Mal, malate; Asp, aspartate; Gln, glutamine; Glu, glutamate; OGDH, oxoglutarate dehydrogenase; HK2, hexokinase 2; ACLY, ATP citrate lyase; DLD, dihydrolipoamide dehydrogenase; SLC1A3, glucose transporter 3; DLAT, dihydrolipoamide acetyltransferase; PDHB, pyruvate dehydrogenase B; and PDC, pyruvate dehydrogenase complex.
Figure 4.
ONC201 radiographic response relates to expression of metabolic enzymes. A, H3.3K27M DIPG007 cells were treated with vehicle or 5 μmol/L ONC201 for 48 hours (n = 3, each), following which RNA-seq and unbiased metabolomics were performed. Joint pathway impact analysis was performed in an integrated manner using metaboanalyst (https://www.metaboanalyst.ca/). B, Heat maps demonstrating both upregulated and downregulated genes from RNA-seq (left) and metabolites (right) upon ONC201 versus vehicle treatment. C, Integrated results from downregulated genes are represented as a volcano plot (left, gene expression; X-axis, Log2 fold change in expression levels, ONC201 versus vehicle; Y-axis, corresponding −Log10P) and a pathway impact analysis plot (right, metabolites; X-axis, pathway impact, ONC201 versus vehicle; Y-axis, corresponding −Log10P). D, Seahorse data of glycolysis stress tests in H3.3K27M-DMG cells (n = 6–8 replicates per cell line; see Supplementary Fig. S10C). E, Seahorse data of oxidative phosphorylation stress tests in H3.3K27M-DMG cells (n = 6–8 replicates per cell line; see Supplementary Fig. S10D). F, Bar graph illustrating differential glycolysis and TCA cycle–related metabolites in ONC201-treated (n = 3, red) or vehicle-treated (n = 3, blue) cells. G, Immunoblots for OGDH, ACLY, DLD, DLAT, PDHB, SDHB, and FH in H3.3K27M DIPGXIII*P, DIPG007, and SF7761 low passage, patient-derived cell lines. β-actin was probed as a loading control. H, Abbreviated scheme of glycolysis and TCA cycle metabolism demonstrating altered genes (green) and metabolites (black). I, RNA-seq data in ONC201- or vehicle-treated DIPG007 cells from A (X-axis, Log2 fold change) were compared with Spearman correlation coefficient R (Y-axis, correlation between gene expression levels and best tumor response from Fig. 3B) in ONC201-treated nonrecurrent H3K27M-DMGs. Pyr, pyruvate; Lac, lactate; Aco, aconitate; ±-KG, alpha-ketoglutarate; Suc, succinate; Mal, malate; Asp, aspartate; Gln, glutamine; Glu, glutamate; OGDH, oxoglutarate dehydrogenase; HK2, hexokinase 2; ACLY, ATP citrate lyase; DLD, dihydrolipoamide dehydrogenase; SLC1A3, glucose transporter 3; DLAT, dihydrolipoamide acetyltransferase; PDHB, pyruvate dehydrogenase B; and PDC, pyruvate dehydrogenase complex.
Figure 5. ONC201 disrupts integrated metabolic and epigenetic pathways. A, Schema of [13C5]-glutamine tracing into the TCA cycle indicating predicted mass isotopes (m+4 or +5) for each metabolite. B, Bar graph demonstrating glutamine carbon incorporation in various metabolites (specific m+4 or +5 mass isotopes indicated) in H3.3K27M DIPG-007 cells treated with vehicle (blue) or 5 μmol/L ONC201 (red) for 48 hours (n = 3, each). C, Bar graph showing 2HG levels (Y-axis, Z-scores, measured by LC-MS) in H3.3K27M DIPGXIII*P, DIPG-007, and SF7761 cells treated with vehicle (blue) or 5 μmol/L ONC201 (red) for 48 hours (n = 3–4, each). D, Box and whisker plots showing metabolite measurements (Y-axis, ratio of metabolite pretreatment to posttreatment, a.u.) in CSF samples from ONC201-treated patients with H3K27M-DMG classified as responders and nonresponders (n = 4, each). Patients who showed a reduction in >50% tumor volume (per RANO criteria) on ONC201 were defined as responders. E, Tumor area (left Y-axis, purple line) and CSF 2HG levels (right Y-axis, red line) plotted against time (X-axis) from responder patient UMICH-006. F, Tumor area (left Y-axis, blue line) and CSF 2HG levels (right Y-axis, red line) plotted against time (X-axis) from nonresponder patient UMICH-022. Asterisks denote time points with metastatic disease. G, Bar plot showing D-2HG enantiomer-specific mass spectroscopy performed in H3.3K27M DIPG007, SF7761, and DIPGXIII*P cells treated with vehicle or ONC201 (5 μmol/L, 48 hours) and IDH1 R132H-mutant TB096 glioma cells. Quantification of D-2HG (μmol/mg protein, X-axis) is shown for ONC201-treated (brown) and DMSO-treated (green) cells. n = 4 for each condition. Data were analyzed using unpaired, two-sided, two-tailed, Student t test. H, Bar plot showing L-2HG enantiomer-specific mass spectroscopy performed in H3.3K27M DIPG007, SF7761, and DIPGXIII*P cells treated with vehicle or ONC201 (5 μmol/L, 48 hours) and IDH1 R132H-mutant TB096 glioma cells. Quantification of L-2HG (μmol/mg protein, X-axis) is shown for ONC201-treated (red) and DMSO-treated (blue) cells. n = 4 for each condition. Data were analyzed using an unpaired, two-sided, two-tailed, Student t test. I, Cartoon illustrating L-2HG inhibition of Jumonji C (JmjC) domain histone lysine demethylases resulting in increased histone methylation. J, H3.3K27M (DIPG007, DIPGXIII*P, H3.3K27M mNSC, and SF7761) and H3.1K27M (UON-JUMP4) cells were treated with 5 or 10 μmol/L ONC201 for 48 hours. Cells were probed for H3K27me3, H3K36me3, H3K9me3, H3K4me3, H3K27M, and total H3 (as loading control). The arrowhead indicates increased H3K27me3 and H3K36me3 across all cell lines. K, Cartoon illustrating L-2HG production from ±-KG by “promiscuous” activity of LDHA and L-2HG-specific dehydrogenase L-2HGDH converting L-2HG back to ±-KG. L, Left, H3.3K27M SF7761 cells transduced with or without shLDHA were probed for LDHA. Vinculin was used as a loading control. Right, SF7761 cells with or without LDHA knocked down were treated with vehicle or ONC201 (5 μmol/L, 48 hours) and probed for H3K27me3 and total H3 (as loading control). Arrowhead indicates H3K27me3. M, Left, L-2HGDH was overexpressed (o.e.) in H3.3K27M SF7761 cells. Cells were then probed for L-2HGDH. Vinculin was used as a loading control. Right, SF7761 cells with L-2HGDH overexpression were treated with vehicle or ONC201 (5 μmol/L, 48 hours) and probed for H3K27me3 and total H3 (as loading control). Arrowhead indicates H3K27me3. N, Left, D-2HGDH was overexpressed (o.e.) in H3.3K27M SF7761 cells. Cells were then probed for D-2HGDH. Vinculin was used as a loading control. Right, SF7761 cells with D-2HGDH overexpression were treated with vehicle or ONC201 (5 μmol/L, 48 hours) and probed for H3K27me3 and total H3 (as loading control). Arrowhead indicates H3K27me3.
Figure 5.
ONC201 disrupts integrated metabolic and epigenetic pathways. A, Schema of [13C5]-glutamine tracing into the TCA cycle indicating predicted mass isotopes (m+4 or +5) for each metabolite. B, Bar graph demonstrating glutamine carbon incorporation in various metabolites (specific m+4 or +5 mass isotopes indicated) in H3.3K27M DIPG-007 cells treated with vehicle (blue) or 5 μmol/L ONC201 (red) for 48 hours (n = 3, each). C, Bar graph showing 2HG levels (Y-axis, Z-scores, measured by LC-MS) in H3.3K27M DIPGXIII*P, DIPG-007, and SF7761 cells treated with vehicle (blue) or 5 μmol/L ONC201 (red) for 48 hours (n = 3–4, each). D, Box and whisker plots showing metabolite measurements (Y-axis, ratio of metabolite pretreatment to posttreatment, a.u.) in CSF samples from ONC201-treated patients with H3K27M-DMG classified as responders and nonresponders (n = 4, each). Patients who showed a reduction in >50% tumor volume (per RANO criteria) on ONC201 were defined as responders. E, Tumor area (left Y-axis, purple line) and CSF 2HG levels (right Y-axis, red line) plotted against time (X-axis) from responder patient UMICH-006. F, Tumor area (left Y-axis, blue line) and CSF 2HG levels (right Y-axis, red line) plotted against time (X-axis) from nonresponder patient UMICH-022. Asterisks denote time points with metastatic disease. G, Bar plot showing D-2HG enantiomer-specific mass spectroscopy performed in H3.3K27M DIPG007, SF7761, and DIPGXIII*P cells treated with vehicle or ONC201 (5 μmol/L, 48 hours) and IDH1 R132H-mutant TB096 glioma cells. Quantification of D-2HG (μmol/mg protein, X-axis) is shown for ONC201-treated (brown) and DMSO-treated (green) cells. n = 4 for each condition. Data were analyzed using unpaired, two-sided, two-tailed, Student t test. H, Bar plot showing L-2HG enantiomer-specific mass spectroscopy performed in H3.3K27M DIPG007, SF7761, and DIPGXIII*P cells treated with vehicle or ONC201 (5 μmol/L, 48 hours) and IDH1 R132H-mutant TB096 glioma cells. Quantification of L-2HG (μmol/mg protein, X-axis) is shown for ONC201-treated (red) and DMSO-treated (blue) cells. n = 4 for each condition. Data were analyzed using an unpaired, two-sided, two-tailed, Student t test. I, Cartoon illustrating L-2HG inhibition of Jumonji C (JmjC) domain histone lysine demethylases resulting in increased histone methylation. J, H3.3K27M (DIPG007, DIPGXIII*P, H3.3K27M mNSC, and SF7761) and H3.1K27M (UON-JUMP4) cells were treated with 5 or 10 μmol/L ONC201 for 48 hours. Cells were probed for H3K27me3, H3K36me3, H3K9me3, H3K4me3, H3K27M, and total H3 (as loading control). The arrowhead indicates increased H3K27me3 and H3K36me3 across all cell lines. K, Cartoon illustrating L-2HG production from ±-KG by “promiscuous” activity of LDHA and L-2HG-specific dehydrogenase L-2HGDH converting L-2HG back to ±-KG. L, Left, H3.3K27M SF7761 cells transduced with or without shLDHA were probed for LDHA. Vinculin was used as a loading control. Right, SF7761 cells with or without LDHA knocked down were treated with vehicle or ONC201 (5 μmol/L, 48 hours) and probed for H3K27me3 and total H3 (as loading control). Arrowhead indicates H3K27me3. M, Left, L-2HGDH was overexpressed (o.e.) in H3.3K27M SF7761 cells. Cells were then probed for L-2HGDH. Vinculin was used as a loading control. Right, SF7761 cells with L-2HGDH overexpression were treated with vehicle or ONC201 (5 μmol/L, 48 hours) and probed for H3K27me3 and total H3 (as loading control). Arrowhead indicates H3K27me3. N, Left, D-2HGDH was overexpressed (o.e.) in H3.3K27M SF7761 cells. Cells were then probed for D-2HGDH. Vinculin was used as a loading control. Right, SF7761 cells with D-2HGDH overexpression were treated with vehicle or ONC201 (5 μmol/L, 48 hours) and probed for H3K27me3 and total H3 (as loading control). Arrowhead indicates H3K27me3.
Figure 6. ONC201 reduces chromatin accessibility at genes related to cell cycle and neuroglial differentiation. A, Heat maps showing chromatin accessibility (ATAC-seq) at promoters and enhancers (± 2 Kb from peak center) in H3.3K27M DIPG007 cells treated with vehicle or ONC201 (5 μmol/L ONC201 for 48 hours, n = 2, each). B, Overall peak representation of ATAC-seq data from A (ONC201 = red, veh = blue). C, GSEA of genes with decreased chromatin accessibility (ATAC-seq) at promoters and enhancers from A and B. D, Heat maps showing genomic H3K27ac at promoters and enhancers (± 2 Kb from peak center) in DIPG007 cells treated with vehicle or ONC201 (5 μmol/L ONC201 for 48 hours, n = 2, each). E, Overall peak representation of H3K27ac data from D (ONC201 = red, veh = blue). F, GSEA of genes with decreased H3K27ac enrichment at promoters and enhancers and reduced gene expression from D and E. G, Representative ATAC-seq and H3K27ac ChIP-seq tracks from ONC201-treated (red) or vehicle-treated (blue) cells at GFAP, NES, and CDCA5. H, Expression of GFAP, NES, and CDCA5 in ONC201-treated (red) or vehicle-treated (blue) cells. I, H3K27ac-enriched super-enhancers defined by Krug et al. (37) in H3K27M tumors were analyzed in ONC201-treated (red) versus vehicle-treated (blue) H3.3K27M DIPG007 cells. J, Volcano plot of gene expression from RNA-seq (X-axis, Log2FC, ONC201 versus vehicle) plotted against −Log10 P (Y-axis) for genes with decreased H3K27ac-marked superenhancers in ONC201-treated versus vehicle-treated cells from I. K, Plot of downregulated H3K27ac-marked genes projected on previously published single-cell RNA-seq data (50) from human H3K27M-DMG samples (n = 6) as plotted stemness (Y-axis) versus lineage (X-axis) scores.
Figure 6.
ONC201 reduces chromatin accessibility at genes related to cell cycle and neuroglial differentiation. A, Heat maps showing chromatin accessibility (ATAC-seq) at promoters and enhancers (± 2 Kb from peak center) in H3.3K27M DIPG007 cells treated with vehicle or ONC201 (5 μmol/L ONC201 for 48 hours, n = 2, each). B, Overall peak representation of ATAC-seq data from A (ONC201 = red, veh = blue). C, GSEA of genes with decreased chromatin accessibility (ATAC-seq) at promoters and enhancers from A and B. D, Heat maps showing genomic H3K27ac at promoters and enhancers (± 2 Kb from peak center) in DIPG007 cells treated with vehicle or ONC201 (5 μmol/L ONC201 for 48 hours, n = 2, each). E, Overall peak representation of H3K27ac data from D (ONC201 = red, veh = blue). F, GSEA of genes with decreased H3K27ac enrichment at promoters and enhancers and reduced gene expression from D and E. G, Representative ATAC-seq and H3K27ac ChIP-seq tracks from ONC201-treated (red) or vehicle-treated (blue) cells at GFAP, NES, and CDCA5. H, Expression of GFAP, NES, and CDCA5 in ONC201-treated (red) or vehicle-treated (blue) cells. I, H3K27ac-enriched super-enhancers defined by Krug et al. (37) in H3K27M tumors were analyzed in ONC201-treated (red) versus vehicle-treated (blue) H3.3K27M DIPG007 cells. J, Volcano plot of gene expression from RNA-seq (X-axis, Log2FC, ONC201 versus vehicle) plotted against −Log10P (Y-axis) for genes with decreased H3K27ac-marked superenhancers in ONC201-treated versus vehicle-treated cells from I. K, Plot of downregulated H3K27ac-marked genes projected on previously published single-cell RNA-seq data (50) from human H3K27M-DMG samples (n = 6) as plotted stemness (Y-axis) versus lineage (X-axis) scores.
Figure 7. ONC201 treatment increases genomic H3K27me3 in H3K27M-DMG patient tumors. A, Representative images of tumor samples stained for H3K27me3 from untreated H3WT, untreated H3K27M-DMG, and ONC201-treated H3K27M-DMG patient tumor samples. B, Quantification of H3K27me3 (3 regions were captured in multiple tumor areas in a blinded manner/case) in H3WT non–ONC201-treated (n = 10, black), H3K27M non–ONC201-treated (n = 11, blue), or H3K27M ONC201-treated (n = 6, red) patient samples from the UMich Cohort. Data were analyzed using ANOVA. C, Quantification of H3K27me3 (3 regions were captured in multiple tumor areas in a blinded manner/case) in H3K27M non–ONC201-treated (n = 4, blue) or H3K27M ONC201-treated (n = 6, red) independent, nonoverlapping patient samples from the Children's National Hospital (CNH) Cohort. Data were analyzed using an unpaired, two-tailed, two-sided, nonparametric Mann–Whitney test. D, Representative images of H3K27M-DMG tumor samples from the UMich cohort stained for H3K27me3 from the same patient pretreatment (biopsy) or post-ONC201 treatment (autopsy). Data were analyzed using unpaired, two-tailed, two-sided, Student t test. E, Representative images from an ONC201-treated H3K27M-DMG tumor sample from the UMich Cohort stained with combined IHC for H3K27M (brown) and H3K27me3 (red). Images show brown or red chromogens or an overlay of both. F, Overall genome-wide H3K27me3 in ChIP-seq from H3K27M-DMG tumor samples treated with or without ONC201 treatment (n = 2 patients per condition). Data were analyzed using an unpaired, two-tailed, two-sided, nonparametric Mann–Whitney test. G, Comparison of genomic H3K27me3 in H3K27M-DMGs tumor samples derived from patients treated with (n = 2) or without (n = 2) ONC201 from F. H, Heat maps showing genomic H3K27me3 levels (± 2 Kb from peak center) in H3K27M-DMG tumor samples with (patients UMICH-001 and UMICH-012) or without (patients UMPED22 and UMPED58) ONC201 treatment. Each set of two heat maps represents replicates obtained from different tumor regions for each patient. I, Left, overall peak representation of genomic H3K27me3 in ONC201-treated (UMICH-001, orange; and UMICH-012, red) and non–ONC201-treated H3K27M-DMGs (UMPED22, purple; and UMPED58, blue). Right, representative H3K27me3 tracks for genes ID4 and FN1 from each tumor sample. J, GSEA of genes with significantly increased H3K27me3 in ONC201-treated versus untreated patients from F–I. K, Schema of the overall proposed mechanism of ONC201 impact on metabolic and epigenetic signaling in H3K27M-DMGs.
Figure 7.
ONC201 treatment increases genomic H3K27me3 in H3K27M-DMG patient tumors. A, Representative images of tumor samples stained for H3K27me3 from untreated H3WT, untreated H3K27M-DMG, and ONC201-treated H3K27M-DMG patient tumor samples. B, Quantification of H3K27me3 (3 regions were captured in multiple tumor areas in a blinded manner/case) in H3WT non–ONC201-treated (n = 10, black), H3K27M non–ONC201-treated (n = 11, blue), or H3K27M ONC201-treated (n = 6, red) patient samples from the UMich Cohort. Data were analyzed using ANOVA. C, Quantification of H3K27me3 (3 regions were captured in multiple tumor areas in a blinded manner/case) in H3K27M non–ONC201-treated (n = 4, blue) or H3K27M ONC201-treated (n = 6, red) independent, nonoverlapping patient samples from the Children's National Hospital (CNH) Cohort. Data were analyzed using an unpaired, two-tailed, two-sided, nonparametric Mann–Whitney test. D, Representative images of H3K27M-DMG tumor samples from the UMich cohort stained for H3K27me3 from the same patient pretreatment (biopsy) or post-ONC201 treatment (autopsy). Data were analyzed using unpaired, two-tailed, two-sided, Student t test. E, Representative images from an ONC201-treated H3K27M-DMG tumor sample from the UMich Cohort stained with combined IHC for H3K27M (brown) and H3K27me3 (red). Images show brown or red chromogens or an overlay of both. F, Overall genome-wide H3K27me3 in ChIP-seq from H3K27M-DMG tumor samples treated with or without ONC201 treatment (n = 2 patients per condition). Data were analyzed using an unpaired, two-tailed, two-sided, nonparametric Mann–Whitney test. G, Comparison of genomic H3K27me3 in H3K27M-DMGs tumor samples derived from patients treated with (n = 2) or without (n = 2) ONC201 from F. H, Heat maps showing genomic H3K27me3 levels (± 2 Kb from peak center) in H3K27M-DMG tumor samples with (patients UMICH-001 and UMICH-012) or without (patients UMPED22 and UMPED58) ONC201 treatment. Each set of two heat maps represents replicates obtained from different tumor regions for each patient. I, Left, overall peak representation of genomic H3K27me3 in ONC201-treated (UMICH-001, orange; and UMICH-012, red) and non–ONC201-treated H3K27M-DMGs (UMPED22, purple; and UMPED58, blue). Right, representative H3K27me3 tracks for genes ID4 and FN1 from each tumor sample. J, GSEA of genes with significantly increased H3K27me3 in ONC201-treated versus untreated patients from F–I. K, Schema of the overall proposed mechanism of ONC201 impact on metabolic and epigenetic signaling in H3K27M-DMGs.

Comment in

References

    1. Mackay A, Burford A, Carvalho D, Izquierdo E, Fazal-Salom J, Taylor KR, et al. . Integrated molecular meta-analysis of 1,000 pediatric high-grade and diffuse intrinsic pontine glioma. Cancer Cell 2017;32:520–37. - PMC - PubMed
    1. Hoffman LM, Van Zanten SEV, Colditz N, Baugh J, Chaney B, Hoffmann M, et al. . Clinical, radiologic, pathologic, and molecular characteristics of long-term survivors of diffuse intrinsic pontine glioma (DIPG): a collaborative report from the International and European Society for Pediatric Oncology DIPG Registries. J Clin Oncol 2018;36:1963. - PMC - PubMed
    1. Miklja Z, Pasternak A, Stallard S, Nicolaides T, Kline-Nunnally C, Cole B, et al. . Molecular profiling and targeted therapy in pediatric gliomas: review and consensus recommendations. Neuro Oncol 2019;21:968–80. - PMC - PubMed
    1. Miklja Z, Yadav VN, Cartaxo RT, Siada R, Thomas CC, Cummings JR, et al. . Everolimus improves the efficacy of dasatinib in PDGFRalpha-driven glioma. J Clin Invest 2020;130:5313–25. - PMC - PubMed
    1. Prabhu VV, Madhukar NS, Gilvary C, Kline CLB, Oster S, El-Deiry WS, et al. . Dopamine receptor D5 is a modulator of tumor response to dopamine receptor D2 antagonism. Clin Cancer Res 2019;25:2305–13. - PMC - PubMed

Publication types