

Continuous home cage monitoring of activity and sleep in mice during repeated paroxetine treatment and discontinuation
- PMID: 37584734
- PMCID: PMC10593620
- DOI: 10.1007/s00213-023-06442-3
Continuous home cage monitoring of activity and sleep in mice during repeated paroxetine treatment and discontinuation
Abstract
Rationale: Non-invasive home cage monitoring is emerging as a valuable tool to assess the effects of experimental interventions on mouse behaviour. A field in which these techniques may prove useful is the study of repeated selective serotonin reuptake inhibitor (SSRI) treatment and discontinuation. SSRI discontinuation syndrome is an under-researched condition that includes the emergence of sleep disturbances following treatment cessation.
Objectives: We used passive infrared (PIR) monitoring to investigate changes in activity, sleep, and circadian rhythms during repeated treatment with the SSRI paroxetine and its discontinuation in mice.
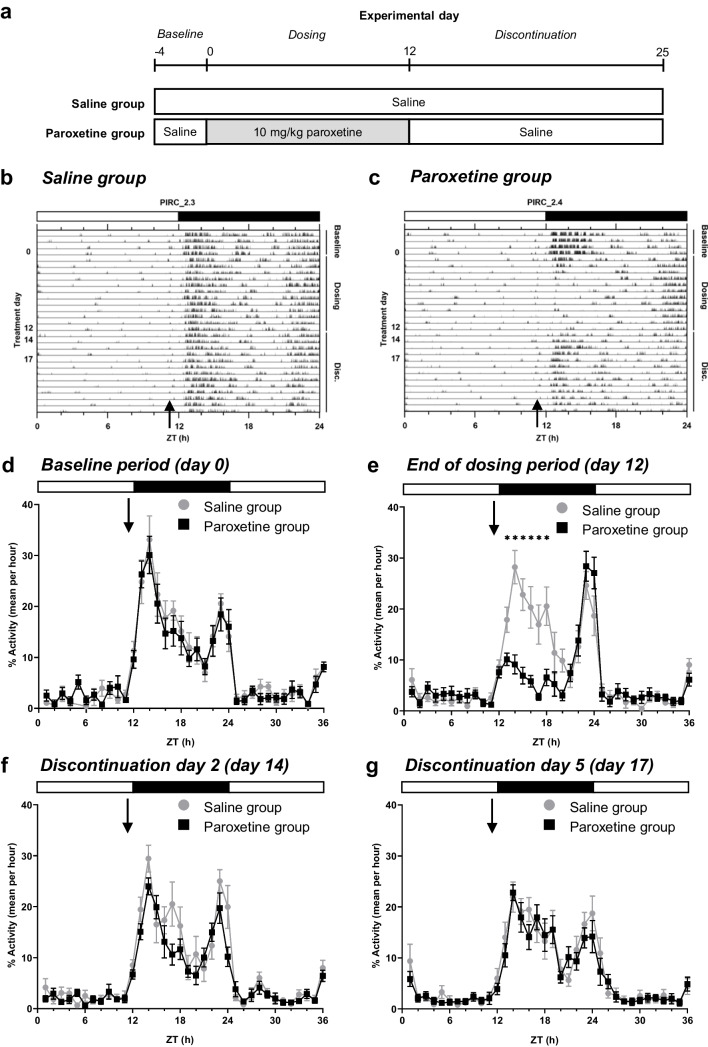
Methods: Male mice received paroxetine (10 mg/kg/day, s.c.) for 12 days, then were swapped to saline injections for a 13 day discontinuation period and compared to mice that received saline injections throughout. Mice were continuously tracked using the Continuous Open Mouse Phenotyping of Activity and Sleep Status (COMPASS) system.
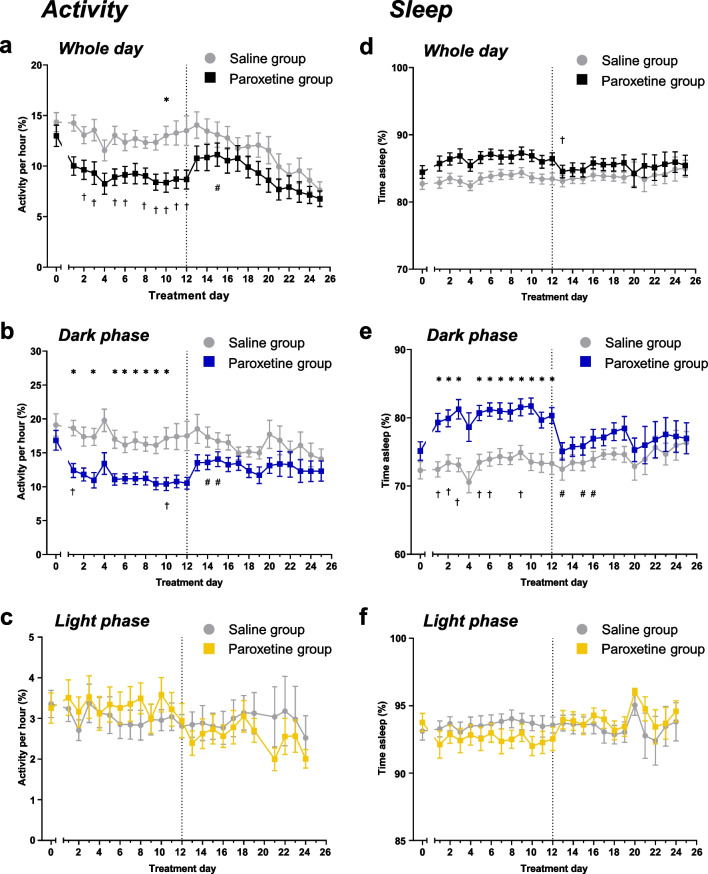
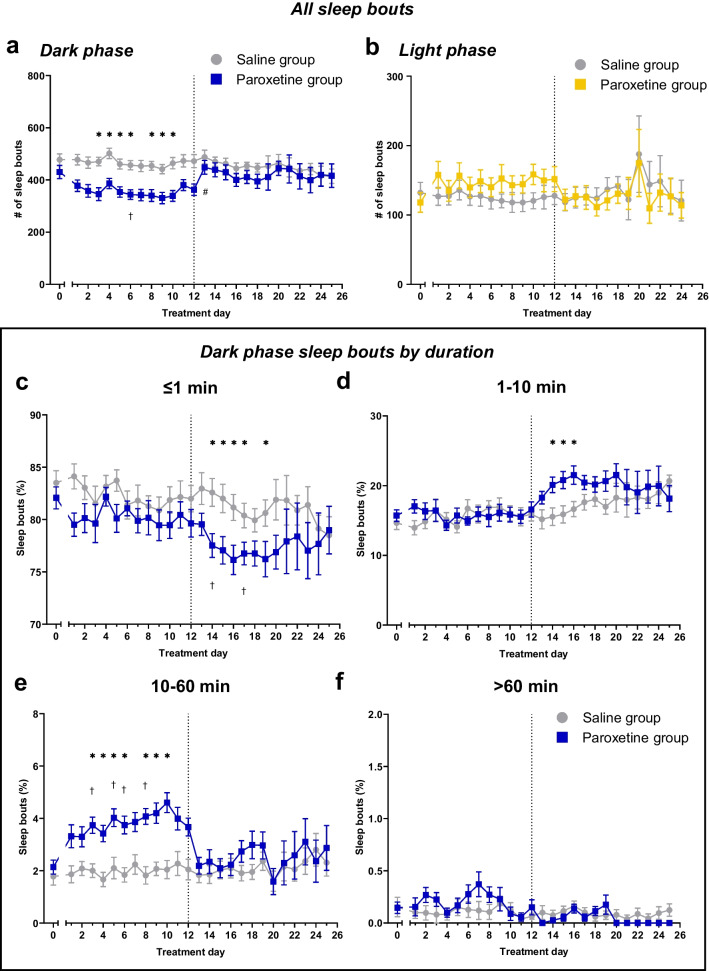
Results: Repeated paroxetine treatment reduced activity and increased behaviourally-defined sleep in the dark phase. These effects recovered to saline-control levels within 24 h of paroxetine cessation, yet there was also evidence of a lengthening of sleep bouts in the dark phase for up to a week following discontinuation.
Conclusions: This study provides the first example of how continuous non-invasive home cage monitoring can be used to detect objective behavioural changes in activity and sleep during and after drug treatment in mice. These data suggest that effects of paroxetine administration reversed soon after its discontinuation but identified an emergent change in sleep bout duration, which could be used as a biomarker in future preclinical studies to prevent or minimise SSRI discontinuation symptoms.
Keywords: Circadian rhythms; Home cage monitoring; Mice; Non-invasive; Paroxetine; SSRI; Sleep.
© 2023. The Author(s).
Figures

Similar articles
-
Rebound activation of 5-HT neurons following SSRI discontinuation.Neuropsychopharmacology. 2024 Sep;49(10):1580-1589. doi: 10.1038/s41386-024-01857-8. Epub 2024 Apr 12. Neuropsychopharmacology. 2024. PMID: 38609530 Free PMC article.
-
Effect of selective serotonin reuptake inhibitor discontinuation on anxiety-like behaviours in mice.J Psychopharmacol. 2022 Jul;36(7):794-805. doi: 10.1177/02698811221093032. Epub 2022 May 23. J Psychopharmacol. 2022. PMID: 35607713 Free PMC article.
-
Effects of fluvoxamine and paroxetine on sleep structure in normal subjects: a home-based Nightcap evaluation during drug administration and withdrawal.J Clin Psychiatry. 2001 Aug;62(8):642-52. doi: 10.4088/jcp.v62n0812. J Clin Psychiatry. 2001. PMID: 11561938 Clinical Trial.
-
Selective serotonin reuptake inhibitor discontinuation syndrome: proposed diagnostic criteria.J Psychiatry Neurosci. 2000 May;25(3):255-61. J Psychiatry Neurosci. 2000. PMID: 10863885 Free PMC article. Review.
-
Newer antidepressants and the discontinuation syndrome.J Clin Psychiatry. 1997;58 Suppl 7:17-21; discussion 22. J Clin Psychiatry. 1997. PMID: 9219489 Review.
Cited by
-
Far-red LED light alters circadian rhythms and elicits dark-adapted ERG responses in rodents.PLoS One. 2025 Jul 1;20(7):e0326710. doi: 10.1371/journal.pone.0326710. eCollection 2025. PLoS One. 2025. PMID: 40591566 Free PMC article.
-
Rebound activation of 5-HT neurons following SSRI discontinuation.Neuropsychopharmacology. 2024 Sep;49(10):1580-1589. doi: 10.1038/s41386-024-01857-8. Epub 2024 Apr 12. Neuropsychopharmacology. 2024. PMID: 38609530 Free PMC article.
References
-
- Ang G, Brown LA, Tam SKE, Davies KE, Foster RG, Harrison PJ, Sprengel R, Vyazovskiy VV, Oliver PL, Bannerman DM, Peirson SN. Deletion of AMPA receptor GluA1 subunit gene (Gria1) causes circadian rhythm disruption and aberrant responses to environmental cues. Transl Psychiatry. 2021;11:588. doi: 10.1038/s41398-021-01690-3. - DOI - PMC - PubMed
MeSH terms
Substances
Grants and funding
LinkOut - more resources
Full Text Sources
