Representation of Race and Ethnicity in the Contemporary US Health Cohort All of Us Research Program
- PMID: 37585212
- PMCID: PMC10433138
- DOI: 10.1001/jamacardio.2023.2411
Representation of Race and Ethnicity in the Contemporary US Health Cohort All of Us Research Program
Erratum in
-
Corrected to Open Access Status.JAMA Cardiol. 2023 Dec 1;8(12):1189. doi: 10.1001/jamacardio.2023.3790. JAMA Cardiol. 2023. PMID: 37819649 Free PMC article. No abstract available.
Abstract
Importance: To address systemic disparities in biomedical research, the All of Us (AoU) Research Program was created to identify the root causes and consequences of health outcomes in the US. However, the extent of AoU's racial and ethnic diversity is unknown.
Objective: To quantify representation of key racial and ethnic groups in the accruing AoU nationwide health cohort and compare with their actual representation in the US.
Design, setting, and participants: This cohort study compared the AoU program from May 2017 to June 2022 for individuals 18 years and older with the Decennial Survey 2020 (DEC) collected by the US Census Bureau.
Exposures: Representation of non-Hispanic Asian, non-Hispanic Black or African American, Hispanic or Latino, non-Hispanic White, and uncategorized or multiple races in AoU.
Main outcomes and measures: The extent of underrepresentation or overrepresentation of each racial group in the AoU program at both nationwide and state-level relative to DEC.
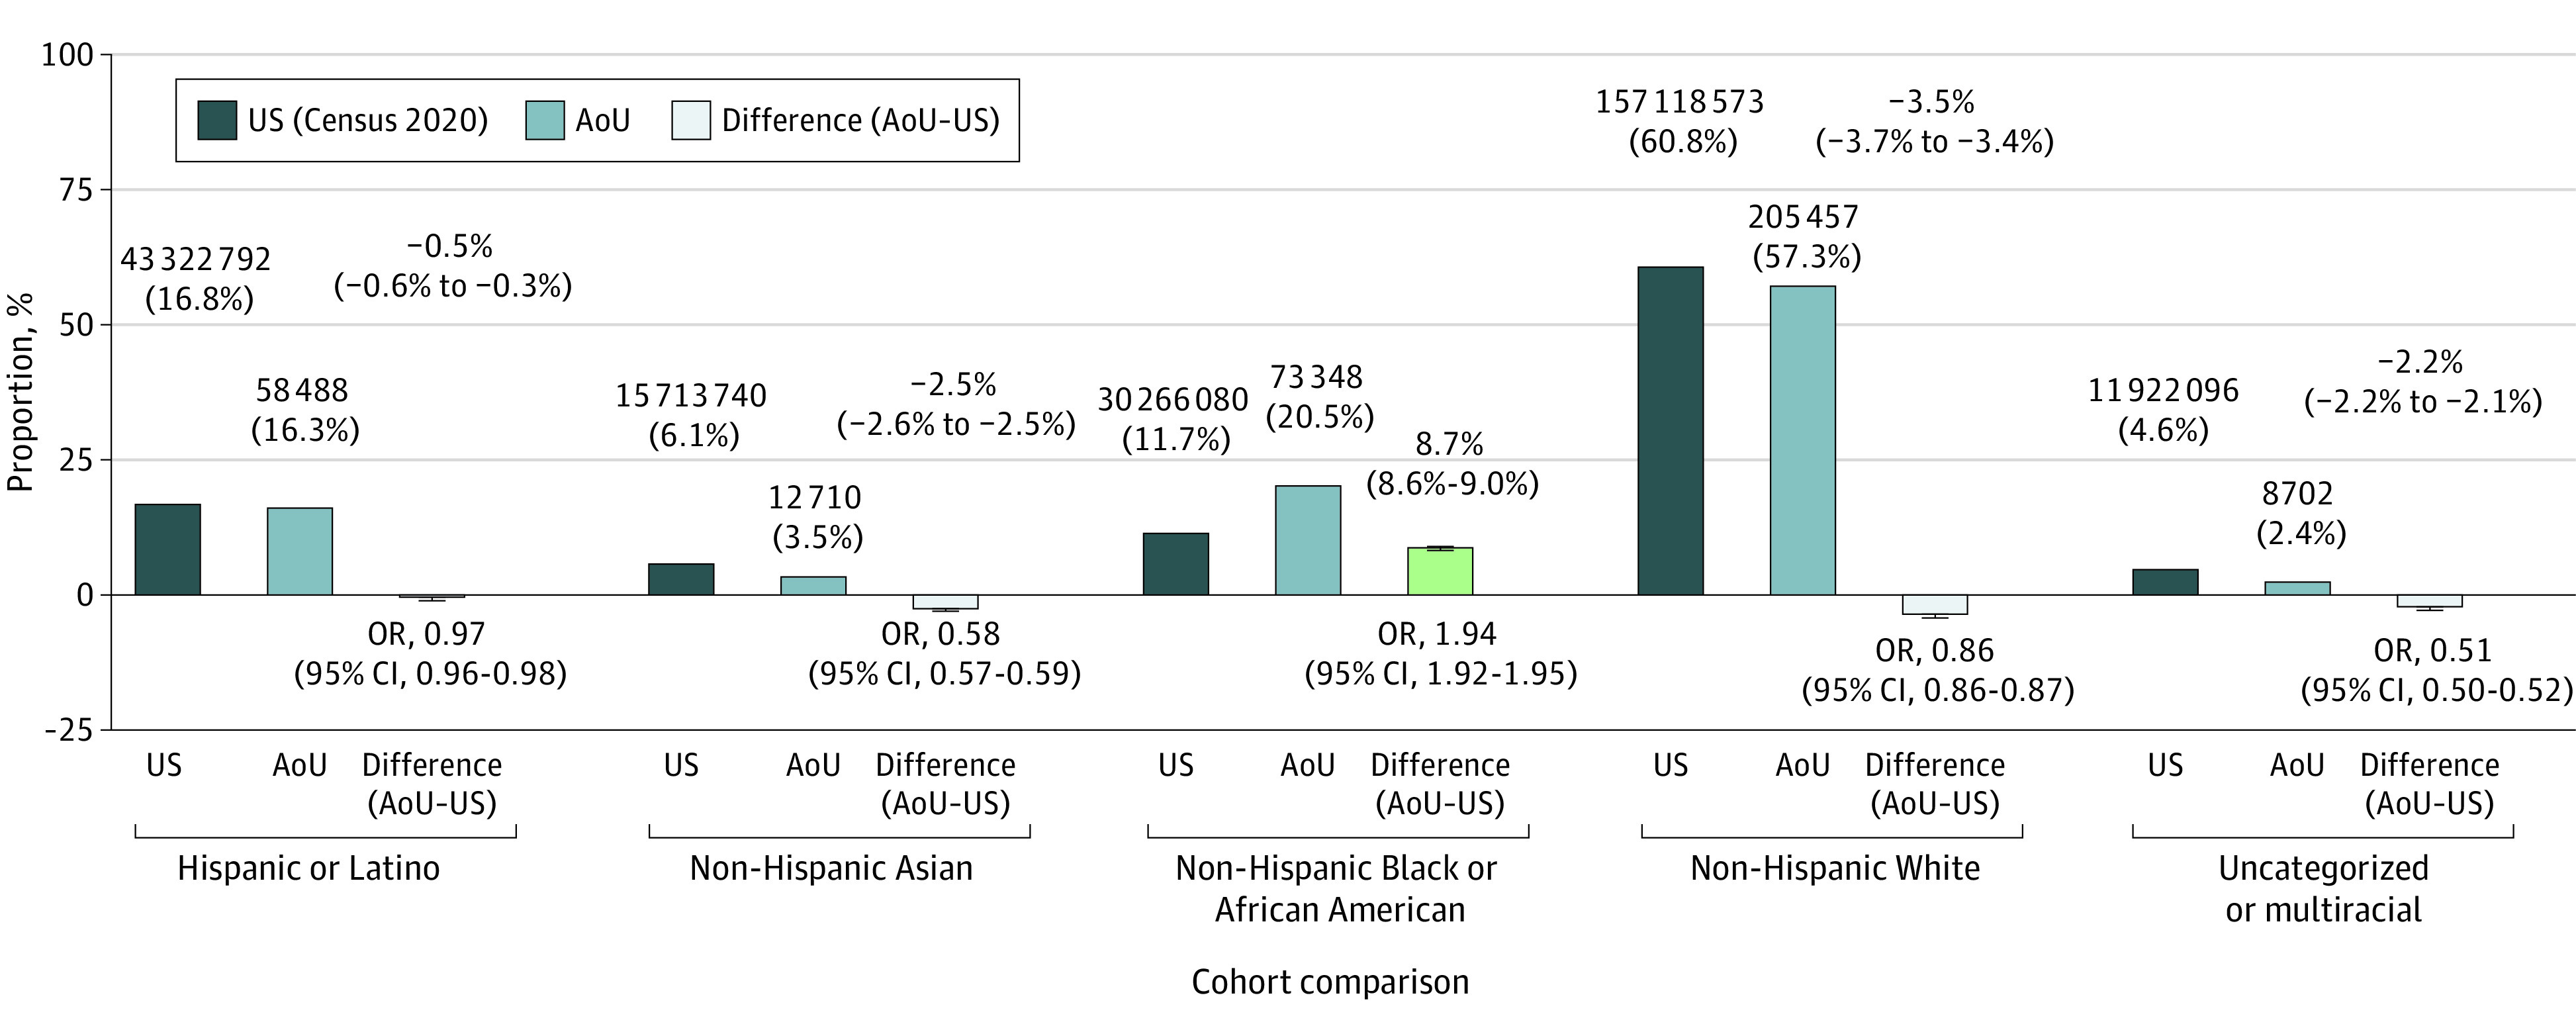
Results: Of the 358 705 US adults in the AoU to date, individuals identified with the following race and ethnicity categories: 12 710 non-Hispanic Asian (3.5%), 73 348 non-Hispanic Black or African American (20.5%), 58 488 Hispanic or Latino (16.3%), 205 457 non-Hispanic White (57.3%), and 8702 uncategorized or reporting multiple categories (2.4%). Of 355 413 participants with available sex at birth and age data, 218 981 (61.6%) were female and had a mean (SD) age of 53.1 (17.0) years, 136 037 (38.28%) were male and had a mean (SD) age of 56.7 (17.0) years, and 395 reported nonbinary sex (0.1%), with a mean (SD) age of 55.4 (15.8) years. Compared with the referent US, non-Hispanic Black or African American individuals were overrepresented in the AoU by 8.73% (AoU, 20.5% [73 348 of 358 705] vs DEC, 11.7% [30 266 080 of 258 343 281]) and by relative scale, 1.94-fold. Non-Hispanic White individuals accounted for the greatest participation in the AoU with generally consistent dominance across all regions yet numerically underrepresented by absolute difference of -3.54% (95% CI, -3.70 to -3.38). Uncategorized or multiracial group in the AoU (2.4% [8702 of 358 705]) was 0.43-fold likely to be represented relative to the DEC (4.6% [11 922 096 of 258 343 281]) with an absolute difference of -2.19% (95% CI, -2.24 to -2.14). Moreover, non-Hispanic Asian individuals were underrepresented by -2.54% (95% CI, -2.60 to -2.48) prominently in most states. Individuals identifying as Hispanic or Latino were nominally underrepresented by -0.46% (95% CI, -0.58 to -0.34) (AoU, 16.3% [58 488 of 358 705] vs DEC, 16.8% [43 322 792 of 258 343 281]).
Conclusions and relevance: Recruitment trends for the ongoing AoU show relatively improved representation of some major race groups with geographic trends. These findings underscore the need to further tailor and augment recruitment and participation initiatives for diverse populations.
Conflict of interest statement
Figures
References
-
- Institute of Medicine . Examining the Health Disparities Research Plan of the National Institutes of Health: Unfinished Business. The National Academic Press; 2006. - PubMed
Publication types
MeSH terms
Grants and funding
LinkOut - more resources
Full Text Sources
Research Materials