. 2023 Aug;131(8):87009.
doi: 10.1289/EHP10831. Epub 2023 Aug 16.

Extreme Temperature Exposure and Risks of Preterm Birth Subtypes Based on a Nationwide Survey in China

Affiliations

Extreme Temperature Exposure and Risks of Preterm Birth Subtypes Based on a Nationwide Survey in China

Guoqi Yu et al. Environ Health Perspect. 2023 Aug.

Abstract

Background: Previous studies have reported that ambient temperature may affect perinatal outcomes. However, whether extreme temperature affects the risk of preterm birth (PTB) remains controversial. Studies on the associations of extreme temperature with PTB subtypes are lacking.

Objectives: We aimed to investigate the associations of extreme climate events with the risks of PTB and its subtypes, discerning possible modifiers.

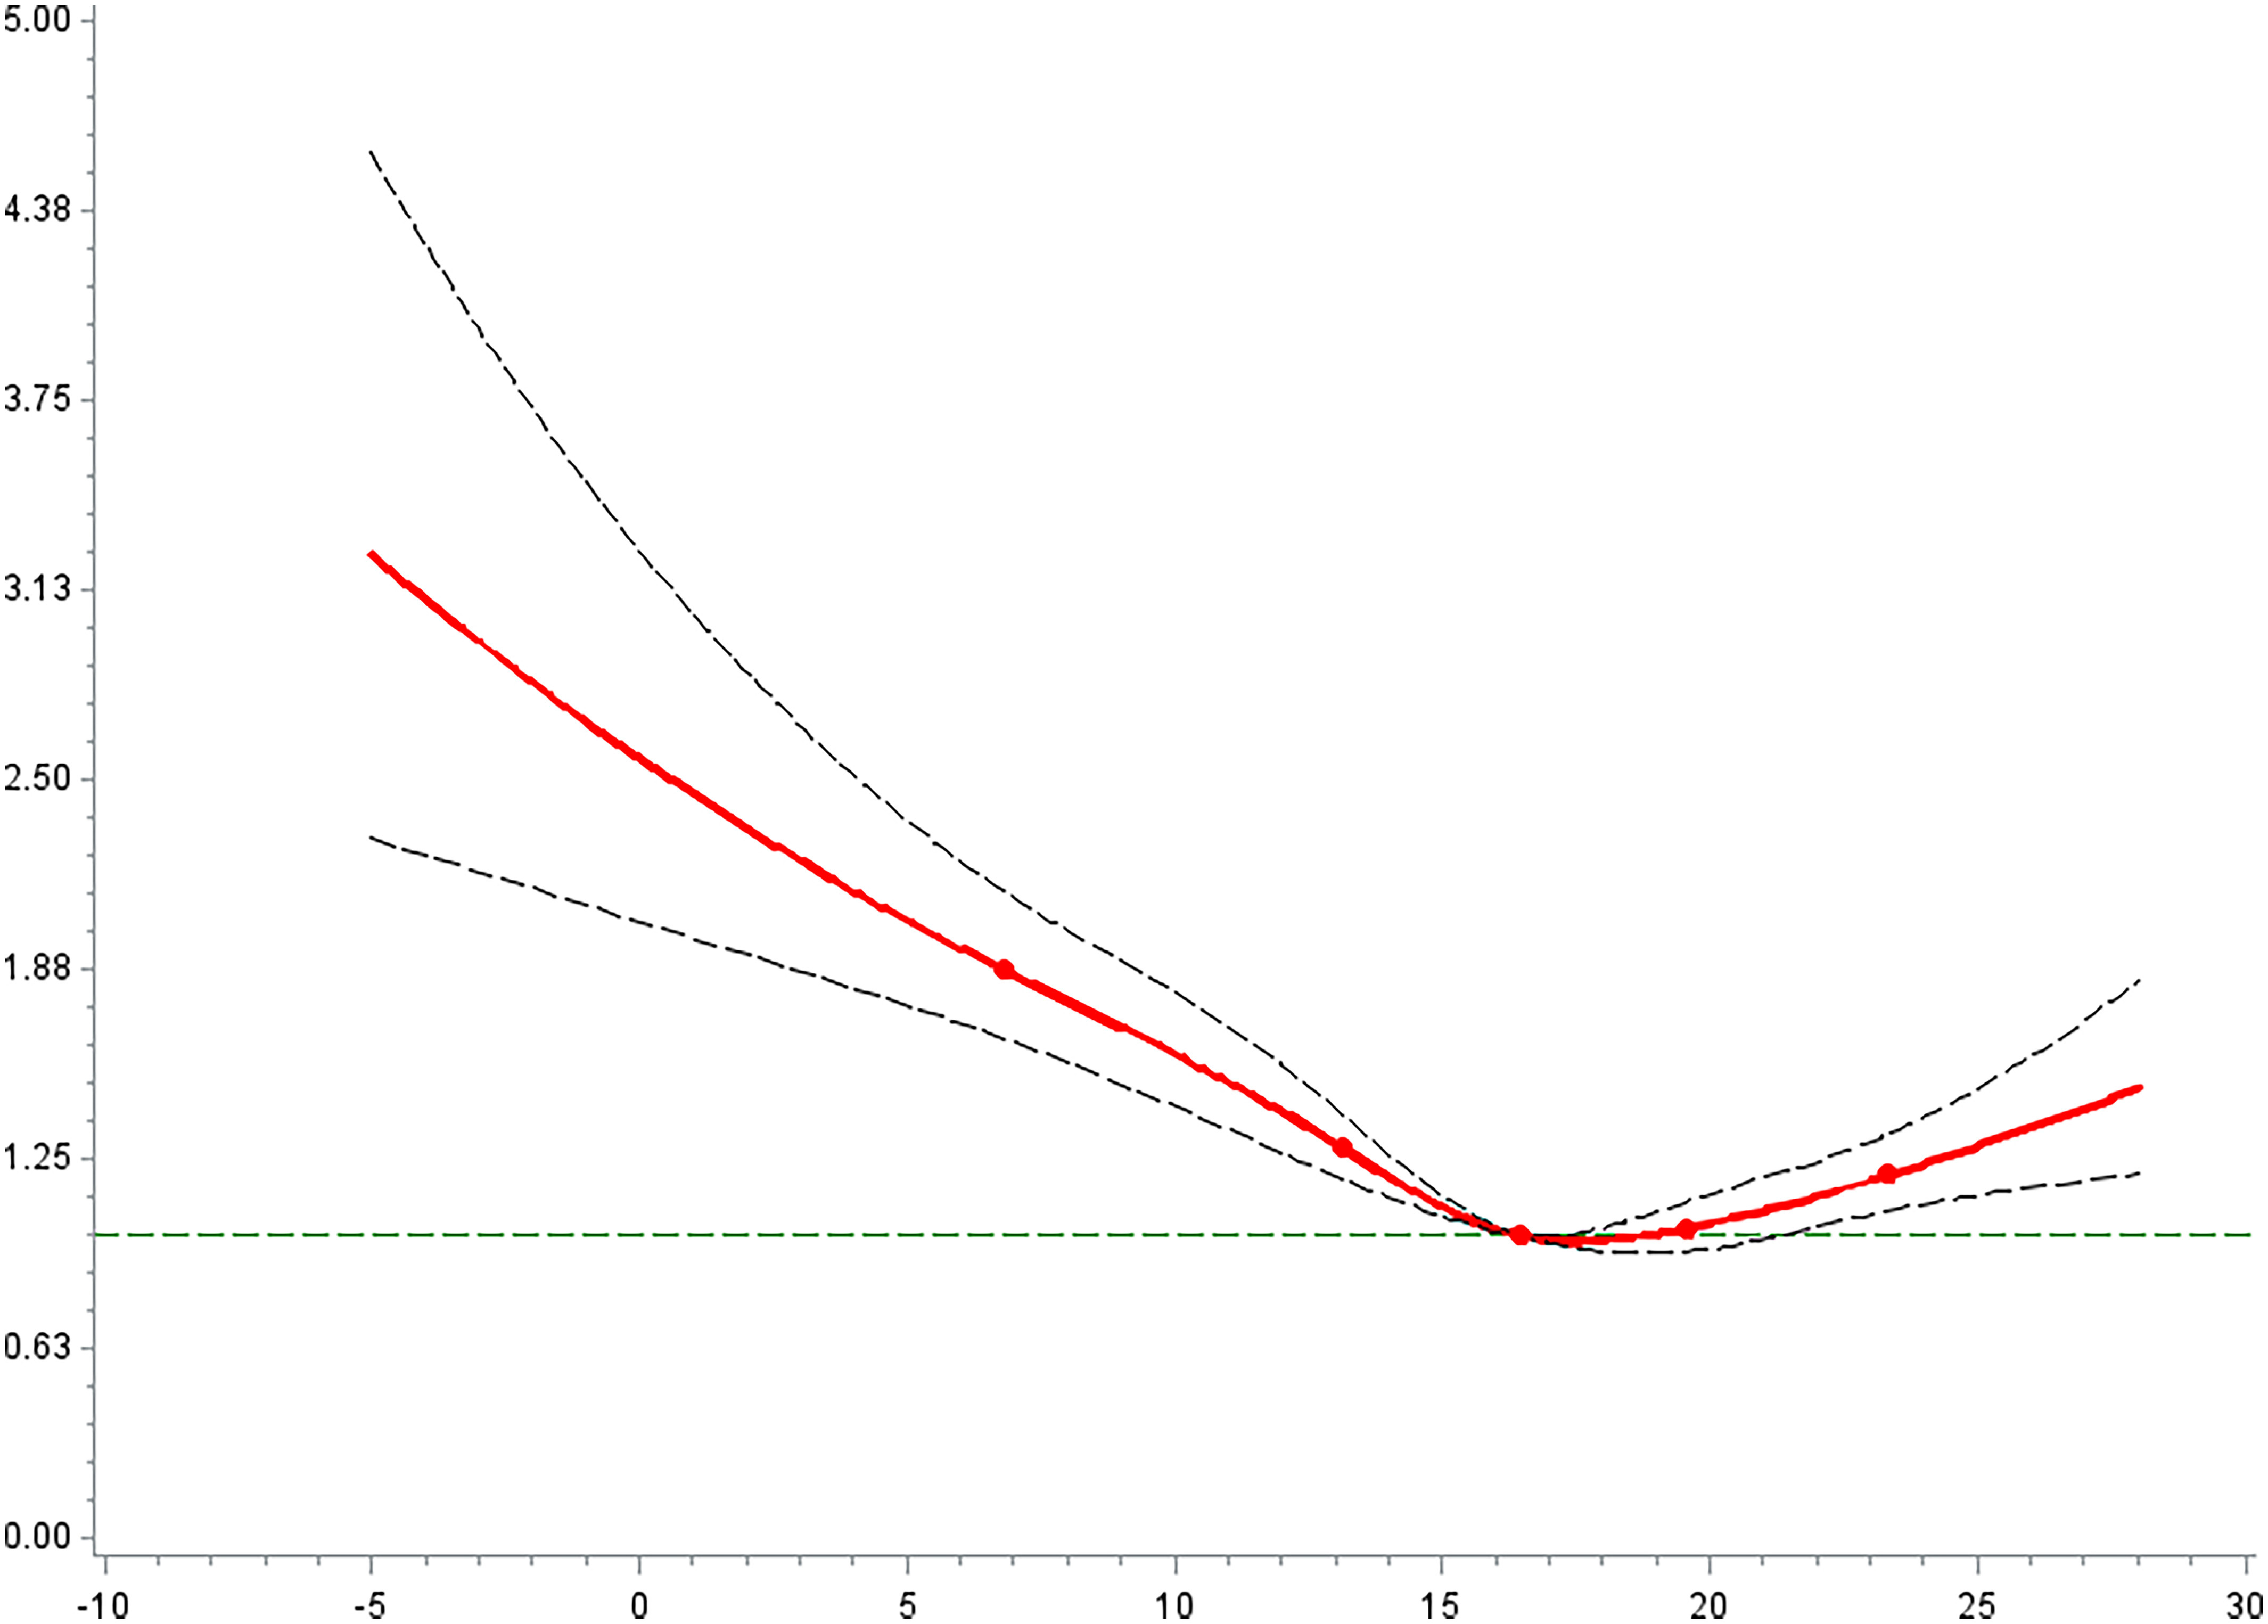
Methods: Data on all singleton deliveries were obtained from the China Labor and Delivery Survey (CLDS), a nationwide investigation implemented in 2015 and 2016. PTB was defined as gestational weeks <37 and then categorized as early (24-34 wk) and late PTBs (35-36 wk), and clinical subtypes [spontaneous PTB, preterm premature rupture of the fetal membranes (PPROM), iatrogenic PTB]. Ambient temperature data were provided by the China National Weather Data Sharing System. Five heat indexes and five cold indexes were used to define heat waves and cold spells. Generalized linear mixed models with a random term by hospital unit were used to assess the associations of short-term prenatal extreme temperature exposure. The Cox proportional hazard regression model was applied to assess the nonlinear associations of low- or high-temperature exposure at the whole and different trimesters of pregnancy with the risk of PTB. Stratified analyses were conducted to assess the possible modification by geographic region and fetal sex.

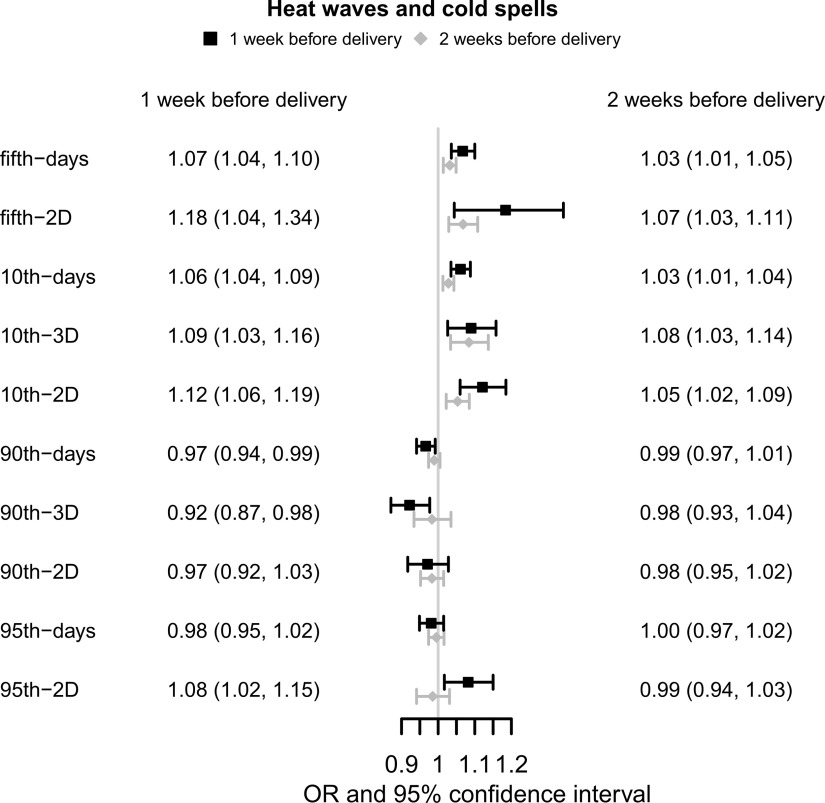
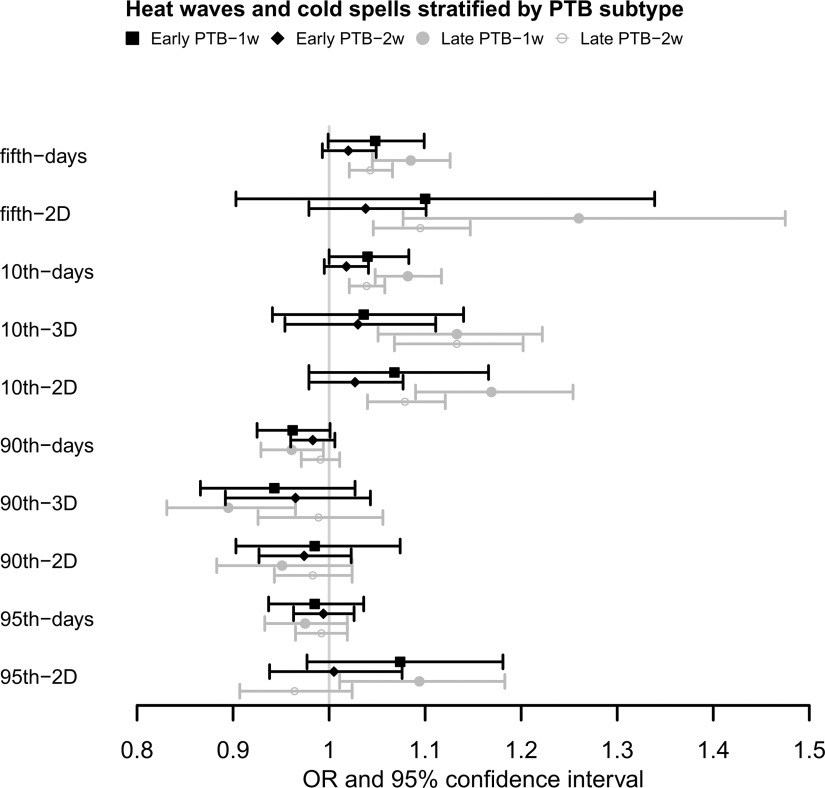
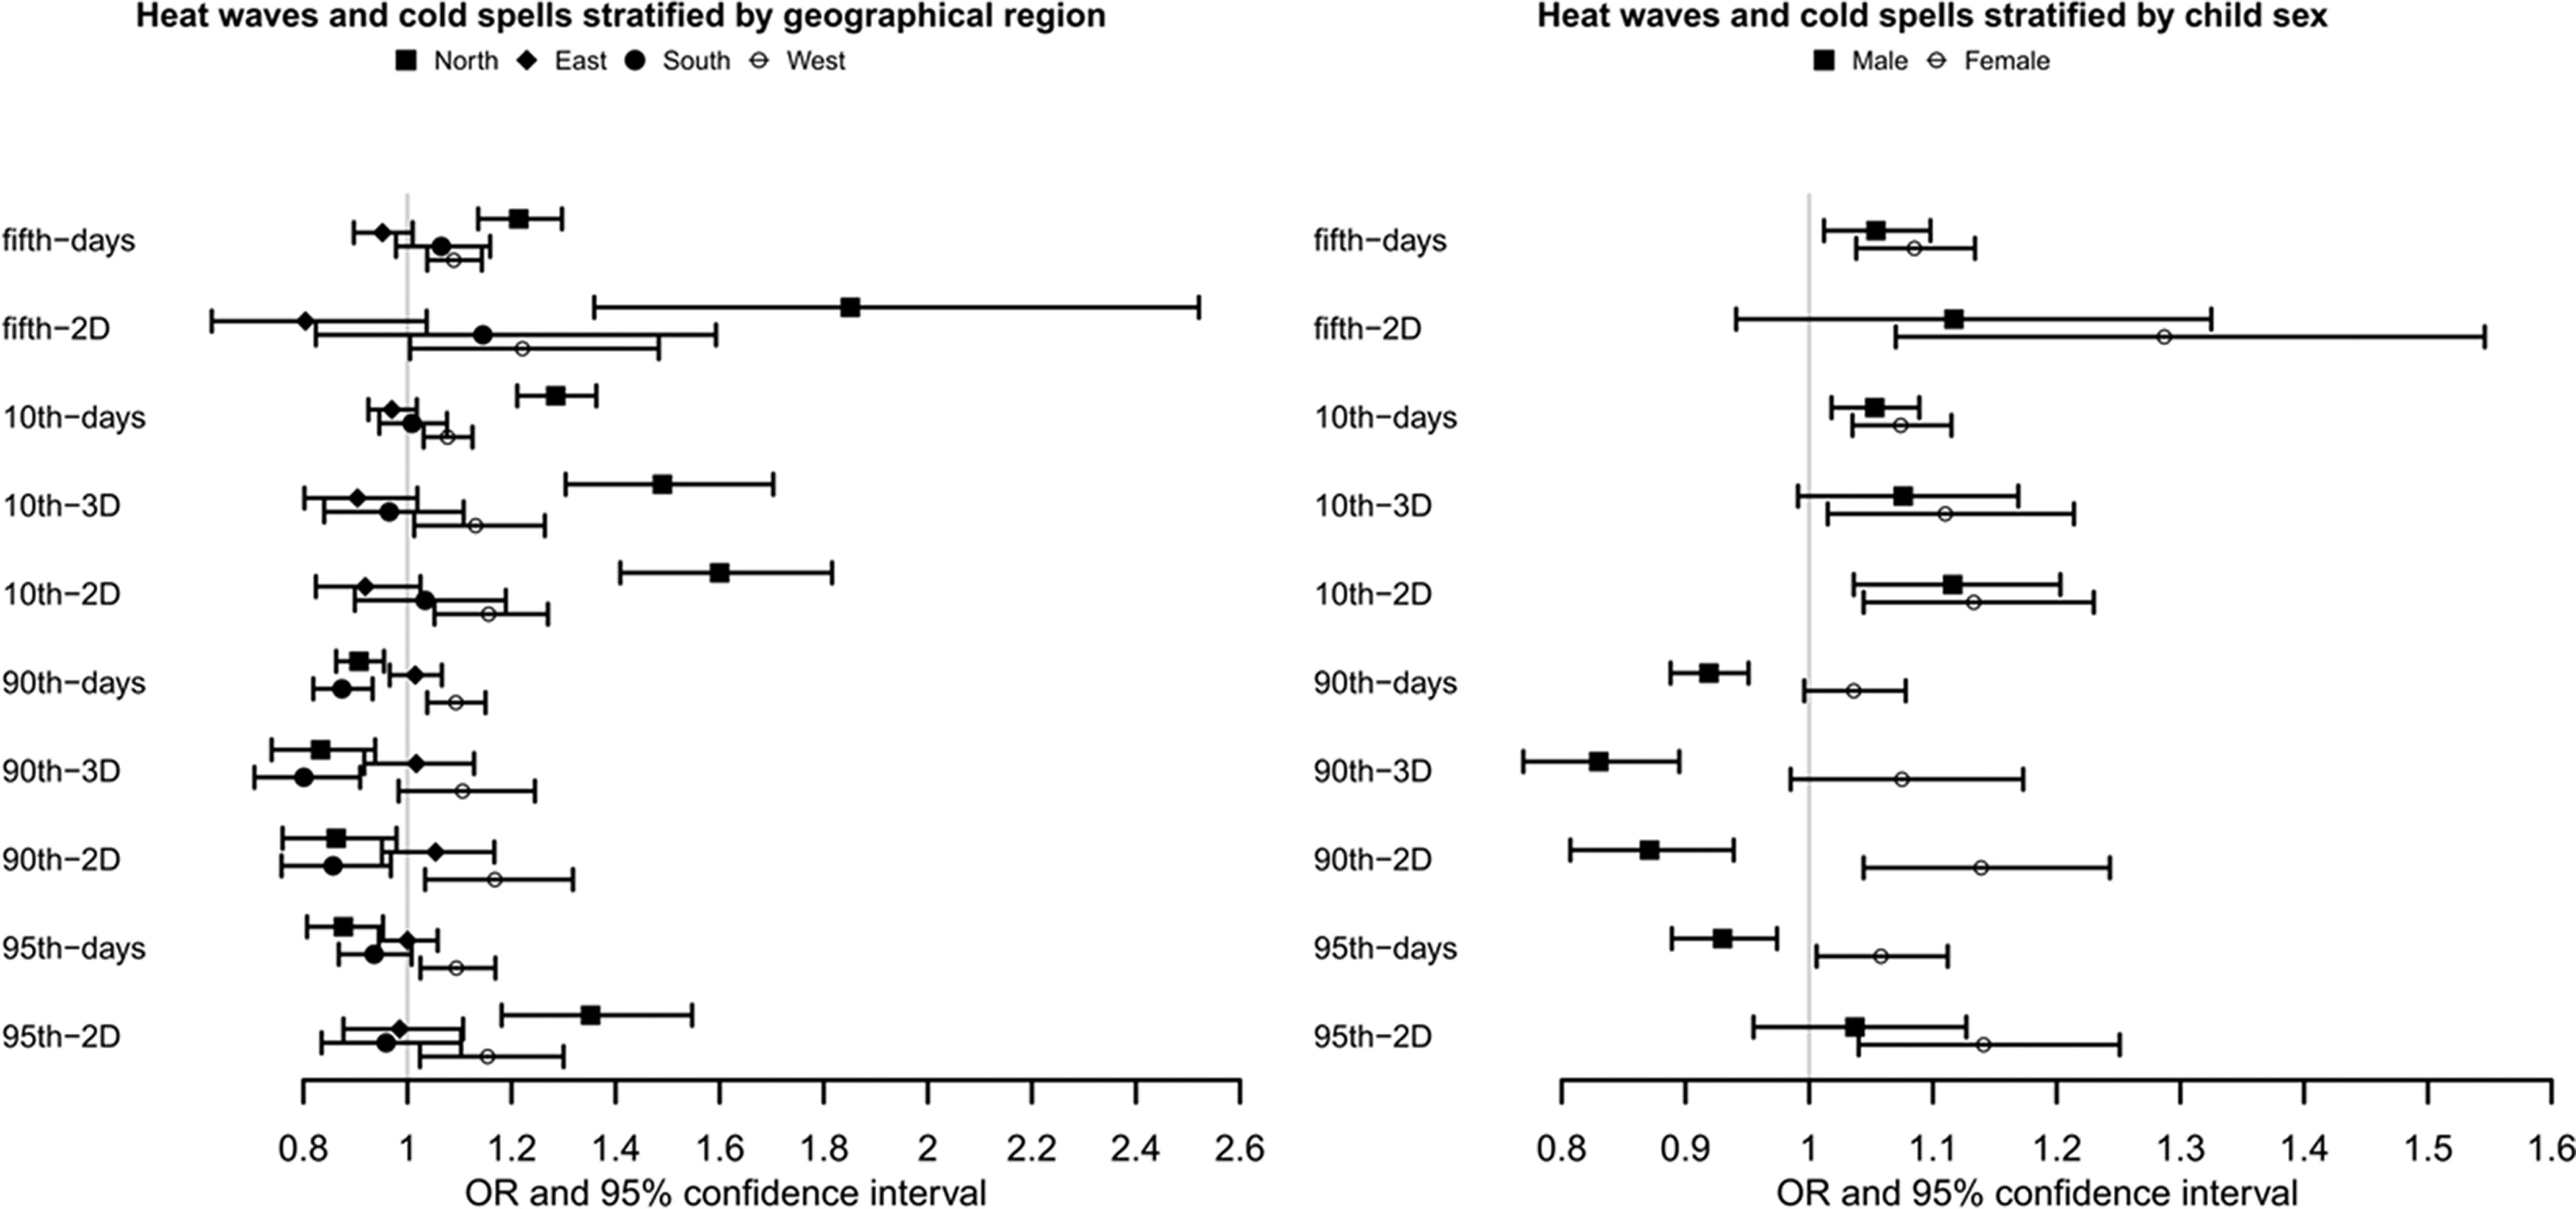
Results: A total of 70,818 singleton births from 96 hospitals in China were included, among which 4,965 (7.01%) were PTBs. Exposure to extreme cold events 1 wk before delivery was associated with an increased PTB risk, with an adjusted odds ratio (aOR) [95% confidence intervals (CIs)] of 1.07 (95% CI: 1.04, 1.10) and 1.06 (1.04, 1.09) for the total days when the daily average temperature below the fifth percentile (fifth-days) and the 10th percentile (10th-days), 1.18 (1.04, 1.34) for the cold spells when the daily average temperature below the fifth percentile for two consecutive days (fifth-2D), 1.09 (1.03, 1.16) and 1.12 (1.06, 1.19) for the cold spells when the daily average temperature below the 10th percentile for three and two consecutive days (10th-3D and 10th-2D), respectively. Results of extreme temperature exposure during 2 weeks before delivery showed similarly significant associations. The association between cold spells and PTB tended to be stronger for late PTB than for early PTB. Cold spells were mainly associated with spontaneous PTB and late PPROM. A stratified analysis indicated that pregnant women in western and northern regions tended to be more sensitive to cold spells, and pregnant women with a female fetus appeared to be at a higher risk of PTB when exposed to cold spells. Pregnant women in late pregnancy were more susceptible to extreme temperatures. No significant or stable association was found between heat waves and preterm birth.

Discussion: Exposure to cold spells was associated with an increased risk of PTB, especially late, spontaneous PTB and PPROM. The associations appeared to be more pronounced in the north and west regions and in pregnancies with female fetuses. https://doi.org/10.1289/EHP10831.


Figures

Figure 1 is a forest plot titled heat waves and cold spells, plotting (bottom to top) ninety-fifth to 2 days; ninety-fifth to days; ninetieth to 2 days; ninetieth to 3 days; ninetieth to days; tenth to 2 days; tenth to 3 days, tenth to days; fifth to 2 days; and fifth to days (y-axis) across odds ratio and 95 percent confidence interval, ranging from 0.9 to 1.2 in increments of 0.1 (x-axis) for 1 week before delivery and 2 weeks before delivery.
Figure 1.
Associations of extreme climate events with the preterm birth in China Labor and Delivery Survey (n=70,818). Note: Generalized linear mixed model was used to examine the associations. ORs represent a 1-unit increase in extreme weather events and are presented with a 95% CI. All models were adjusted for maternal age, maternal ethnicity, maternal education, insurance type, child sex, parity, GDP per capita, geographic region, conception season, conception year, PM2.5, and O3. CI, confidence interval; GDP, gross domestic product; OR, odds ratio; PM2.5, particulate matter with aerodynamic diameter 2.5μm.
Figure 2 is a forest plot titled heat waves and cold spells stratified by preterm birth subtype, plotting (bottom to top) ninety-fifth to 2 days; ninety-fifth to days; ninetieth to 2 days; ninetieth to 3 days; ninetieth to days; tenth to 2 days; tenth to 3 days, tenth to days; fifth to 2 days; and fifth to days (y-axis) across odds ratio and 95 percent confidence interval, ranging from 0.8 to 1.5 in increments of 0.1 (x-axis) for early preterm birth, to 1 week, early preterm birth to 2 weeks, late preterm birth to 1 week, and late preterm birth to 2 weeks.
Figure 2.
Associations of extreme climate events with the early and late preterm births in 1 and 2 wk before delivery in China Labor and Delivery Survey. (See Table S5 for corresponding numeric data). Note: Generalized linear mixed model was used to examine the associations. ORs represent a 1-unit increase in extreme weather events and are presented with a 95% CI. All models were adjusted for maternal age, maternal ethnicity, maternal education, insurance type, child sex, parity, GDP per capita, geographic region, conception season, conception year, PM2.5, and O3. CI, confidence interval; GDP, gross domestic product; OR, odds ratio; PM2.5, particulate matter with aerodynamic diameter 2.5μm.
Figure 3 is a set of two forest plots. On the left, the forest plot is titled heat waves and cold spells stratified by geographical region, plotting (bottom to top) ninety-fifth to 2 days; ninety-fifth to days; ninetieth to 2 days; ninetieth to 3 days; ninetieth to days; tenth to 2 days; tenth to 3 days, tenth to days; fifth to 2 days; and fifth to days (y-axis) across odds ratio and 95 percent confidence interval, ranging from 0.8 to 2.6 in increments of 0.2 (x-axis) for North, East South, and West. On the right, the forest plot is titled heat waves and cold spells stratified by child sex, plotting (bottom to top) ninety-fifth to 2 days; ninety-fifth to days; ninetieth to 2 days; ninetieth to 3 days; ninetieth to days; tenth to 2 days; tenth to 3 days, tenth to days; fifth to 2 days; and fifth to days (y-axis) across odds ratio and 95 percent confidence interval, ranging from 0.8 to 1.6 in in increments of 0.1 (x-axis) for male and female.
Figure 3.
Associations of extreme climate events with preterm births in 1 wk before delivery in China Labor and Delivery Survey, stratified by geographical region and child sex. (See Tables S7 and S8 for corresponding numeric data.) Note: Generalized linear mixed model was used to examine the associations. Numbers of cases/observations in each stratum were: North (1,104/19,927), East (1,520/23,640), South (1,040/13,192), and West (1,301/14,059) for the geographical region and male (2,863/37,826), and female (2,083/32,872) for child sex. ORs represent a 1-unit increase in extreme weather events and are presented with a 95% CI. All models were adjusted for maternal age, maternal ethnicity, maternal education, insurance type, parity, GDP per capita, geographic region, conception season/child sex, conception year, PM2.5, and O3. CI, confidence interval; GDP, gross domestic product; OR, odds ratio; PM2.5, particulate matter with aerodynamic diameter 2.5μm.
Figure 4 is a line graph, plotting whole pregnancy and the preterm birth risk, ranging from 0.00 to 0.63 in increments of 0.63; 0.3 to 1.25 in increments of 0.62; 1.25 to 1.88 in increments of 0.63; 1.88 to 2.50 in increments of 0.62; 2.50 to 3.13 in increments of 0.63; 3.13 to 3.75 in increments of 0.62; 3.75 to 4.38 in increments of 0.63; 4.38 to 5.00 in increments of 0.62 (y-axis) across average temperature, ranging from negative 10 to 30 in increments of 5 (x-axis).
Figure 4.
The relationship between the average temperature exposed during the whole pregnancy and the preterm birth risk in China Labor and Delivery Survey (n=70,818). (See Tables S9 for corresponding numeric data.) Note: Cox proportional hazard regression incorporated with penalized cubic spline was used to examine exposure-response associations. HRs represent a 1-unit increase in extreme weather events and are presented with a 95% CI. All models were adjusted for maternal age, maternal ethnicity, maternal education, insurance type, child sex, parity, GDP per capita, geographic region, conception season, conception year, PM2.5, and O3. CI, confidence interval; GDO, gross domestic product; HR, hazard ratio; PM2.5, particulate matter with aerodynamic diameter 2.5μm.

References

    1. Crump C. 2020. Preterm birth and mortality in adulthood: a systematic review. J Perinatol 40(6):833–843, PMID: , 10.1038/s41372-019-0563-y. - DOI - PMC - PubMed
    1. Urs R, Kotecha S, Hall GL, Simpson SJ. 2018. Persistent and progressive long-term lung disease in survivors of preterm birth. Paediatr Respir Rev 28:87–94, PMID: , 10.1016/j.prrv.2018.04.001. - DOI - PubMed
    1. Luu TM, Rehman Mian MO, Nuyt AM. 2017. Long-Term impact of preterm birth: neurodevelopmental and physical health outcomes. Clin Perinatol 44(2):305–314, PMID: , 10.1016/j.clp.2017.01.003. - DOI - PubMed
    1. Chawanpaiboon S, Vogel JP, Moller A-B, Lumbiganon P, Petzold M, Hogan D, et al. 2019. Global, regional, and national estimates of levels of preterm birth in 2014: a systematic review and modelling analysis. Lancet Glob Health 7(1):e37–e46, PMID: , 10.1016/S2214-109X(18)30451-0. - DOI - PMC - PubMed
    1. Phillips C, Velji Z, Hanly C, Metcalfe A. 2017. Risk of recurrent spontaneous preterm birth: a systematic review and meta-analysis. BMJ Open 7(6):e015402, PMID: , 10.1136/bmjopen-2016-015402. - DOI - PMC - PubMed

Publication types

LinkOut - more resources