. 2023 Aug 22;120(34):e2215095120.
doi: 10.1073/pnas.2215095120. Epub 2023 Aug 16.

A TGF-β/KLF10 signaling axis regulates atrophy-associated genes to induce muscle wasting in pancreatic cancer

Affiliations

A TGF-β/KLF10 signaling axis regulates atrophy-associated genes to induce muscle wasting in pancreatic cancer

Aneesha Dasgupta et al. Proc Natl Acad Sci U S A. .

Abstract

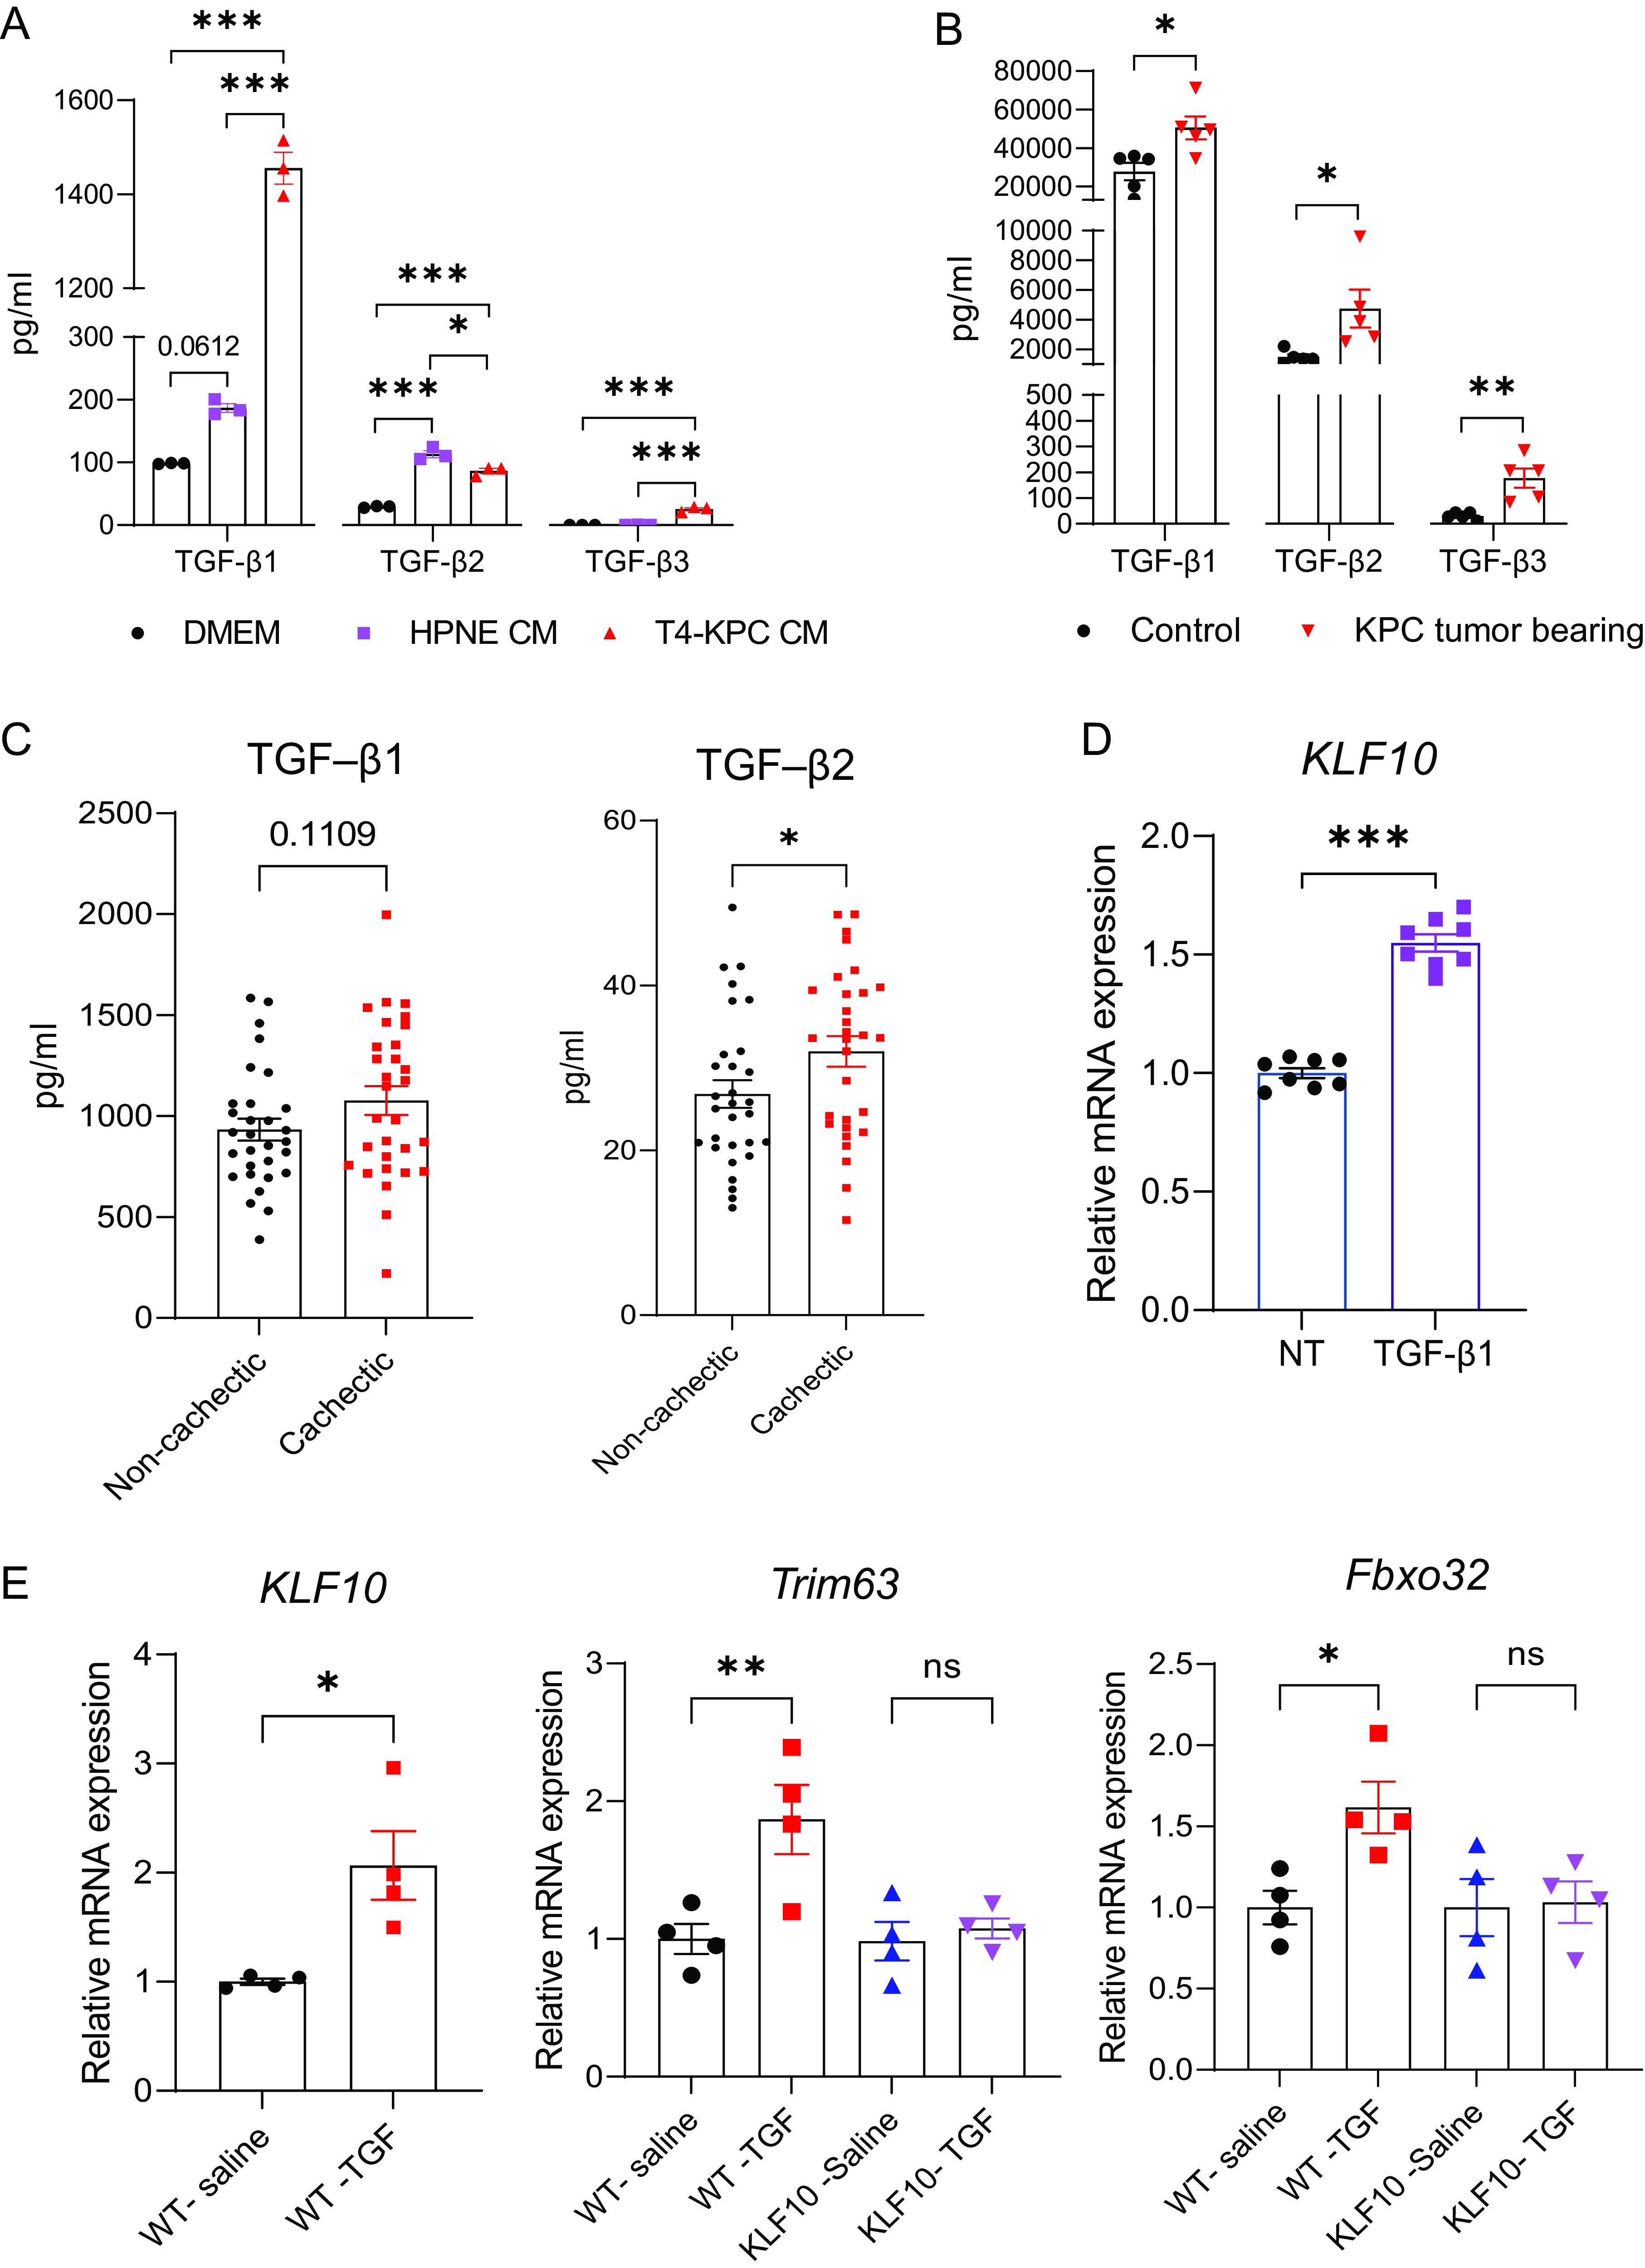
Cancer cachexia, and its associated complications, represent a large and currently untreatable roadblock to effective cancer management. Many potential therapies have been proposed and tested-including appetite stimulants, targeted cytokine blockers, and nutritional supplementation-yet highly effective therapies are lacking. Innovative approaches to treating cancer cachexia are needed. Members of the Kruppel-like factor (KLF) family play wide-ranging and important roles in the development, maintenance, and metabolism of skeletal muscle. Within the KLF family, we identified KLF10 upregulation in a multitude of wasting contexts-including in pancreatic, lung, and colon cancer mouse models as well as in human patients. We subsequently interrogated loss-of-function of KLF10 as a potential strategy to mitigate cancer associated muscle wasting. In vivo studies leveraging orthotopic implantation of pancreas cancer cells into wild-type and KLF10 KO mice revealed significant preservation of lean mass and robust suppression of pro-atrophy muscle-specific ubiquitin ligases Trim63 and Fbxo32, as well as other factors implicated in atrophy, calcium signaling, and autophagy. Bioinformatics analyses identified Transforming growth factor beta (TGF-β), a known inducer of KLF10 and cachexia promoting factor, as a key upstream regulator of KLF10. We provide direct in vivo evidence that KLF10 KO mice are resistant to the atrophic effects of TGF-β. ChIP-based binding studies demonstrated direct binding to Trim63, a known wasting-associated atrogene. Taken together, we report a critical role for the TGF-β/KLF10 axis in the etiology of pancreatic cancer-associated muscle wasting and highlight the utility of targeting KLF10 as a strategy to prevent muscle wasting and limit cancer-associated cachexia.

Keywords: KLF10; TGF-β; cachexia; muscle wasting; pancreatic cancer.


Conflict of interest statement

The authors declare no competing interest.

Figures

Fig. 1.
Fig. 1.
KLF10 is up-regulated and associated with cancer cachexia. (A) Visual representation of reported roles of selected KLF family members in skeletal muscle. (B) Expression levels of KLF family members in muscles from pancreatic cancer tumor–bearing mice. n = 5 control, 7 tumor-bearing. (C) KLF10 expression levels between control and cachectic groups in four publicly available KPC and LLC muscle RNA-sequencing data sets. Set 1 – n = 5 each; Set 2 – n = 4 each; Set 3 – n = 5 control, 8 tumor-bearing; Set 4 – n = 3 control, 4 tumor-bearing. (GSE107470, PRJNA604626, PRJNA773714, and GSE123310) (D) Gene expression levels of identified KLF family members in a human muscle PDAC RNA-seq set. n = 11 control, 23 cachectic. (GSE133979) (E) Schematic and representative images of the treatment regimen for in vitro assessment of atrophy upon CM exposure. (Scale bar, 100 µm.) (F) Atrophy-related transcripts assessed by qRT-PCR of the myotubes shown in E. n = 6 each. Data shown are mean ± SEM and is compared using two-way ANOVA (B) with Bonferroni’s post hoc correction, Student’s unpaired t tests (C, D, and F). ns = nonsignificant, *P < 0.05; **P < 0.01; ***P < 0.001.
Fig. 2.
Fig. 2.
KLF10 loss-of-function prevents muscle/myotube atrophy in vitro and in vivo. (A) Schematic detailing the tumor implantation procedure. (B) qRT-PCR confirming loss of KLF10 expression in KLF10(−/−) (KO) mice. n = 3 WT, 4 KO. (C) Tumor volume over the course of the study. (D) Changes in bodyweight, (E) lean mass, and (F) fat mass in tumor-bearing mice with respect to baseline measurements. (G) Quantification of atrophy-associated ubiquitin ligase Fbxo32 and Trim63 gene expression in the gastrocnemius muscle tissue of KO and WT mice at experimental end point. n = 3 WT, n = 4 KO. (H) Representative laminin immunostaining images to visualize muscle myofibers from KLF10 WT and KO mice at experimental end point. (Scale bar, 100 µm.) (I) Quantification of cross-sectional area and minimum feret diameter of muscle cross-sections from WT and KO mice. n = 3 WT/KO Control, n = 4 WT KPC, n = 3 KO KPC, n = 4 and n = 3 KO KPC mice for each group. (J) Representative images of WT and KO satellite cells treated with T4-KPC conditioned media for 48 h after differentiation. (Scale bar, 100 µm.) (K) Quantification of change in myotube widths in WT and KO with respect to control samples. n = 3 mice with six wells quantified each for each group, individual dots represent an individual myotube. (L) A heatmap of the expression of KLF10 and Ubiquitin ligases Fbxo32 and Trim63 in differentiated satellite cells upon treatment with conditioned media. Data shown are mean ± SEM and are compared using an unpaired t test (B, G, and K), Two-way ANOVA (CF) with Bonferroni’s Post hoc correction and comparison of best-fit values for gaussian nonlinear regression (I). ns = nonsignificant, *P < 0.05; **P < 0.01; ***P < 0.001.
Fig. 3.
Fig. 3.
RNA-sequencing analysis of skeletal muscle reveals distinct gene expression profiles in tumor-bearing KLF10 KO mice. (A) A principal component analysis (PCA) plot comparing tumor-bearing WT and KO mouse muscle. (B) A heatmap depicting differential expression of atrophy-related genes between KLF10 KO and WT tumor-bearing mice (C) A heatmap of DEGs between KLF10 KO and WT tumor-bearing mice. (D) A volcano plot highlighting selected DEGs between KLF10 WT and KLF10 KO cohorts. Green/left = significantly down in KLF10 KO; Blue/right = significantly up in KLF10 KO. (E) A network map highlighting TGF-β as a central regulator of many KLF10 KO DEGs. DEGs were shortlisted based on the threshold of log change = 1 and P value < 0.05.
Fig. 4.
Fig. 4.
KLF10 KO mice are resistant to the atrophic effect of TGF-β. (A) TGF-β protein levels in control media or conditioned media derived from T4-KPC cancer cells or HPNE control cells. n = 3 for each group. (B) Levels of TGF-β proteins in T4 KPC tumor-bearing mice n = 5 for each group. (C) TGF-β family protein levels in human cachectic patients n = 29 cachectic, 30 control. (D) KLF10 expression in C2C12 cells treated with TGF-β1 for 24 h. n = 8 for each group. (E) Gene expression quantification of KLF10, Trim63, and Fbxo32, in mice injected with TGF-β and saline. n = 4 for each group. Data shown are Mean ± SEM and are compared using one-way ANOVA (A) with Bonferroni’s post hoc correction, Student’s unpaired t test (BE). ns = nonsignificant, *P < 0.05; **P < 0.01; ***P < 0.001.
Fig. 5.
Fig. 5.
ChIP analysis reveals potential targets of KLF10 (A) Integrated Genome Viewer (IGV) viewer tracks of Klf9, Klf15, Foxo1, and Foxo3 demonstrating KLF binding in human cancer cell sets. (B) Treatment schematic of cells undergoing ChIP-qPCR for a selected group of genes (C) Bar plot demonstrating enrichment of each primer set based on treatment with either T4 conditioned media or HPNE conditioned media. N = 4 replicates for each group. Data shown are Mean ± SEM and are compared using Student’s unpaired t test (C). ns = nonsignificant, ***P < 0.001.
Fig. 6.
Fig. 6.
Genetic inhibition of KLF10 prevents skeletal muscle loss associated with pancreatic cancer cachexia. (A) Schematic illustration of the experimental plan. Survival analysis (B), relative lean mass (C), postnecropsy tumor weight (D), Gastrocnemius weight (E), TA weight (F) and heart weight (G) of Control AAV9 (n = 7) and shKLF10 AAV9 (n = 7) injected mice. Relative mRNA expression of KLF10 (H), Trim63 (I) and FbxO32 in the gastrocnemius muscles of Control AAV9 (n = 5) and shKLF10 AAV9 (n = 5) injected mice. (J) Representative images of laminin-stained muscle sections of Control AAV9 and shKLF10 AAV9 at 20× magnification. (Scale bar, 100 µm.) (KL) Minimum feret diameter and cross-sectional area measurements of cross-sections of Control AAV9 and shKLF10 AAV9 TA muscle. (M) Myofiber type quantification of both experimental cohorts. Data shown are mean ± SEM and are compared using Log-rank (Mantel-Cox) survival analysis (B), Student’s unpaired t test (DI), comparison of best-fit values for gaussian nonlinear regression (K and L), Two-way ANOVA with Bonferroni’s correction (C and M). ns = nonsignificant, *P < 0.05; **P < 0.01; ***P < 0.001.

References

    1. Dewys W. D., et al. , Prognostic effect of weight loss prior to chemotherapy in cancer patients. Eastern Cooperative Oncology Group. Am. J. Med. 69, 491–497 (1980). - PubMed
    1. Bachmann J., et al. , Cachexia worsens prognosis in patients with resectable pancreatic cancer. J. Gastrointest. Surg. 12, 1193–1201 (2008). - PubMed
    1. Baracos V. E., Martin L., Korc M., Guttridge D. C., Fearon K. C. H., Cancer-associated cachexia. Nat. Rev. Dis. Primers 4, 17105 (2018). - PubMed
    1. Greco S. H., et al. , TGF-beta blockade reduces mortality and metabolic changes in a validated murine model of pancreatic cancer cachexia. PLoS One 10, e0132786 (2015). - PMC - PubMed
    1. Chen J. L., et al. , Specific targeting of TGF-beta family ligands demonstrates distinct roles in the regulation of muscle mass in health and disease. Proc. Natl. Acad. Sci. U.S.A. 114, E5266–E5275 (2017). - PMC - PubMed

Publication types

MeSH terms

Substances