

Interplay of demographics, geography and COVID-19 pandemic responses in the Puget Sound region: The Vashon, Washington Medical Reserve Corps experience
- PMID: 37585489
- PMCID: PMC10431654
- DOI: 10.1371/journal.pone.0274345
Interplay of demographics, geography and COVID-19 pandemic responses in the Puget Sound region: The Vashon, Washington Medical Reserve Corps experience
Abstract
Background: Rural U.S. communities are at risk from COVID-19 due to advanced age and limited access to acute care. Recognizing this, the Vashon Medical Reserve Corps (VMRC) in King County, Washington, implemented an all-volunteer, community-based COVID-19 response program. This program integrated public engagement, SARS-CoV-2 testing, contact tracing, vaccination, and material community support, and was associated with the lowest cumulative COVID-19 case rate in King County. This study aimed to investigate the contributions of demographics, geography and public health interventions to Vashon's low COVID-19 rates.
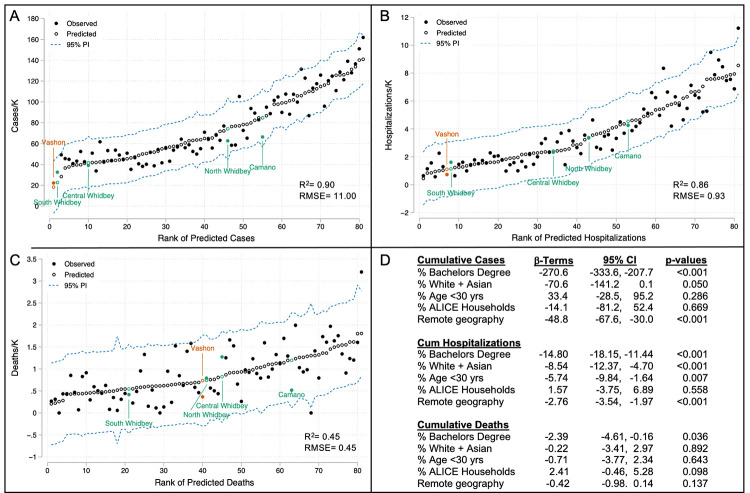
Methods: This observational cross-sectional study compares cumulative COVID-19 rates and success of public health interventions from February 2020 through November 2021 for Vashon Island with King County (including metropolitan Seattle) and Whidbey Island, located ~50 km north of Vashon. To evaluate the role of demography, we developed multiple linear regression models of COVID-19 rates using metrics of age, race/ethnicity, wealth and educational attainment across 77 King County zip codes. To investigate the role of remote geography we expanded the regression models to include North, Central and South Whidbey, similarly remote island communities with varying demographic features. To evaluate the effectiveness of VMRC's community-based public health measures, we directly compared Vashon's success of vaccination and contact tracing with that of King County and South Whidbey, the Whidbey community most similar to Vashon.
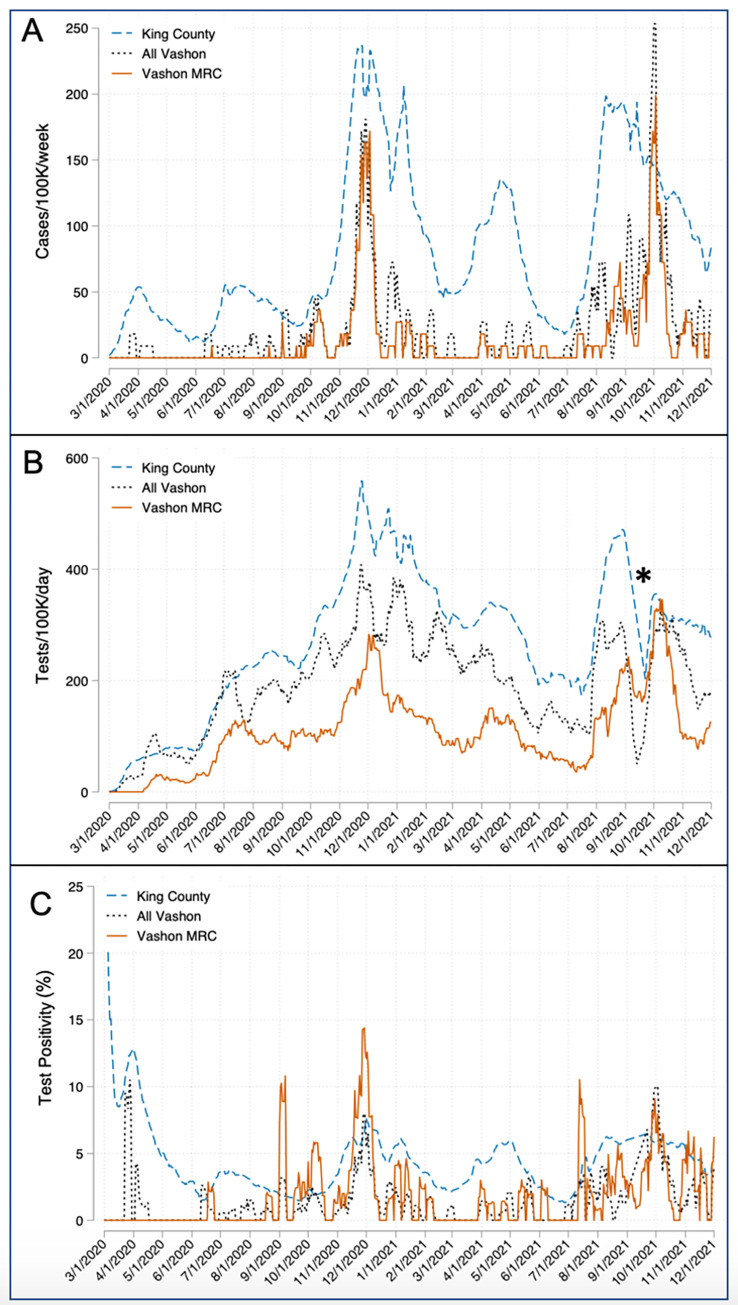
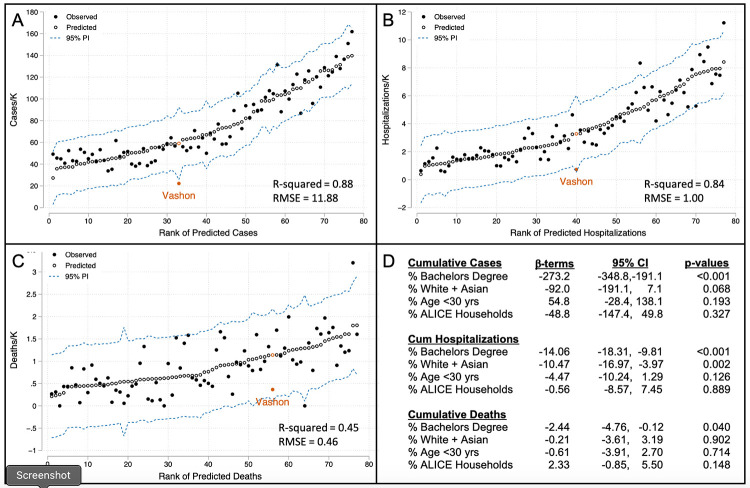
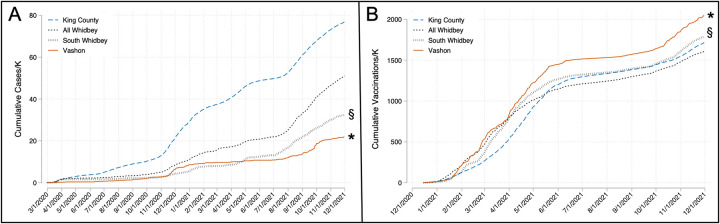
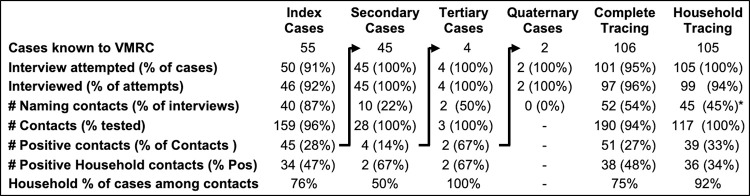
Results: Vashon's cumulative COVID-19 case rate was 29% that of King County overall (22.2 vs 76.8 cases/K). A multiple linear regression model based on King County demographics found educational attainment to be a major correlate of COVID-19 rates, and Vashon's cumulative case rate was just 38% of predicted (p < .05), so demographics alone do not explain Vashon's low COVID-19 case rate. Inclusion of Whidbey communities in the model identified a major effect of remote geography (-49 cases/K, p < .001), such that observed COVID-19 rates for all remote communities fell within the model's 95% prediction interval. VMRC's vaccination effort was highly effective, reaching a vaccination rate of 1500 doses/K four months before South Whidbey and King County and maintaining a cumulative vaccination rate 200 doses/K higher throughout the latter half of 2021 (p < .001). Including vaccination rates in the model reduced the effect of remote geography to -41 cases/K (p < .001). VMRC case investigation was also highly effective, interviewing 96% of referred cases in an average of 1.7 days compared with 69% in 3.7 days for Washington Department of Health investigating South Whidbey cases and 80% in 3.4 days for Public Health-Seattle & King County (both p<0.001). VMRC's public health interventions were associated with a 30% lower case rate (p<0.001) and 55% lower hospitalization rate (p = 0.056) than South Whidbey.
Conclusions: While the overall magnitude of the pre-Omicron COVID-19 pandemic in rural and urban U.S. communities was similar, we show that island communities in the Puget Sound region were substantially protected from COVID-19 by their geography. We further show that a volunteer community-based COVID-19 response program was highly effective in the Vashon community, augmenting the protective effect of geography. We suggest that Medical Reserve Corps should be an important element of future pandemic planning.
Copyright: This is an open access article, free of all copyright, and may be freely reproduced, distributed, transmitted, modified, built upon, or otherwise used by anyone for any lawful purpose. The work is made available under the Creative Commons CC0 public domain dedication.
Conflict of interest statement
The authors have declared that no competing interests exist.
Figures
References
-
- Dobis EA and McGranahan D. Rural residents appear to be more vulnerable to serious infection or death from Coronavirus COVID-19. USDA Economic Research Service, Feb 1, 2001. Available from: https://www.ers.usda.gov/amber-waves/2021/february/rural-residents-appea....
-
- Holloway B, Edited by Mazer-Field J. Vashon Island: the place where many parents skip jabs. BBC News, April 11, 2017. Available from: https://www.bbc.com/news/av/health-39558607.
Publication types
MeSH terms
LinkOut - more resources
Full Text Sources
Medical
Miscellaneous
