. 2023 Aug 18;9(33):eadh0558.
doi: 10.1126/sciadv.adh0558. Epub 2023 Aug 16.

Cross-species analysis identifies mitochondrial dysregulation as a functional consequence of the schizophrenia-associated 3q29 deletion

Affiliations

Cross-species analysis identifies mitochondrial dysregulation as a functional consequence of the schizophrenia-associated 3q29 deletion

Ryan H Purcell et al. Sci Adv. .

Abstract

The 1.6-megabase deletion at chromosome 3q29 (3q29Del) is the strongest identified genetic risk factor for schizophrenia, but the effects of this variant on neurodevelopment are not well understood. We interrogated the developing neural transcriptome in two experimental model systems with complementary advantages: isogenic human cortical organoids and isocortex from the 3q29Del mouse model. We profiled transcriptomes from isogenic cortical organoids that were aged for 2 and 12 months, as well as perinatal mouse isocortex, all at single-cell resolution. Systematic pathway analysis implicated dysregulation of mitochondrial function and energy metabolism. These molecular signatures were supported by analysis of oxidative phosphorylation protein complex expression in mouse brain and assays of mitochondrial function in engineered cell lines, which revealed a lack of metabolic flexibility and a contribution of the 3q29 gene PAK2. Together, these data indicate that metabolic disruption is associated with 3q29Del and is conserved across species.


Figures
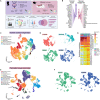
Fig. 1.
Fig. 1.. Cross-species single-cell sequencing.
(A) A scRNA-seq experiment was performed in isogenic human iPSC-derived cortical organoids at two time points and in P7 mouse isocortex. An overview of the strategy to collect and filter differential gene expression data from both model systems is illustrated. (B) The human 3q29Del locus is nearly perfectly syntenic with a region of mouse chromosome 16, with the same gene order inverted. Corresponding loci are illustrated in the same orientation to facilitate clearer cross-species comparison. Bex6 (in gray) is the only gene present in the mouse, but not in the human locus. (C and E) Uniform manifold approximation and projection (UMAP) for dimensionality reduction, colored by the main cell types identified in human (C) and mouse (E) experiments. Human and mouse cells showed no obvious difference in gross distribution by genotype, (D and F) but human cells were clearly divided in their transcriptomic clustering patterns by time point (D) (top). The average expression profile of each sample was correlated (Spearman) to BrainSpan gene expression data, profiling the human brain transcriptome in postmortem specimens across the life span (16) (G). pcw, postconception weeks (prenatal); m, months (postnatal); y, years (postnatal).
Fig. 2.
Fig. 2.. Transcriptomic evidence of metabolic changes in 3q29Del.
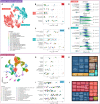
The umbrella pathways most frequently found to be differentially expressed based on up-regulated (B) and down-regulated (C) genes in cortical organoids (A). OXPHOS was enriched among both increased and decreased genes, but all clusters contributing to up-regulated OXPHOS were from 2-month organoids and all clusters contributing to down-regulated OXPHOS were from 12-month organoids. (D) Example violin plots visualizing log-normalized expression data of genes dysregulated in 2-month organoid clusters: MT-CO3 (increased in 3q29Del) encodes the respiratory chain complex IV subunit COX3, and LDHA (decreased in 3q29Del) is a key enzyme in glycolysis. (E) Example violin plots visualizing log-normalized expression data of genes dysregulated in 12-month organoid clusters: MT-ND1 (decreased in 3q29Del) encodes a component of respiratory chain complex I, and MT-ATP6 (decreased in 3q29Del) encodes a component of the ATP synthase complex. The most frequently up-regulated (G) and down-regulated (I) umbrella pathways in mouse isocortex (F) are shown. Treemaps derived from Revigo analysis (H and J) display the hierarchical organization of specific GO:BP terms identified in pathway analysis. Similar colors denote semantic similarity. The size of each rectangle is proportional to the number of clusters exhibiting overrepresentation of a given GO:BP term. (All P values are adjusted for multiple comparisons).
Fig. 3.
Fig. 3.. Common patterns of differential gene expression in two major mouse and human cell types.
Astrocytes were identified in human cortical organoids (12-month) and mouse isocortex. Corresponding clusters are color coded in blue in UMAP visualizations (A). The human homologs of mouse DEGs identified by MAST analysis were compared to organoid DEGs based on direction of change, and a significant overlap was observed between the down-regulated DEGs of mouse and organoid astrocyte clusters (B). Pathway analysis of overlapping DEGs showed that all significantly enriched GO:BP and Reactome (REAC) terms were related to mitochondrial function and metabolism (C). Upper- and deep-layer excitatory neuron DEGs were pooled, and unique organoid DEGs were compared to the human homologs of mouse DEGs based on direction of change. Corresponding clusters are color coded in red in UMAP visualizations (D). There was a significant overlap between the DEGs of mouse and organoid excitatory neuron clusters for both up-regulated and down-regulated genes (E). Decreased genes were heavily enriched for GO:BP and REAC terms related to mitochondrial function and cellular respiration (F). N.S., not significant.
Fig. 4.
Fig. 4.. Mitochondrial phenotypes in 3q29 mice and engineered cell lines.
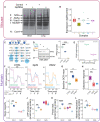
Mitochondrial fractions from adult mouse brain lysates were found to have selective decreases in components of OXPHOS complexes II and IV [(A) quantified in (B); N = 5]. At least seven 3q29-encoded proteins interact with mitochondria-localized proteins (C) [from Antonicka et al. (23)]. Symbol size reflects topological coefficients. HEK cell lines were engineered to carry either the heterozygous 3q29Del or completely lack PAK2 as shown by Western blot (D) [one-way analysis of variance (ANOVA), F(2,9) = 237.7, CTRL versus 3q29 or PAK2 ****P < 0.0001]. Control HEK-293T cells (CTRL) transition from a glycolytic to more aerobic cellular respiration state in galactose medium (E). Oxygen consumption rate (OCR) is significantly increased by 48-hour galactose medium challenge in CTRL cells (F) [two-way repeated measures (RM) ANOVA, main effect of medium F(1,6) = 23.99, **P = 0.0027] but not in 3q29 [two-way RM ANOVA, F(1,6) = 0.08808, P = 0.7766] or PAK2 cells [two-way RM ANOVA, F(1,6) = 0.6221, P = 0.4603]. Both 3q29 and PAK2 cells displayed increased baseline OCR (G) [one-way ANOVA, effect of genotype F(2,9) = 17.24, P = 0.0008; CTRL versus 3q29 ***P = 0.0004, CTRL versus PAK2 *P = 0.0332] and decreased response to galactose (H) [one-way ANOVA, effect of genotype F(2,9) = 8.838, P = 0.0075; CTRL versus 3q29 **P = 0.0074, CTRL versus PAK2 *P = 0.0138]. In glucose medium, 3q29 cells showed reduced spare capacity (I) [two-way ANOVA effect of genotype, F(2,18) = 13.04, P = 0.0003; CTRL versus 3q29 **P = 0.0047) and increased ATP production (J) [two-way ANOVA effect of genotype, F(2,18) = 4.309, P = 0.0296; CTRL versus 3q29 **P = 0.0079). Proton leak (K) was found to be increased in 3q29 cells in glucose [two-way ANOVA, main effect of genotype F(2,18) = 31.16, P < 0.0001; CTRL versus 3q29 ****P < 0.0001] and decreased in PAK2 cells in galactose (CTRL versus PAK2 ***P = 0.0007). Maximal respiration was significantly elevated in 3q29 cells in glucose (L) [two-way ANOVA interaction of genotype and medium, F(2,18) = 4.219, P = 0.0314; CTRL versus 3q29 *P = 0.0364) but was unchanged from CTRL under galactose conditions.
Fig. 5.
Fig. 5.. Lack of metabolic flexibility in 3q29Del NPCs.
(A) Control and 3q29Del NPCs exhibited normal morphology and stained positive for the neurofilament protein Nestin, multipotency marker SOX2, and NPC marker PAX6 (quantified in fig. S15). Scale bars, 50 μm. (B) Illustration of experimental design. NPCs were challenged for 48 hours in neural medium containing glucose (GLU) or galactose (GAL). (C) Table of cell lines used in this experiment. Data from three separate cohorts were combined in plots (D) to (M). N = 15 from six independent NPC lines for all experiments. (D) Energy map indicates that galactose treatment pushes cells from more glycolytic to more aerobic metabolic profile. (E) Control NPCs significantly increase OCR in galactose medium [two-way RM ANOVA main effect of medium, F(1,28) = 9.295, **P = 0.0050]. (F) 3q29Del NPCs exhibited no significant change in OCR in galactose medium [two-way RM ANOVA, medium effect F(1,28) = 0.01219, P = 0.9129]. (G) No significant difference in baseline OCR mean in glucose medium was observed (two-tailed ratio paired t test, P = 0.7015), but 3q29 NPCs displayed significantly lower baseline OCR mean in galactose medium (H) (two-tailed ratio paired t test, ***P = 0.0009). (I) Galactose response (i.e., basal OCR fold change over glucose) was unchanged in 3q29Del NPCs (two-tailed ratio paired t test, P = 0.0935). (J) Maximal respiration was unchanged in glucose medium (two-tailed ratio paired t test, P = 0.5028) but was significantly decreased in 3q29Del NPCs in galactose medium (K) (two-tailed ratio paired t test, ***P = 0.0007). Similarly, (L) the maximal respiration ratio of 3q29Del:control NPCs was unchanged in glucose medium (GLU) but was significantly reduced under galactose conditions (GAL; one sample two-tailed t test, **P = 0.0026). There was no significant change in spare capacity in 3q29Del NPCs (M) [two-way ANOVA genotype effect F(1,56) = 0.5930, P = 0.4445].

Update of

Similar articles

Cited by

References

    1. J. G. Mulle, M. J. Gambello, R. Sanchez Russo, M. M. Murphy, T. L. Burrell, C. Klaiman, S. White, C. A. Saulnier, E. F. Walker, J. F. Cubells, S. Shultz, L. Li, 3q29 recurrent deletion, in GeneReviews [Internet], M. P. Adam, G. M. Mirzaa, R. A. Pagon, S. E. Wallace, L. J. H. Bean, K. W. Gripp, A. Amemiya, Eds. (University of Washington, 2016).
    1. Mulle J. G., Dodd A. F., McGrath J. A., Wolyniec P. S., Mitchell A. A., Shetty A. C., Sobreira N. L., Valle D., Rudd M. K., Satten G., Cutler D. J., Pulver A. E., Warren S. T., Microdeletions of 3q29 confer high risk for schizophrenia. Am. J. Hum. Genet. 87, 229–236 (2010). - PMC - PubMed
    1. Mulle J. G., The 3q29 deletion confers >40-fold increase in risk for schizophrenia. Mol. Psychiatry 20, 1028–1029 (2015). - PMC - PubMed
    1. Marshall C. R., Howrigan D. P., Merico D., Thiruvahindrapuram B., Wu W., Greer D. S., Antaki D., Shetty A., Holmans P. A., Pinto D., Gujral M., Brandler W. M., Malhotra D., Wang Z., Fajarado K. V. F., Maile M. S., Ripke S., Agartz I., Albus M., Alexander M., Amin F., Atkins J., Bacanu S. A., Belliveau R. A. Jr., Bergen S. E., Bertalan M., Bevilacqua E., Bigdeli T. B., Black D. W., Bruggeman R., Buccola N. G., Buckner R. L., Bulik-Sullivan B., Byerley W., Cahn W., Cai G., Cairns M. J., Campion D., Cantor R. M., Carr V. J., Carrera N., Catts S. V., Chambert K. D., Cheng W., Cloninger C. R., Cohen D., Cormican P., Craddock N., Crespo-Facorro B., Crowley J. J., Curtis D., Davidson M., Davis K. L., Degenhardt F., Del Favero J., DeLisi L. E., Dikeos D., Dinan T., Djurovic S., Donohoe G., Drapeau E., Duan J., Dudbridge F., Eichhammer P., Eriksson J., Escott-Price V., Essioux L., Fanous A. H., Farh K. H., Farrell M. S., Frank J., Franke L., Freedman R., Freimer N. B., Friedman J. I., Forstner A. J., Fromer M., Genovese G., Georgieva L., Gershon E. S., Giegling I., Giusti-Rodriguez P., Godard S., Goldstein J. I., Gratten J., de Haan L., Hamshere M. L., Hansen M., Hansen T., Haroutunian V., Hartmann A. M., Henskens F. A., Herms S., Hirschhorn J. N., Hoffmann P., Hofman A., Huang H., Ikeda M., Joa I., Kahler A. K., Kahn R. S., Kalaydjieva L., Karjalainen J., Kavanagh D., Keller M. C., Kelly B. J., Kennedy J. L., Kim Y., Knowles J. A., Konte B., Laurent C., Lee P., Lee S. H., Legge S. E., Lerer B., Levy D. L., Liang K. Y., Lieberman J., Lonnqvist J., Loughland C. M., Magnusson P. K. E., Maher B. S., Maier W., Mallet J., Mattheisen M., Mattingsdal M., McCarley R. W., McDonald C., McIntosh A. M., Meier S., Meijer C. J., Melle I., Mesholam-Gately R. I., Metspalu A., Michie P. T., Milani L., Milanova V., Mokrab Y., Morris D. W., Muller-Myhsok B., Murphy K. C., Murray R. M., Myin-Germeys I., Nenadic I., Nertney D. A., Nestadt G., Nicodemus K. K., Nisenbaum L., Nordin A., O'Callaghan E., O'Dushlaine C., Oh S. Y., Olincy A., Olsen L., O'Neill F. A., Van Os J., Pantelis C., Papadimitriou G. N., Parkhomenko E., Pato M. T., Paunio T.; Psychosis Endophenotypes International Consortium, Perkins D. O., Pers T. H., Pietilainen O., Pimm J., Pocklington A. J., Powell J., Price A., Pulver A. E., Purcell S. M., Quested D., Rasmussen H. B., Reichenberg A., Reimers M. A., Richards A. L., Roffman J. L., Roussos P., Ruderfer D. M., Salomaa V., Sanders A. R., Savitz A., Schall U., Schulze T. G., Schwab S. G., Scolnick E. M., Scott R. J., Seidman L. J., Shi J., Silverman J. M., Smoller J. W., Soderman E., Spencer C. C. A., Stahl E. A., Strengman E., Strohmaier J., Stroup T. S., Suvisaari J., Svrakic D. M., Szatkiewicz J. P., Thirumalai S., Tooney P. A., Veijola J., Visscher P. M., Waddington J., Walsh D., Webb B. T., Weiser M., Wildenauer D. B., Williams N. M., Williams S., Witt S. H., Wolen A. R., Wormley B. K., Wray N. R., Wu J. Q., Zai C. C., Adolfsson R., Andreassen O. A., Blackwood D. H. R., Bramon E., Buxbaum J. D., Cichon S., Collier D. A., Corvin A., Daly M. J., Darvasi A., Domenici E., Esko T., Gejman P. V., Gill M., Gurling H., Hultman C. M., Iwata N., Jablensky A. V., Jonsson E. G., Kendler K. S., Kirov G., Knight J., Levinson D. F., Li Q. S., McCarroll S. A., McQuillin A., Moran J. L., Mowry B. J., Nothen M. M., Ophoff R. A., Owen M. J., Palotie A., Pato C. N., Petryshen T. L., Posthuma D., Rietschel M., Riley B. P., Rujescu D., Sklar P., Clair D. S., Walters J. T. R., Werge T., Sullivan P. F., O'Donovan M. C., Scherer S. W., Neale B. M., Sebat J.; Cnv and Schizophrenia Working Groups of the Psychiatric Genomics Consortium , Contribution of copy number variants to schizophrenia from a genome-wide study of 41,321 subjects. Nat. Genet. 49, 27–35 (2017). - PMC - PubMed
    1. Russo R. S., Gambello M. J., Murphy M. M., Aberizk K., Black E., Burrell T. L., Carlock G., Cubells J. F., Epstein M. T., Espana R., Goines K., Guest R. M., Klaiman C., Koh S., Leslie E. J., Li L., Novacek D. M., Saulnier C. A., Sefik E., Shultz S., Walker E., White S. P.; Emory 3q29 Project, Mulle J. G., Deep phenotyping in 3q29 deletion syndrome: Recommendations for clinical care. Genet. Med. 23, 872–880 (2021). - PMC - PubMed