. 2023 Aug 18;9(33):eadg6061.
doi: 10.1126/sciadv.adg6061. Epub 2023 Aug 16.

Profiling single cancer cell metabolism via high-content SRS imaging with chemical sparsity

Affiliations

Profiling single cancer cell metabolism via high-content SRS imaging with chemical sparsity

Yuying Tan et al. Sci Adv. .

Abstract

Metabolic reprogramming in a subpopulation of cancer cells is a hallmark of tumor chemoresistance. However, single-cell metabolic profiling is difficult because of the lack of a method that can simultaneously detect multiple metabolites at the single-cell level. In this study, through hyperspectral stimulated Raman scattering (hSRS) imaging in the carbon-hydrogen (C-H) window and sparsity-driven hyperspectral image decomposition, we demonstrate a high-content hSRS (h2SRS) imaging approach that enables the simultaneous mapping of five major biomolecules, including proteins, carbohydrates, fatty acids, cholesterol, and nucleic acids at the single-cell level. h2SRS imaging of brain and pancreatic cancer cells under chemotherapy revealed acute and adapted chemotherapy-induced metabolic reprogramming and the unique metabolic features of chemoresistance. Our approach is expected to facilitate the discovery of therapeutic targets to combat chemoresistance. This study illustrates a high-content, label-free chemical imaging approach that measures metabolic profiles at the single-cell level and warrants further research on cellular metabolism.


Figures
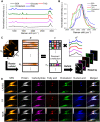
Fig. 1.
Fig. 1.. Sparsity constraints accompanied by improved spectral and spatial resolution enable h2SRS imaging.
(A) Raman spectra of BSA, glucose, TAG, cholesterol, and purified RNA from cells. (B) Normalized SRS spectra of BSA, glucose, TAG, cholesterol, and purified RNA from cells. (C) Schematic illustration of pixel-wise LASSO spectral unmixing for chemical mapping generation. Nx, Ny, and Nλ represent dimensions of the hyperspectral image, and D, C, and S stand for the data matrix, concentration matrix, and spectral reference matrix, respectively. The circled elements represent the dominant components in each row. (D) Representative hSRS image (sum of all channels), mapped protein, carbohydrate, fatty acid, cholesterol, and nucleic acid images, as well as the merged image of metabolites mapping for U87 cells through LASSO, LS fitting, or MCR separation processing. Each channel has the same contrast and shares a color bar. The ranges of color bars are 0 to 150, 0 to 8, 0 to 3, 0 to 5, 0 to 2, and 0 to 0.6. Scale bar, 20 μm.
Fig. 2.
Fig. 2.. h2SRS imaging can precisely map intracellular carbohydrates in cancer cells.
(A) Representative hSRS image, h2SRS mapped protein, carbohydrate, fatty acid, cholesterol, and nucleic acid images, as well as the merged image of metabolites mapping for U87 cultured in a control or glucose depletion medium. The ranges of color bars are 0 to 400, 0 to 2, 0 to 1.2, 0 to 2, 0 to 2.4, and 0 to 0.5. Scale bar, 20 μm. (B) Quantitative analysis of h2SRS-mapped signal of protein, carbohydrate, fatty acid, or cholesterol for U87 cultured in a control or glucose depletion medium. n = 13 to 35. (C) Representative hSRS image (sum of all channels), h2SRS mapped protein, carbohydrate, fatty acid, cholesterol, and nucleic acid images, as well as the merged image of metabolites mapping for Mia Paca2 cultured in a control or glucose depletion medium. The ranges of color bars are 0 to 300, 0 to 3, 0 to 0.4, 0 to 0.5, 0 to 1, and 0 to 0.1. Scale bar, 20 μm. (D) Quantitative analysis of h2SRS-mapped signal of protein, carbohydrate, fatty acid, or cholesterol for Mia Paca2 cultured in a control or glucose depletion medium. n = 36 to 43. The box in the violin plot indicates means ± SD. **P < 0.01 and ***P < 0.001. (E and F) Representative h2SRS-mapped carbohydrate and periodic acid–Schiff (PAS) staining images of U87 (E) and SKOV3 (F). Carbohydrate-rich droplets are highlighted in (E) with yellow arrows in original images and zoomed-in regions [(E), second column]. Each compared channel (A and C) has the same contrast and shares a color bar. Scale bars, 20 μm.
Fig. 3.
Fig. 3.. h2SRS imaging can precisely separate fatty acids from other biomolecules in cancer cells.
(A) Representative hSRS image, h2SRS mapped protein, carbohydrate, fatty acid, cholesterol, and nucleic acid images, as well as the merged image of metabolites mapping for U87 cultured in a control (with fetal bovine serum), lipid depletion (with delipid serum), or lipid depletion medium supplementary with 1% lipid mixture. Each channel has the same contrast and shares a color bar. The ranges of color bars are 0 to 250, 0 to 3, 0 to 0.9, 0 to 0.8, 0 to 1.2, and 0 to 0.1. (B) Quantitative analysis of h2SRS-mapped signal of protein, carbohydrate, fatty acid, or cholesterol for U87 cultured in control, lipid depletion medium, or lipid depletion medium supplementary with 1% lipid mixture. n = 10 to 15. *P < 0.05, **P < 0.01, and ***P < 0.001. (C) Representative hSRS image, h2SRS mapped protein, carbohydrate, fatty acid, cholesterol, and nucleic acid images, as well as the merged image of metabolites mapping for U87 cultured in medium with excess cholesterol with protein, fatty acid, and cholesterol-rich droplets highlighted. The ranges of color bars are 0 to 300, 0 to 1.1, 0 to 0.4, 0 to 1.8, and 0 to 2. (D) SRS spectra of BSA, TAG, and cholesterol in 1600 cm−1 and C–H regions. (E) SRS spectra of protein, fatty acid, and cholesterol-rich droplets are highlighted in (C) in 1600 cm−1 and C–H regions. The cholesterol peak at 1674 cm−1 and the TAG peak at 1655 cm−1 are highlighted with green and red dash lines in (D) and (E), respectively. Scale bars, 20 μm.
Fig. 4.
Fig. 4.. h2SRS imaging reveals cholesterol content change in response to culture environment alternation and drug treatment in brain cancer cells.
(A) Representative hSRS image, h2SRS mapped protein, carbohydrate, fatty acid, cholesterol, and nucleic acid images, as well as the merged image of metabolites mapping for U87 cultured in a control medium or medium with excess cholesterol. The ranges of color bars are 0 to 400, 0 to 2, 0 to 0.4, 0 to 0.6, 0 to 2, and 0 to 0.7. (B) Quantitative analysis of h2SRS mapped signal of protein, carbohydrate, fatty acid, or cholesterol for U87 cultured in a control medium or medium with excess cholesterol. n = 14 to 19. (C) Representative hSRS image, h2SRS mapped protein, carbohydrate, fatty acid, cholesterol, and nucleic acid images, as well as the merged image of metabolites mapping for U87 with or without cholesterol remover methyl-β-cyclodextrin (MβCD) treatment. The ranges of color bars are 0 to 300, 0 to 2, 0 to 0.8, 0 to 1.5, 0 to 1, and 0 to 0.4. (D) Quantitative analysis of h2SRS mapped signal of protein, carbohydrate, fatty acid, or cholesterol for U87 treated with or without MβCD. n = 14 to 20. Each channel has the same contrast and shares a color bar. Scale bars, 20 μm. The box in the violin plot indicates means ± SD. *P < 0.05 and ***P < 0.001.
Fig. 5.
Fig. 5.. h2SRS imaging discloses metabolic profile reprogramming in brain cancer cells after cisplatin treatment.
(A) Representative images of hSRS, h2SRS mapped protein, carbohydrate, fatty acid, cholesterol, and nucleic acid, as well as merged mapping for U87 cells treated with or without cisplatin. Each channel has the same contrast and shares a color bar. The ranges of color bars are 0 to 150, 0 to 1.5, 0 to 0.3, 0 to 0.5, 0 to 0.5, and 0 to 0.05. (B) Quantitative analysis for (A). The box indicates means ± SD. n = 59 to 62. (C and D) Representative SRS images and quantitative C–D signal of U87 cells cultured with 25 mM glucose-D7, with or without 3.3 μM cisplatin treatment for 72 hours. n = 112 to 139. (E) Relative mRNA expression of GLUT1 in U87 cells treated with cisplatin for 48 hours. (F and G) Dose-response curve to cisplatin for U87 cultured with control or no glucose medium and with or without supplemental 1 μM BAY-876. (H and I) Representative SRS images and quantitative C–D signal of U87 cells cultured with 20 μM OA-D34 with or without 1.65 μM cisplatin treatment for 48 hours. n = 111 to 146. (J) Relative mRNA expression of CD36 in U87 cells treated with cisplatin for 48 hours. (K and L) Dose-response curve to cisplatin for U87 cultured in medium with control or delipid serum and with or without supplemental 200 μM sulfosuccinimidyl oleate (SSO). n = 3 to 7 for (F), (G), (K), and (L). Scale bars, 20 μm (A) and 50 μm (C and H). In (D) and (I), the box indicates means ± SE; the whisker represents 5 to 95% of the data. Data in (E) and (J) are shown as means + SD. *P < 0.05. DMSO, dimethyl sulfoxide.
Fig. 6.
Fig. 6.. h2SRS imaging unveils metabolic profile reprogramming in gemcitabine-treated or -resistant pancreatic cancer cells.
(A) Representative hSRS image, h2SRS mapped protein, carbohydrate, fatty acid, cholesterol, and nucleic acid images, as well as the merged image of metabolites mapping for gemcitabine-sensitive Mia Paca2 and resistant G3K cells treated with or without gemcitabine. Scale bar, 20 μm. Each channel has the same contrast and shares a color bar. The ranges of color bars are 0 to 250, 0 to 1.8, 0 to 0.4, 0 to 1.2, 0 to 6, and 0 to 0.05. (B) Quantitative analysis of h2SRS mapped signal of protein, carbohydrate, fatty acid, or cholesterol for Mia Paca2 and G3K with or without gemcitabine treatment. n = 83 to 105. The box in the violin plot indicates means ± SD. (C to E) Relative mRNA expression level of GLUT1 in Mia Paca2 and G3K cells treated with (D and E) or without (C) gemcitabine for 72 hours. (F and G) Dose-response curve to gemcitabine with or without supplemental 50 nM BAY-876 treatment for Mia Paca2 (F) and G3K (G) cells. (H to J) Relative mRNA expression level of GLUT1 in Mia Paca2 and G3K cells treated with (I and J) or without (H) gemcitabine for 72 hours. Data in all the bar charts (C to E and H to J) are shown as means + SD. (K and L) Dose-response curve to gemcitabine with or without supplemental 200 μM SSO treatment for Mia Paca2 (K) and G3K (L) cells. n = 3 for dose-response viability assay (F, G, K, and L). *P < 0.05, **P < 0.01, and ***P < 0.001.
Fig. 7.
Fig. 7.. Single-cell–based 3D scatterplot reveals cancer cell metabolic profile reprogramming induced by chemotherapy.
(A) Three-dimensional scatterplots of h2SRS mapped carbohydrate, fatty acid, and cholesterol intensity for Mia Paca2 and G3K cell based on single-cell analysis. n = 94 to 106. (B) Three-dimensional scatterplots of h2SRS mapped carbohydrate, fatty acid, and cholesterol intensity for Mia Paca2 with or without gemcitabine treatment. n = 84 to 94. (C) Three-dimensional scatterplots of h2SRS mapped carbohydrate, fatty acid, and cholesterol intensity for U87 treated with or without cisplatin. n = 59 to 62. Each point represents a single cell, and the ellipsoids represent 80% of data coverage.

Similar articles

Cited by

References

    1. K. D. Miller, L. Nogueira, A. B. Mariotto, J. H. Rowland, K. R. Yabroff, C. M. Alfano, A. Jemal, J. L. Kramer, R. L. Siegel, Cancer treatment and survivorship statistics, 2019. CA Cancer J. Clin. 69, 363–385 (2019). - PubMed
    1. X. Wang, H. Zhang, X. Chen, Drug resistance and combating drug resistance in cancer. Cancer Drug Resist. 2, 141–160 (2019). - PMC - PubMed
    1. X. Chen, S. Chen, D. Yu, Metabolic reprogramming of chemoresistant cancer cells and the potential significance of metabolic regulation in the reversal of cancer chemoresistance. Metabolites 10, 289 (2020). - PMC - PubMed
    1. J. Kopecka, P. Trouillas, A. C. Gasparovic, E. Gazzano, Y. G. Assaraf, C. Riganti, Phospholipids and cholesterol: Inducers of cancer multidrug resistance and therapeutic targets. Drug Resist. Updat. 49, 100670 (2020). - PubMed
    1. S. Hultsch, M. Kankainen, L. Paavolainen, R. M. Kovanen, E. Ikonen, S. Kangaspeska, V. Pietiainen, O. Kallioniemi, Association of tamoxifen resistance and lipid reprogramming in breast cancer. BMC Cancer 18, 850 (2018). - PMC - PubMed