. 2023 Aug 18;9(33):eade2120.
doi: 10.1126/sciadv.ade2120. Epub 2023 Aug 16.

Fibroblasts generate topographical cues that steer cancer cell migration

Affiliations

Fibroblasts generate topographical cues that steer cancer cell migration

Francesco Baschieri et al. Sci Adv. .

Abstract

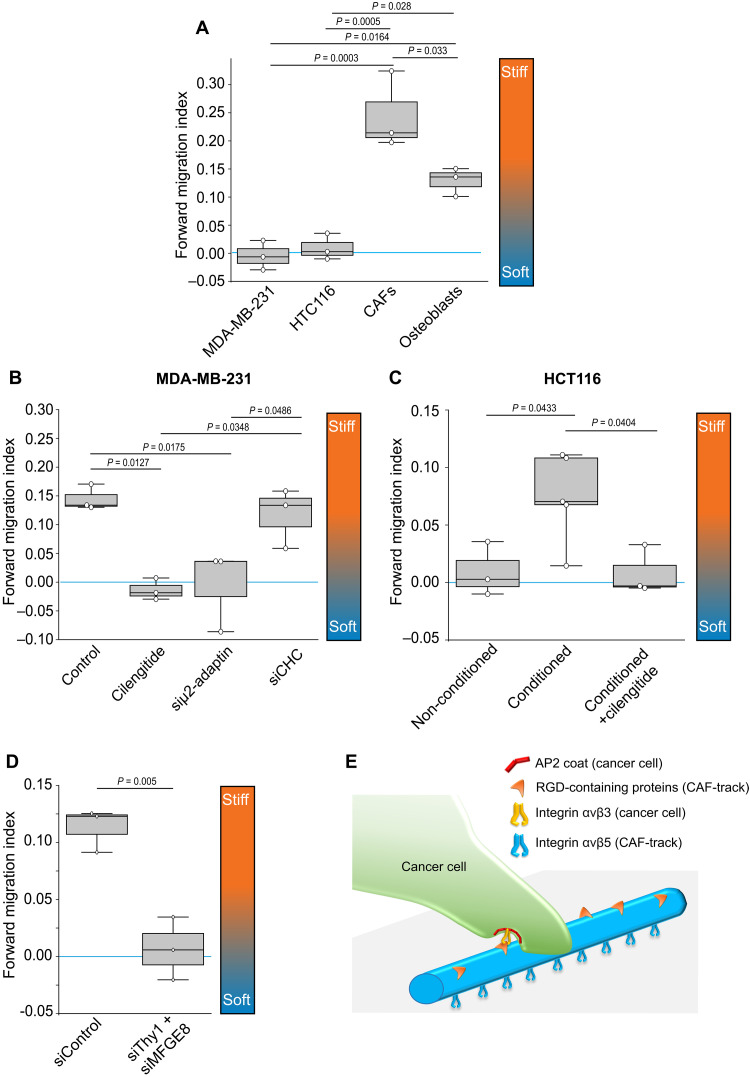
Fibroblasts play a fundamental role in tumor development. Among other functions, they regulate cancer cells' migration through rearranging the extracellular matrix, secreting soluble factors, and establishing direct physical contacts with cancer cells. Here, we report that migrating fibroblasts deposit on the substrate a network of tubular structures that serves as a guidance cue for cancer cell migration. Such membranous tubular network, hereafter called tracks, is stably anchored to the substrate in a β5-integrin-dependent manner. We found that cancer cells specifically adhere to tracks by using clathrin-coated structures that pinch and engulf tracks. Tracks thus represent a spatial memory of fibroblast migration paths that is read and erased by cancer cells directionally migrating along them. We propose that fibroblast tracks represent a topography-based intercellular communication system capable of steering cancer cell migration.


Figures

Fig. 1.
Fig. 1.. CAFs deposit membranous tracks during migration.
(A) CAFs stably expressing CAAX-mOrange were seeded on glass and imaged by spinning disk microscopy for 9 hours. Scale bar, 20 μm. (B) CAAX-mOrange-expressing CAFs (blue) were embedded in a 3D network composed of collagen fibers (red) and allowed to migrate for 24 hours. Cells were then imaged by spinning disk microscopy. Scale bar, 20 μm. (C) Measurement of angles formed by track branches. (D) CAFs stably expressing CAAX-mOrange were allowed to migrate on glass and imaged by spinning disk microscopy. Arrowheads point to a migrasome and arrows indicate the site of membrane rupture. Scale bar, 5 μm. (E) CAFs stably expressing BFP-tagged β5-integrin were allowed to deposit tracks on glass. Tracks were imaged the first day (day 0) and then at day 3 after deposition. Scale bar, 10 μm. (F) Tracks as in (E) were imaged on day 0 and day 3. The histogram represents the percentage of tracks being identical between the two time points (Fully conserved), deteriorated (Partially conserved), or lost. A total of 26 tracks from three independent experiments were monitored. The percentage of each category is shown on the graph ± SD (Kruskal-Wallis test).
Fig. 2.
Fig. 2.. CAFs deposit tracks in a β5-integrin-dependent manner.
(A) CAFs were allowed to migrate on glass, then fixed and stained with the indicated antibodies. Scale bars, 20 μm. (B) CAFs transfected with control or β5-integrin siRNA were allowed to migrate on glass for 48 hours, before cells and tracks were labeled with Alexa-488-labeleld Wheat Germ Agglutinin and imaged. Scale bar, 20 μm. (C) Cells were transfected with control or β5-integrin specific siRNAs and with or without a β5-encoding construct resistant to siRNA1, as indicated (condition labeled “rescue”). Cells were then monitored for track deposition. Data represent the mean percentage ± SD of cells depositing tracks from three independent experiments (Kruskal-Wallis test). (D) CAFs were plated on collagen-coated polyacrylamide gels of indicated rigidities and allowed to deposit tracks for 24 hours before they are fixed and stained for β5-integrin. Results are expressed as the mean percentage of cells depositing tracks ± SD from three independent experiments (one-way ANOVA, Tukey’s multiple comparison). (E) CAFs transfected with the indicated siRNAs were allowed to migrate on glass for 48 hours in the presence or absence of 10 μM blebbistatin. Cells were then fixed and stained for integrin αvβ5 to count how many cells would leave tracks. Data represent the mean percentage ± SD of cells depositing tracks from three independent experiments (Kruskal-Wallis test).
Fig. 3.
Fig. 3.. CAF-tracks represent adhesion cues for cancer cells.
(A) MDA-MB-231 cells observed in bright field were allowed to spread on glass substrates covered with tracks deposited by CAAX-mOrange overexpressing CAFs. Scale bar, 30 μm. (B) β5-integrin-BFP overexpressing CAFs were allowed to deposit tracks for 48 hours on glass-bottom dishes coated or not with collagen or fibronectin, as indicated. Tracks’ positions were imaged before MDA-MB-231 cells were seeded on the substrates. For the “Phantom tracks” condition, tracks were imaged and removed from the substrate using cilengitide before seeding MDA-MB-231 cells. The number of MDA-MB-231 cells adhering in tracks areas versus in other areas of the substrates was measured. Results are expressed as the mean ratio ± SD of cell density on tracks versus in other areas of the substrate from four (three for phantom tracks) independent experiments (uncorrected Fisher’s LSD test). A value of 1 (blue line) means no enrichment on tracks. (C) Color-coded representation of time-lapse recording of vinculin-GFP-expressing MDA-MB-231 cells allowed to migrate for 220 min on tracks deposited by β5-integrin-BFP expressing CAFs. Scale bar, 20 μm. (D) CAFs were allowed to deposit tracks on glass before they are stained for αvβ5-integrin and fibronectin, as indicated. Scale bar, 10 μm. (E) CAFs expressing β5-integrin-BFP were allowed to migrate for 48 hours on gridded coverslips. Tracks’ positions were recorded before cilengitide was added to remove tracks and same positions were imaged again (after). Scale bar, 20 μm. (F) Tracks as in (E) and originating from 41 cells from three independent experiments were evaluated for their integrity after cilengitide treatment. The percentage of each category ± SD is shown (Kruskal-Wallis test).
Fig. 4.
Fig. 4.. CCSs are required to adhere to CAF-tracks.
(A) Vinculin-GFP-expressing MDA-MB-231 cells after 30 min of spreading on β5-integrin-BFP-positive tracks. Scale bar, 10 μm (B) Quantification of images as in (A). A total of 27 cells from three independent experiments were analyzed. A value of 1 (blue line) means no enrichment on tracks. Results are represented as mean ± SD (Student’s t test). (C) MDA-MB-231 cells transfected with the indicated siRNAs were seeded on β5-integrin-BFP-labeled tracks and imaged every 5 min for 8 hours. Results are expressed as mean ratio of cells in track versus nontrack areas ± SD from three to five independent experiments (ANOVA-Dunnett’s multiple comparison). A value of 1 (blue line) means no enrichment on tracks. (D) Quantification of images as in (E). A total of 28 cells from three independent experiments were analyzed. A value of 1 (blue line) means no enrichment on tracks. Results are represented as mean ± SD (Student’s t test). (E) μ2-Adaptin-mCherry MDA-MB-231 after 30 min of spreading on β5-integrin-BFP tracks. Scale bar, 10 μm. (F and G) μ2-Adaptin-mCherry MDA-MB-231 adhering on β5-integrin-BFP tracks were imaged every 5 s for 5 min. Lifetime (F) and nucleation rates (G) of CCSs on or outside tracks were measured. A total of 17 cells from three independent experiments were analyzed. Results are expressed as mean ± SD (Student’s t test). (H) Kymograph of μ2-adaptin-mCherry MDA-MB-231 adhering on β5-integrin-BFP tracks. (I) μ2-Adaptin-mCherry-GFP MDA-MB-231 embedded in a 3D network of fluorescent collagen fibers containing CAAX-mOrange-labeled tracks. Scale bar, 10 μm. (J) Kymograph of the dotted region in I. (K and L) μ2-Adaptin-mCherry-GFP MDA-MB-231 in a 3D network of fluorescent collagen fibers containing CAF-tracks were imaged every 10 s for 5 min. Lifetime (K) and nucleation rates (L) of CCSs on versus outside tracks was calculated. A total of 18 cells from three independent experiments were analyzed. Results are expressed as mean ± SD (Mann-Whitney test).
Fig. 5.
Fig. 5.. Mechanism of CCS recruitment and cancer cell adhesion on tracks.
(A) Immunostaining of the α-adaptin subunit of AP-2 (MDA-MB-231 cells) and integrin αvβ5 (CAF-track) imaged by 3D super-resolution microscopy. Scale bar, 10 μm. (B) 3D super-resolution microscopy images of α-adaptin and integrin αvβ5 as in (A) and observed in XY and XZ planes, as indicated. Red arrowheads point to a budding CCS containing integrin αvβ5. XZ projections of the boxed area are shown. Scale bars, 200 nm. Color-coded scales indicate distance from glass in nanometers. (C) MDA-MB-231 transfected with the indicated siRNAs were seeded on β5-integrin-BFP tracks and imaged every 10 min for 3 hours. Data represent the evolution over time of the mean β5-integrin-BFP fluorescence intensity ± SD from three independent experiments (Dunnett’s multiple comparisons test; P < 0.0001 as compared to siControl). (D) CAFs transfected with the indicated siRNAs were allowed to migrate on glass coverslips for 48 hours to deposit tracks. MDA-MB-231 genome-edited to express μ2-adaptin-GFP-RFP were then seeded on tracks for 35 min before they are fixed and tracks were stained with β5-integrin specific antibodies. Scale bars, 10 μm. (E) MDA-MB-231 transfected with the indicated siRNAs were seeded on β5-integrin-BFP tracks and imaged every 5 min for 8 hours. The number of cancer cells adhering on tracks versus outside of tracks was quantified and expressed as a mean ratio ± SD from three independent experiments (Kruskal-Wallis test). A value of 1 (blue line) means no enrichment on tracks. (F) MDA-MB-231 genome-edited to express μ2-adaptin-mCherry and stably expressing β3-integrin-GFP were seeded on β5-integrin-BFP osteoblast-tracks and imaged by TIRF microscopy every 5 min for 8 hours. Representative images of the initial phase of MDA-MB-231 cells spreading on tracks are shown. Scale bar, 20 μm. (G) Kymograph corresponding to the boxed area in (F).
Fig. 6.
Fig. 6.. CAF-tracks orientate cancer cell migration.
(A) Cells seeded on collagen-coated rigidity gradients were imaged every 20 min for 14 hours, manually tracked, and forward migration index (FMI) was calculated using the Chemotaxis tool FIJI plugin. Values close to 0 (blue line) indicate random migration. Gradient orientation is shown. A total of 350 MDA-MB-231, 204 CAFs, 514 HTC116, and 505 osteoblasts were tracked in three independent experiments. Data are expressed as mean FMI ± SD (ANOVA-Tukey’s multiple comparison). (B) Control or siRNA-treated MDA-MB-231 cells were seeded on collagen-coated rigidity gradients conditioned by CAFs and treated or not with cilengitide. Cells were imaged every 20 min for 14 hours and manually tracked, and FMI was calculated using the Chemotaxis tool FIJI plugin. Values close to 0 (blue line) indicate random migration. Gradient orientation is shown. A total of 281 (control), 626 (cilengitide), 424 (siμ2-adaptin), and 362 (siCHC) cells were tracked from three independent experiments. Data are expressed as mean FMI ± SD (ANOVA-Tukey’s multiple comparison). (C) HCT116 cells were seeded on collagen-coated rigidity gradients conditioned or not by CAFs and treated or not with cilengitide. Cells were imaged every 20 min for 14 hours and manually tracked, and FMI was calculated using the Chemotaxis tool FIJI plugin. Values close to 0 (blue line) indicate random migration. Gradient orientation is shown. A total of 514 (nonconditioned), 1039 (conditioned), and 465 (conditioned + cilengitide) cells were tracked from three to five independent experiments. Data are expressed as mean FMI ± SD (ANOVA-Dunnett’s multiple comparison). (D) MDA-MB-231 cells were seeded on collagen-coated rigidity gradients conditioned by CAFs, imaged every 20 min for 14 hours, and manually tracked, and FMI was calculated using the Chemotaxis tool FIJI plugin. Values close to 0 (blue line) indicate random migration. Gradient orientation is shown. A total of 736 (siControl) and 877 (siThy1 + siMFGE8) cells from three independent experiments were tracked. (E) Model of cancer cell adhesion along CAF-tracks.

References

    1. J. Fares, M. Y. Fares, H. H. Khachfe, H. A. Salhab, Y. Fares, Molecular principles of metastasis: A hallmark of cancer revisited. Signal Trans. Target. Ther. 5, 28 (2020). - PMC - PubMed
    1. J. Wyckoff, W. Wang, E. Y. Lin, Y. Wang, F. Pixley, E. R. Stanley, T. Graf, J. W. Pollard, J. Segall, J. Condeelis, A paracrine loop between tumor cells and macrophages is required for tumor cell migration in mammary tumors. Cancer Res. 64, 7022–7029 (2004). - PubMed
    1. R. S. Fischer, X. Sun, M. A. Baird, M. J. Hourwitz, B. R. Seo, A. M. Pasapera, S. B. Mehta, W. Losert, C. Fischbach, J. T. Fourkas, C. M. Waterman, Contractility, focal adhesion orientation, and stress fiber orientation drive cancer cell polarity and migration along wavy ECM substrates. Proc. Natl. Acad. Sci. U.S.A. 118, e2021135118 (2021). - PMC - PubMed
    1. B. Erdogan, M. Ao, L. M. White, A. L. Means, B. M. Brewer, L. Yang, M. K. Washington, C. Shi, O. E. Franco, A. M. Weaver, S. W. Hayward, D. Li, D. J. Webb, Cancer-associated fibroblasts promote directional cancer cell migration by aligning fibronectin. J. Cell Biol. 216, 3799–3816 (2017). - PMC - PubMed
    1. M. J. Oudin, V. M. Weaver, Physical and chemical gradients in the tumor microenvironment regulate tumor cell invasion, migration, and metastasis. Cold Spring Harb. Symp. Quant. Biol. 81, 189–205 (2016). - PubMed