. 2023 Aug 18;9(33):eadi5548.
doi: 10.1126/sciadv.adi5548. Epub 2023 Aug 16.

Loss of function of the ALS-associated NEK1 kinase disrupts microtubule homeostasis and nuclear import

Affiliations

Loss of function of the ALS-associated NEK1 kinase disrupts microtubule homeostasis and nuclear import

Jacob R Mann et al. Sci Adv. .

Abstract

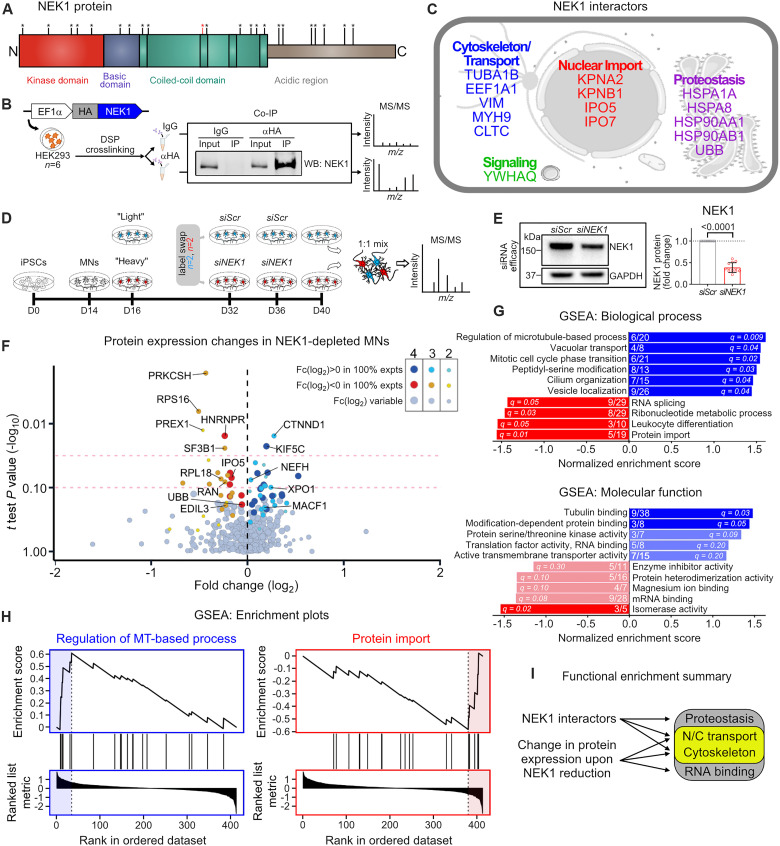
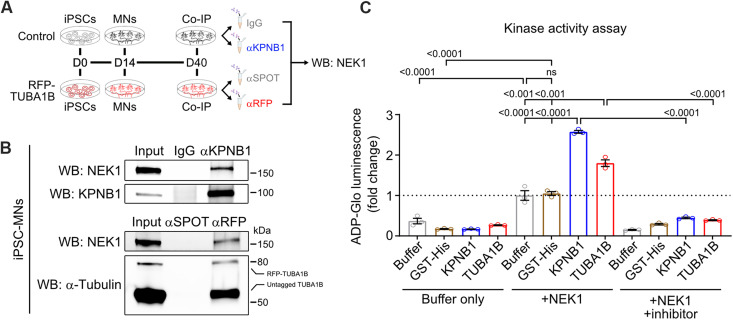
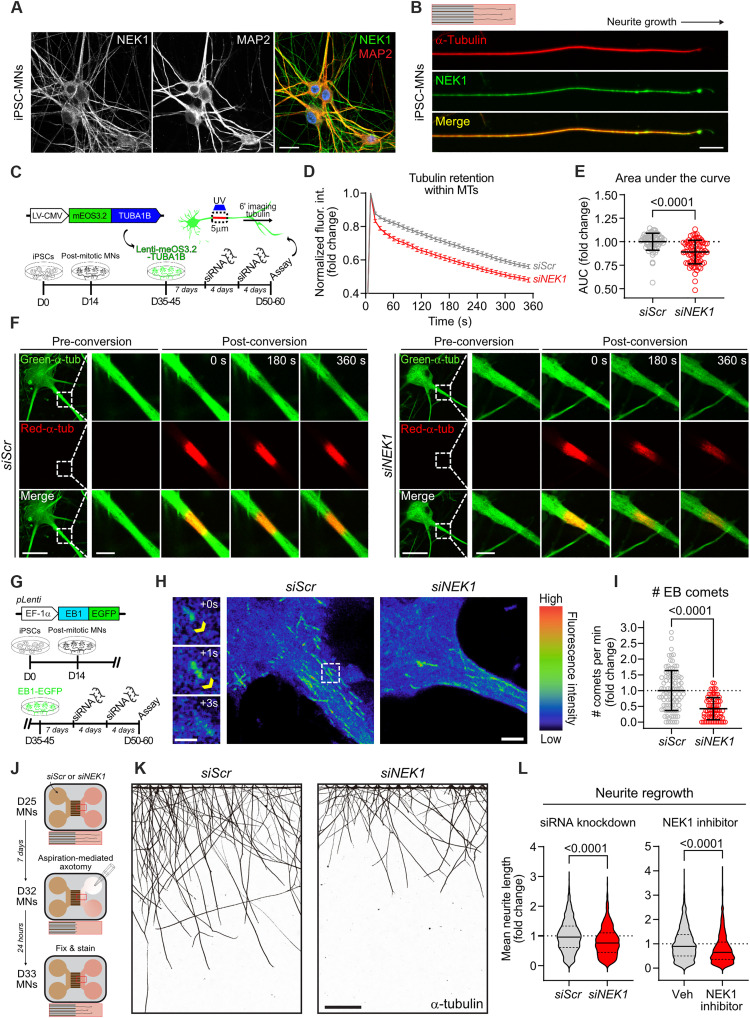
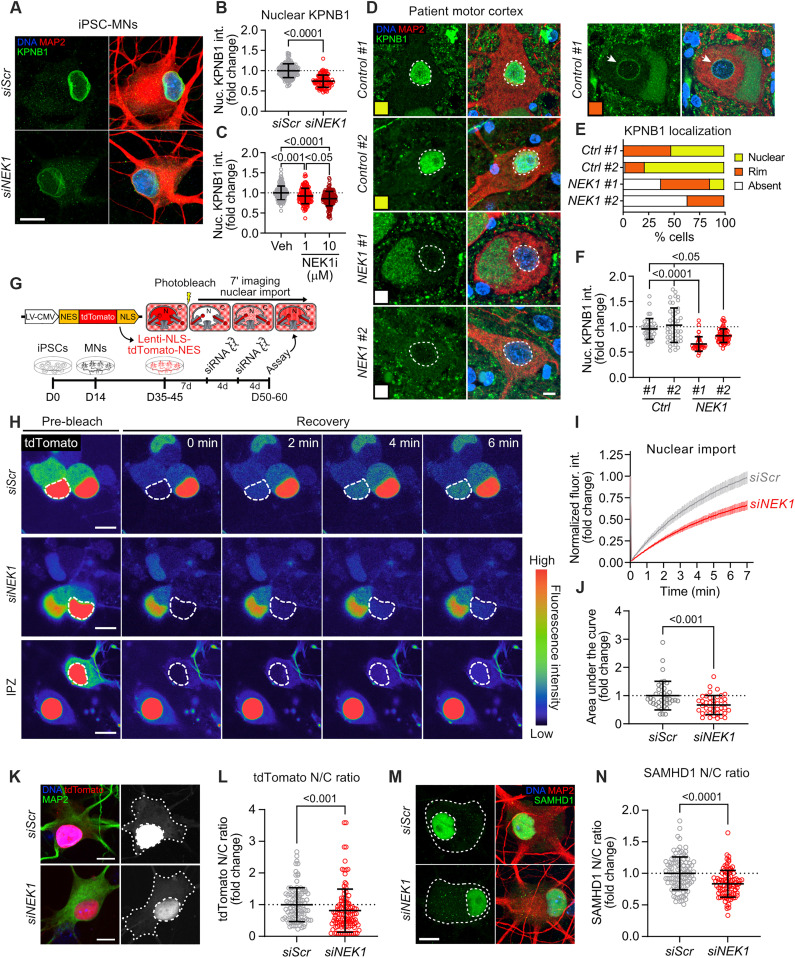
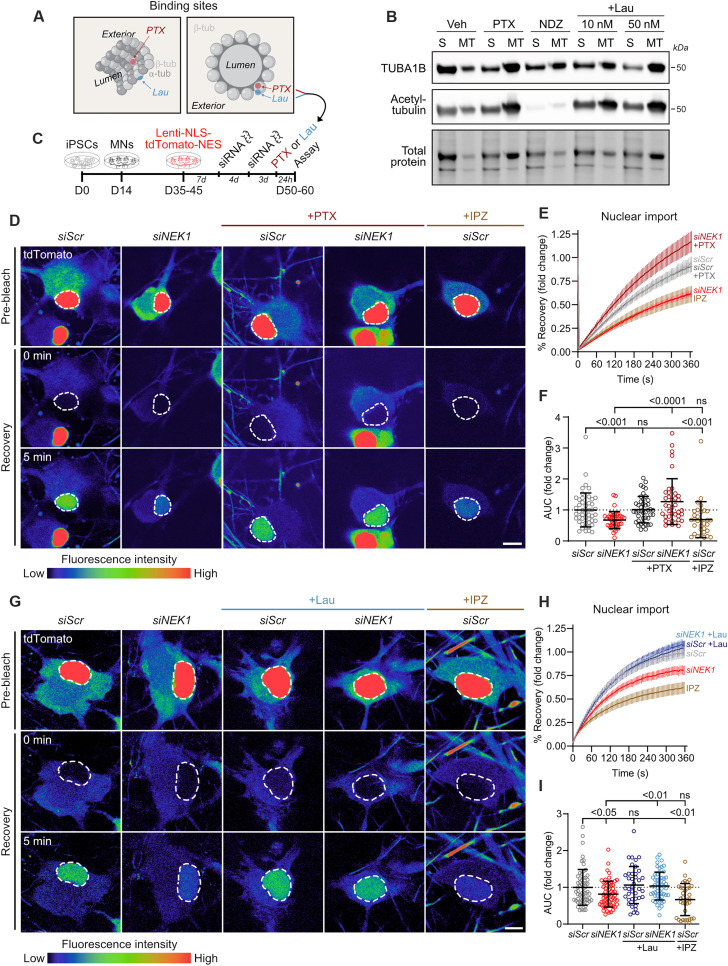
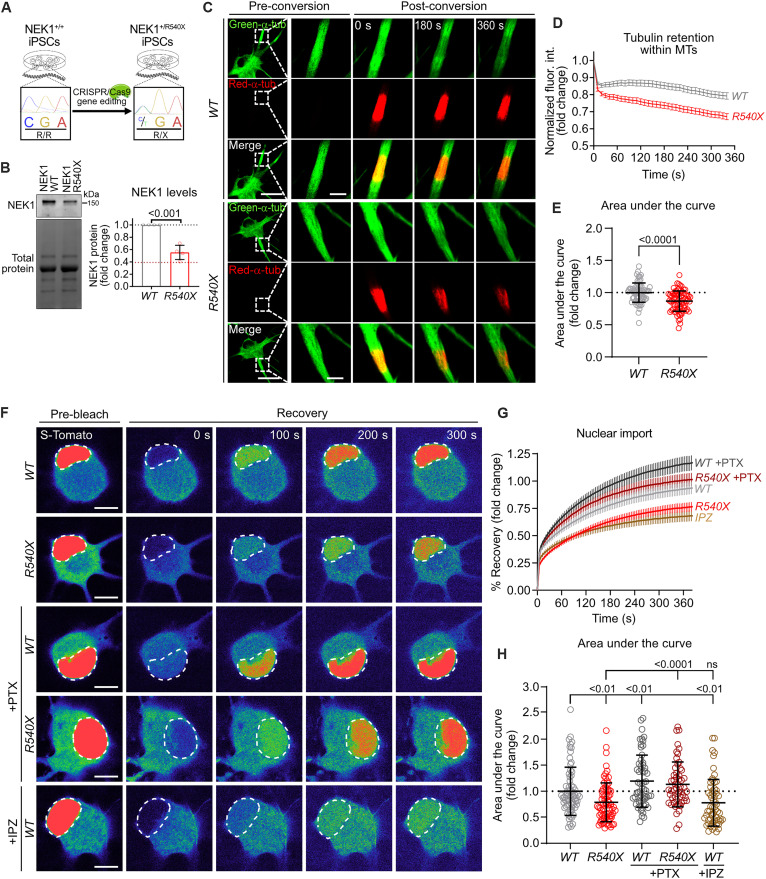
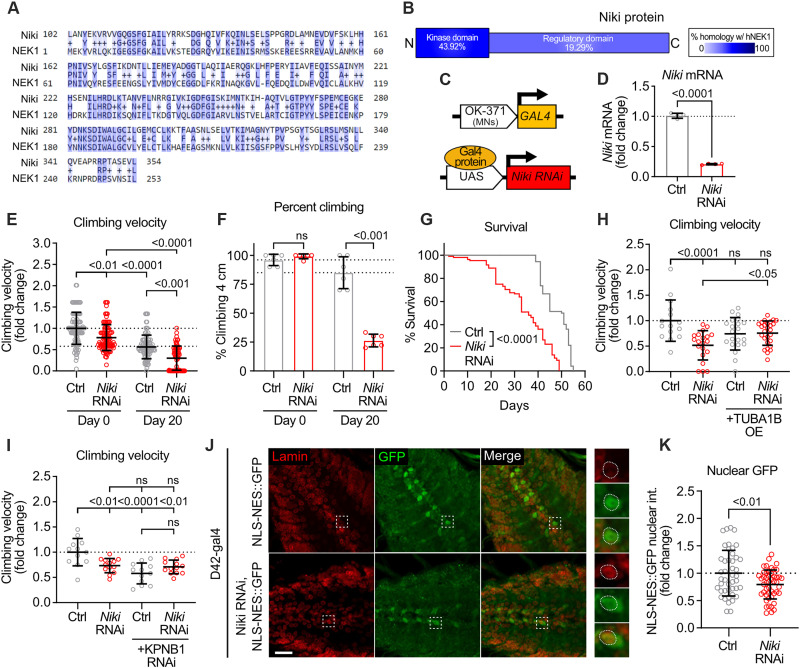
Loss-of-function variants in NIMA-related kinase 1 (NEK1) constitute a major genetic cause of amyotrophic lateral sclerosis (ALS), accounting for 2 to 3% of all cases. However, how NEK1 mutations cause motor neuron (MN) dysfunction is unknown. Using mass spectrometry analyses for NEK1 interactors and NEK1-dependent expression changes, we find functional enrichment for proteins involved in the microtubule cytoskeleton and nucleocytoplasmic transport. We show that α-tubulin and importin-β1, two key proteins involved in these processes, are phosphorylated by NEK1 in vitro. NEK1 is essential for motor control and survival in Drosophila models in vivo, while using several induced pluripotent stem cell (iPSC)-MN models, including NEK1 knockdown, kinase inhibition, and a patient mutation, we find evidence for disruptions in microtubule homeostasis and nuclear import. Notably, stabilizing microtubules with two distinct classes of drugs restored NEK1-dependent deficits in both pathways. The capacity of NEK1 to modulate these processes that are critically involved in ALS pathophysiology renders this kinase a formidable therapeutic candidate.


Figures

Fig. 1.
Fig. 1.. Proteomics analysis of NEK1 interactors and expression changes converges on MT homeostasis and N/C transport.
(A) NEK1 protein domain structure. Observed case-control NEK1 nonsense variants found in ALS cohorts are represented with asterisks (–12). The mutation used in this investigation is marked in red (R540X). (B) Experimental schematic used to identify NEK1 interactors by LC-MS/MS. (C) Identified NEK1 interactors grouped according to cellular function. (D) Experimental schematic used to identify differential protein expression upon NEK1 reduction in iPSC-MNs. (E) Left: Representative WB for NEK1 in siScr- and siNEK1-treated MN cultures. GAPDH was used as a loading control. Right: Fold change in NEK1 levels following siNEK1 treatment. Circles = individual samples; dotted line = mean NEK1 levels in siScr-treated MNs. n = 10 independent differentiations. (F) Volcano plot representing the fold change in expression level in siNEK1-treated versus siScr-treated MNs on the x axis and the statistical significance of the change (log10 of P value) on the y axis. Each circle represents a unique protein identified. Purple/blue circles = up-regulated proteins; red/orange circles = down-regulated proteins. Circle size and shade reflect the number of experiments where the protein was identified. Dashed red lines = P values of 0.05 and 0.1. (G) Enriched terms from ranked proteins shown in (F) using Gene Set Enrichment Analysis (GSEA) for biological process (top) and molecular function (bottom). Bars represent normalized enrichment scores for each term. Blue bars = up-regulated proteins; red bars = down-regulated proteins. Numbers within bars represent the number of up-regulated/down-regulated proteins in our dataset (numerator) out of all proteins denoted in each category (denominator). Q values are shown within individual bars. (H) Representative enrichment plots for the top enriched terms for up-regulated proteins (left) and down-regulated proteins (right) corresponding to the GSEA shown in (G). (I) Schematic representing the functional pathways highlighted based on LC-MS/MS experiments.
Fig. 2.
Fig. 2.. KPNB1 and TUBA1B interact with endogenous NEK1 in MNs and can undergo NEK1-mediated phosphorylation in vitro.
(A) Experimental schematic to confirm interaction between endogenous NEK1 and KPNB1/TUBA1B. Antibodies targeting KPNB1 or RFP were used in coimmunoprecipitation (Co-IP) from day 40 MN lysates differentiated from control (top) or endogenously tagged RFP-TUBA1B (bottom) iPSC lines. (B) Top: Representative WB using iPSC-MN lysates immunoprecipitated with IgG (control) or αKPNB1 and probed for NEK1. Bottom: Representative WB using RFP-TUBA1B iPSC-MN lysates immunoprecipitated with αSPOT beads (control) or αRFP beads and probed for NEK1. (C) Bar plots showing in vitro phosphorylation of recombinant KPNB1/TUBA1B, but not the control GST-His protein, by NEK1 as measured by ATP/ADP conversion. Buffer only reactions (left) consist of kinase reaction buffer with 100 ng of indicated substrate. +NEK1 reactions (middle) consist of kinase reaction buffer with 100 ng of indicated substrate and 10 ng of active NEK1. +NEK1 +inhibitor reactions (right) consist of kinase reaction buffer with 100 ng of indicated substrate, 10 ng of active NEK1, and 1 μM staurosporine. All conditions include 50 μM ATP. n = 3 reactions; bars represent mean ± SD, adjusted P values noted above comparisons.
Fig. 3.
Fig. 3.. Reduction of NEK1 levels in MNs disrupts MT homeostasis.
(A) Representative image of day 50 control MNs immunostained for NEK1 (green), MAP2 (red), and DAPI (blue). Scale bar, 20 μm. (B) Representative image of a day 32 control MN neurite cultured in a microfluidic device and immunostained for NEK1 (green) and α-tubulin (red). Scale bar, 20 μm. (C) Experimental schematic used to measure tubulin mobility in MN MTs. (D) Representative images showing tubulin mobility assay in siScr- and siNEK1-treated MNs. Dashed lines = inset region magnified in the right images. Scale bars, 25 μm and 5 μm (inset). (E) Persistence of photoconverted mEos3.2-TUBA1B fluorescence over time. n = 3 independent differentiations; data represented as mean ± SEM. (F) Fold change in the area under curve (AUC) from line plots shown in (C). Circles = individual cells; dotted line = mean AUC in control MNs. n = 4 independent differentiations. (G) Experimental schematic used to measure MT polymerization in proximal MN neurites. (H) Left: Representative time-lapse images of EB comets. Yellow arrow = EB comet. Right: Representative maximum intensity in time projections of total MT trajectories from EB1-GFP live imaging of MNs. Dashed lines = inset region magnified in the left images. Scale bars, 10 μm and 1 μm (inset). (I) Number of EB comets per minute in siScr- and siNEK1-treated MNs. Circles = individual cells. n = 3 independent differentiations. (J) Experimental schematic used to measure neurite regeneration following axotomy of MNs. (K) Representative images of siScr- and siNEK1-treated MN neurites 24 hours after axotomy immunostained for α-tubulin. Scale bar, 200 μm. (L) Fold change of individual neurite regrowth length of siScr- or siNEK1-treated (left) and vehicle- or 10 μM NEK1 inhibitor–treated (right) MNs. Data represented as median (bold) and quartiles (dashed) within plots. n = 3 to 4 independent differentiations. All individual P values are shown above comparisons. Data are represented as mean ± SD unless otherwise noted.
Fig. 4.
Fig. 4.. Reduction of NEK1 levels in MNs perturbs N/C transport.
(A) Representative images of siScr- and siNEK1-treated MNs immunolabeled for KPNB1 (green), MAP2 (red), and DAPI (blue). (B and C) Fold change of nuclear KPNB1 fluorescence intensity in siScr- and siNEK1-treated (B) or vehicle- and NEK1 inhibitor–treated (C) MNs. n = 3 independent differentiations. (D) Representative images of two control and two NEK1-ALS motor cortex sections immunolabeled for KPNB1 (green), MAP2 (red), and DAPI (blue). Colored box = KPNB1 localization pattern (nuclear = yellow, nuclear rim = orange, absent = white). (E) Percentage of MNs from each patient with the indicated KPNB1 localization. n = 35 to 61 neurons. (F) Fold change of nuclear KPNB1 fluorescence intensity in control and NEK1-ALS patient motor cortex MNs. n = 2 patients per disease condition. (G) Experimental schematic used to measure nuclear import dynamics in MNs by FRAP imaging of an NES-tdTomato-NLS reporter. (H) Representative images showing FRAP assay in siScr- and siNEK1-treated MNs. (I) Percent fluorescence recovery in the nucleus over time. n = 3 independent differentiations; data are represented as mean ± SEM. (J) Fold change in the AUC from line plots shown in (I). (K) Representative images of siScr- and siNEK1-treated MNs expressing the NES-tdTomato-NLS reporter (red) immunolabeled for MAP2 (green) and DAPI (blue). (L) Fold change in the N/C ratio of the NES-tdTomato-NLS reporter. n = 3 independent differentiations. (M) Representative images of siScr- and siNEK1-treated MNs immunolabeled for SAMHD1 (green), MAP2 (red), and DAPI (blue). (N) Fold change in the N/C ratio of SAMHD1. n = 3 independent differentiations. All individual P values are shown above comparisons. Data are represented as mean ± SD unless otherwise noted. For all plots, circles = individual neurons; dotted line = mean of control neurons. For all images, dashed lines = nucleus; dotted lines = soma. All scale bars = 10 μm.
Fig. 5.
Fig. 5.. MT stabilization restores nuclear import deficits in NEK1-depleted MNs.
(A) Schematic displaying the binding sites of the MT-stabilizing drugs paclitaxel (PTX) and laulimalide (Lau) on β-tubulin within MTs. (B) Representative WB following MT fractionation of vehicle-, PTX-, NDZ-, and Lau-treated iPSC-MN cultures showing soluble:polymerized α-tubulin and acetylated α-tubulin in the MT fraction. (C) Experimental schematic used to measure nuclear import levels in control or NEK1-depleted MNs. (D) Representative live images showing FRAP assay in siScr- and siNEK1-treated MNs following vehicle or PTX treatment. IPZ-treated MNs are included as a control. Dashed lines = photobleached region (nucleus). Scale bars, 10 μm. (E) Percent recovery of reporter fluorescence intensity in the photobleached region of the nucleus over time. n = 4 independent differentiations; data are represented as mean ± SEM. (F) Fold change in the AUC from the line plot shown in (E) in siScr- and siNEK1-treated MNs following vehicle, PTX, or IPZ treatment. Circles = individual cells; dotted line = mean AUC in control MNs. n = 4 independent differentiations. (G) Representative live confocal images showing FRAP assay in siScr- and siNEK1-treated MNs following vehicle or Lau treatment. IPZ-treated MNs are included as a control. Dashed lines mark the photobleached region (nucleus). Scale bars, 10 μm. (H) Percent recovery of reporter fluorescence intensity in the photobleached region of the nucleus over time. n = 3 independent differentiations; data are represented as mean ± SEM. (I) Fold change in the AUC from the line plot shown in (H) in siScr- and siNEK1-treated MNs following vehicle, Lau, or IPZ treatment. Circles = individual cells; dotted line = mean AUC in control MNs. n = 3 independent differentiations. All individual P values are shown above comparisons. Data are represented as mean ± SD unless otherwise noted.
Fig. 6.
Fig. 6.. MNs harboring the NEK1-ALS mutation R540X exhibit defects in MT homeostasis and N/C transport that can be rescued by PTX.
(A) Experimental schematic used to introduce p.R540X into a healthy control iPSC line by CRISPR/Cas9 gene editing. (B) Left: Representative WB for NEK1 in MNs derived from parental NEK1-WT and NEK1-R540X iPSC lines. Total protein was used as a loading control. Right: Fold change in NEK1 protein levels in WT and R540X MNs. Circles = biological replicates; gray dotted line = mean NEK1 levels in WT MNs; red dotted line = mean NEK1 fold change in siNEK1-treated MNs. n = 2 independent differentiations. (C) Representative confocal images showing tubulin mobility assay in WT and R540X MNs. Dashed lines = inset region magnified in the right time-course images. Scale bars, 25 μm and 5 μm (inset). (D) Persistence of photoconverted mEos3.2-TUBA1B fluorescence over time. n = 3 independent differentiations; data are represented as mean ± SEM. (E) Fold change in the AUC from the line plot shown in (D) in WT and R540X MNs. Circles = individual cells; dotted line = mean AUC in WT MNs. n = 3 independent differentiations. (F) Representative confocal images showing nuclear import FRAP assay in WT and R540X MNs following vehicle or PTX treatment. IPZ-treated WT MNs are included as a control. Dashed lines = photobleached region (nucleus). Scale bars, 10 μm. (G) Percent recovery of reporter fluorescence intensity in the photobleached region of the nucleus over time. n = 3 independent differentiations; data are represented as mean ± SEM. (H) Fold change in the AUC from line plot shown in (G). Circles = individual cells; dotted line = mean AUC in WT MNs. n = 3 independent differentiations. All individual P values are shown above comparisons. Data are represented as mean ± SD unless otherwise noted.
Fig. 7.
Fig. 7.. Reduction of the NEK1 homolog Niki causes motor dysfunction and reduced life span in vivo.
(A) Alignment of Niki (Drosophila) and NEK1 (human) amino acids. Dark blue = conservation of amino acid, light blue = conservation of amino acid properties. (B) Homology between Niki and human NEK1 in the kinase domain and the regulatory domain. (C) Schematic showing genetic paradigm for Niki RNAi flies. (D) Fold change of Niki mRNA in control and Niki RNAi flies. n = 4 independent experiments. (E) Fold change in climbing velocity (cm/s) of control and Niki RNAi flies on days 1 and 20. n = 69 to 105 flies. (F) Fold change in the percent flies climbing 4 cm in 20 s in control and Niki RNAi flies on days 1 and 20. n = 6 experiments. (G) Kaplan-Meier survival curve of control flies and Niki RNAi flies. n = 70 to 80 flies. (H) Fold change in climbing velocity (cm/s) in control and Niki RNAi flies (left) compared to control and Niki RNAi flies crossed with TUBA1B-overexpressing flies (right) on day 20. n = 15 to 27 flies. (I) Fold change in climbing velocity (cm/s) in control and Niki RNAi flies (left) compared to control and Niki RNAi flies crossed with KPNB1 RNAi flies (right) on day 20. n = 12 to 13 flies. (J) Representative images of Drosophila larval brain of control and Niki RNAi flies crossed with flies expressing an NLS-NES-GFP reporter (D42-gal4 MN driver) immunostained for Lamin (red) and GFP (green). Dashed box = magnified region shown in right inset images. Dashed circles = nucleus. Scale bar, 20 μm. (K) Fold change in nuclear intensity of the NLS-NES-GFP reporter in control and Niki RNAi flies. n = 44 to 48 cells from 3 to 5 larvae. All individual P values are shown above comparisons. Data are represented as mean ± SD unless otherwise noted. For all plots, circles = individual flies or biological replicates; dotted line = mean of control flies.

Similar articles

Cited by

References

    1. R. H. Brown, A. Al-Chalabi, Amyotrophic lateral sclerosis. N. Engl. J. Med. 377, 162–172 (2017). - PubMed
    1. A. E. Renton, A. Chio, B. J. Traynor, State of play in amyotrophic lateral sclerosis genetics. Nat. Neurosci. 17, 17–23 (2014). - PMC - PubMed
    1. R. Chia, A. Chio, B. J. Traynor, Novel genes associated with amyotrophic lateral sclerosis: Diagnostic and clinical implications. Lancet Neurol. 17, 94–102 (2018). - PMC - PubMed
    1. C. Cook, L. Petrucelli, Genetic convergence brings clarity to the enigmatic red line in ALS. Neuron 101, 1057–1069 (2019). - PubMed
    1. M. J. Castellanos-Montiel, M. Chaineau, T. M. Durcan, The neglected genes of ALS: Cytoskeletal dynamics impact synaptic degeneration in ALS. Front. Cell. Neurosci. 14, 594975 (2020). - PMC - PubMed