Review
. 2023 Aug;36(4):210-227.
doi: 10.1089/jamp.2023.29086.jgv.

Measuring Anatomical Distributions of Ventilation and Aerosol Deposition with PET-CT

Affiliations
Review

Measuring Anatomical Distributions of Ventilation and Aerosol Deposition with PET-CT

Jose G Venegas. J Aerosol Med Pulm Drug Deliv. 2023 Aug.

Abstract

In disease, lung function and structure are heterogeneous, and aerosol transport and local deposition vary significantly among parts of the lung. Understanding such heterogeneity is relevant to aerosol medicine and for quantifying mucociliary clearance from different parts of the lung. In this chapter, we describe positron emission tomography (PET) imaging methods to quantitatively assess the deposition of aerosol and ventilation distribution within the lung. The anatomical information from computed tomography (CT) combined with the PET-deposition data allows estimates of airway surface concentration and peripheral tissue dosing in bronchoconstricted asthmatic subjects. A theoretical framework is formulated to quantify the effects of heterogeneous ventilation, uneven aerosol ventilation distribution in bifurcations, and varying escape from individual airways along a path of the airway tree. The framework is applied to imaging data from bronchoconstricted asthmatics to assess the contributions of these factors to the unevenness in lobar deposition. Results from this analysis show that the heterogeneity of ventilation contributes on average to more than one-third of the variability in interlobar deposition. Actual contribution of ventilation in individual lungs was variable and dependent on the breathing rate used by the subject during aerosol inhalation; the highest contribution was in patients breathing slowly. In subjects breathing faster, contribution of ventilation was reduced, with more expanded lobes showing lower deposition per unit ventilation than less expanded ones in these subjects. The lobar change in expansion measured from two static CT scans, which is commonly used as a surrogate for ventilation, did not correlate with aerosol deposition or with PET-measured ventilation. This suggests that dynamic information is needed to provide proper estimates of ventilation for asthmatic subjects. We hope that the enhanced understanding of the causes of heterogeneity in airway and tissue dosing using the tools presented here will help to optimize therapeutic effectiveness of inhalation therapy while minimizing toxicity.

Keywords: aerosol deposition; anatomic distribution; bifurcation factor; escape fraction; heterogeneity; inhaled therapeutics; lobar deposition.


Conflict of interest statement

The author, employed by the Massachusetts General Hospital, Boston, Massachusetts, USA, received financial support from Air Liquide Santé International.

Figures

FIG. 1.
FIG. 1.
Lung volume display during PET-CT imaging. A signal of dynamic lung volume is obtained with an impedance plethysmograph and displayed in real time on the screen of a laptop and presented to the subject on video display goggles. The computer calculates the average lung volume during breathing and displays a line on the screen to guide the subject to stop breathing at that volume during the CT scan. In this manner, the high resolution CT data is collected at a volume equivalent to the average lung volume during breathing and thus is similar to that during the acquisition of the PET imaging scan.
FIG. 2.
FIG. 2.
Front view and details of a 3 generation apparatus for labeling, processing and injecting Nitrogen-13 in saline solution SALSA-3G. The system is based on a modern Stellant® MedRad® injector and, under computer control, purifies the gas sent by a cyclotron, mixes it with degassed saline, and after quality control and radiation measuring steps, it injects it into the patient. From reference.
FIG. 3.
FIG. 3.
Measurements of regional blood flow (Q), specific alveolar ventilation sV˙A and sV˙AQ˙ ratio by PET following a bolus injection of N-N2-saline solution. The plot presents the regional concentration of N-N2 over time. The bolus is initially injected intravenously during a short breath-hold, and as it reaches the alveolar capillary bed, it diffuses into the alveolar gas where it remains at a plateau level (Ao) that is proportional to regional Q˙. As ventilation is restarted, the tracer washes out of the lung at a constant washout rate (if uniform sV˙AQ˙ within the region). The integral of the activity over time during the washout period is proportional to Q˙sV˙A. From reference.
FIG. 4.
FIG. 4.
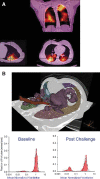
(A) Three-dimensional imaging data merging the residual Nitrogen-13 gas concentration after a washout period of 5 minutes collected with PET and the high-resolution structure obtained with CT. Because the PET imaging field is limited to 20 cm, the PET data does not include the most caudal part of the lung. Color code for the PET scan is yellow for the highest tracer concentration and black for the lowest concentration. Note the patchy distribution of tracer residual demonstrating large regions of the lung with very low ventilation surrounded by well-ventilated lung. From reference. (B) The regional distribution of ventilation in bronchoconstricted lungs is patchy and bimodal. The top figure is 3D rendering of the chest wall (gray), airways (brown) and ventilation defects (magenta). The bottom plots are distributions of mean-normalized ventilation of a subject with asthma at baseline (left) and after Mch Challenge (right). Note that both at baseline and post-challenge, the distributions are bimodal. At baseline, there is a small fraction of voxels ventilated with less than one tenth of the ventilation in the rest of the lung. Post-Mch, the fraction of hypoventilated voxels is substantially increased (greater area under the low ventilation mode).
FIG. 5.
FIG. 5.
3D renderings of the central airways tree and surrounding lung. Figures show the anatomical location of two sublobar segments (A) and the distribution of N-NH3 labeled aerosol (B) in a bronchoconstricted asthmatic subject. The peripheral deposition of the aerosol is seen as the red cloud following the direction of the airways. From reference.
FIG. 6.
FIG. 6.
Integrating analysis of PET and CT has several challenges: 1) Deposition is imaged during breathing and can take between 10 to 20 minutes depending on the isotope used; 2) To avoid gross miss-registrations, CT needs to be acquired at the same lung volume than the average lung volume during deposition imaging; 3) PET has lower spatial resolution than CT and thus aerosol deposition images look blurred: activity within the airways appears outside them in the 3D images.
FIG. 7.
FIG. 7.
(A) In an attempt to capture all activity deposited on the moving airways, a central “mask” is created by expanding the CT-rendered airway tree to cover surrounding regions. A “peripheral” mask is defined as the rest of the lung field outside of the central mask. (B) Figure showing the 3D rendering of central and peripheral black or white ROI's.
FIG. 8.
FIG. 8.
A voxel influence matrix (VIM) describes how activity originating from one of the ARs within the imaged field is sampled in each image voxel. In this figure, VIMs are shown in different colors for lobar peripheral regions and central airways. From reference.
FIG. 9.
FIG. 9.
Image processing involves segmentation of the CT scans to define anatomic regions (AR). In this case 5 lobar and 9 central airways. Common airway bifurcation points of the segmented airway trees from 2 CT scans, collected at mean lung volume(MLV) and total lung capacity (TLC), are used to define a mathematical (AFINE) transformation between both images. Such transformation is applied to map the TLC tree onto the MLV tree and to model the blurring of the airways caused by breathing, limited spatial resolution and uncertainty. Such a model is used to define either BW ROI's or Gray-scale VIMS that at in turn are used to assign the specific activity to each AR to best describe the measured PET scan. From reference.
FIG. 10.
FIG. 10.
(A) Images are projections of PET images of aerosol deposition from 3 subjects (left) and synthetic images generated using the BW (center) and Grayscale methods (right). Note that discrepancies between original and synthetic image indicate loss of information in the description of the data. (B) The coefficient of determination R2 of the Grayscale method was higher than the BW method for all subjects (P < 0.0001) (right plot). From reference.
FIG. 11.
FIG. 11.
Plots of mean-normalized tissue dozing (TD), and inner surface concentration (ISC) estimated across lobes for nine individual subjects (data for each subject are connected with dashed lines. The solid line is the average lobar values). No statistical difference was observed in average TD between lobes. However, the LLL showed lower ISC than the lobes of the right lung (the strength of the line between the lobes under STATS indicates the strength of the P values). From reference.
FIG. 12.
FIG. 12.
Changes in average aerosol concentration at each bifurcation and along each airway k, can be characterized by two transition parameters; Bk that captures the change in concentration at the inlet of the airway as the ratio of Cparent k, out/Cairway k, in, and Ek that captures the change in concentration along an airway as a ratio of Cairway k, in and Cairway k, out. From reference.
FIG. 13.
FIG. 13.
Imaging protocol sequence. From reference.
FIG. 14.
FIG. 14.
Relationship between lobar specific deposition vs. specific ventilation for 12 individual subjects, organized by strength of the correlation. The breathing frequency during nebulization in breaths per minute is also shown in each figure caption. From reference.
FIG. 15.
FIG. 15.
Reduction of the variation among lobes as sources of variance are incrementally removed. Lobar values for each subject are connected with thin lines, and the thick solid line connects average values. Left: relative specific deposition sD*, Center: relative deposition per unit of relative ventilation (sD*/sV*), Right: apparent escape fraction. Statistically significant differences between any two lobes are depicted as a line connecting the lobes in the inset above each plot (solid is P < 0.001, dashed is P < 0.01, and dotted is P < 0.05). The absence of a line indicates no statistical difference.From reference.
FIG. 16.
FIG. 16.
The strength of the correlation between lobar inflation, FVOL, and the specific deposition per unit of specific ventilation, sD*/sV*, was strongly modulated by the breathing frequency during aerosol inhalation. Correlation strength changed from strongly positive in subjects that inhaled with low breathing frequencies to strongly negative in the subjects breathing fast during aerosol inhalation.From reference.

Similar articles

Cited by

References

    1. Venegas J, Winkler T, Harris RS. Lung physiology and aerosol deposition imaged with positron emission tomography. J Aerosol Med Pulm Drug Deliv 2013;26(1):1–8. - PubMed
    1. Brownell GL, Burnham CA, Chesler DA, et al. . PCR-I high resolution positron tomograph using analog coding. IEEE Trans Med Imaging 1984;3(1):10–17. - PubMed
    1. Walters TE, Simon W, Chesler DA, et al. . Attenuation correction in gamma emission computed tomography. J Comput Assist Tomogr 1981;5(1):89–94. - PubMed
    1. Green M V, Seidel J, Vaquero JJ, et al. . High resolution PET, SPECT and projection imaging in small animals. Comput Med Imaging Graph 2001;25(2):79–86. - PubMed
    1. Musch G, Layfield JDH, Harris RS, et al. . Topographical distribution of pulmonary perfusion and ventilation, assessed by PET in supine and prone humans. J Appl Physiol 2002;93(5):1841–1851. - PubMed

Publication types

MeSH terms