. 2023 Oct:66:102846.
doi: 10.1016/j.redox.2023.102846. Epub 2023 Aug 9.

Metabolic reprogramming in inflammatory microglia indicates a potential way of targeting inflammation in Alzheimer's disease

Affiliations

Metabolic reprogramming in inflammatory microglia indicates a potential way of targeting inflammation in Alzheimer's disease

Moris Sangineto et al. Redox Biol. 2023 Oct.

Abstract

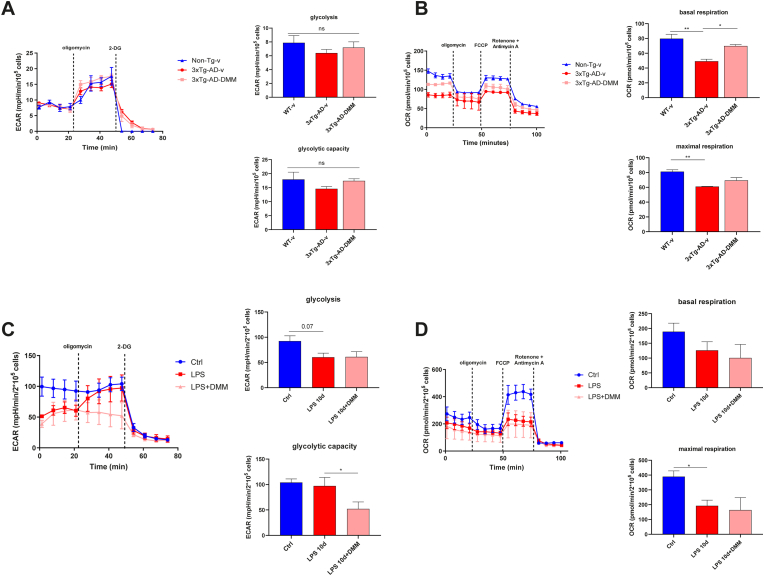
Microglia activation drives the pro-inflammatory activity in the early stages of Alzheimer's disease (AD). However, the mechanistic basis is elusive, and the hypothesis of targeting microglia to prevent AD onset is little explored. Here, we demonstrated that upon LPS exposure, microglia shift towards an energetic phenotype characterised by high glycolysis and high mitochondrial respiration with dysfunction. Although the activity of electron transport chain (ETC) complexes is boosted by LPS, this is mostly devoted to the generation of reactive oxygen species. We showed that by inhibiting succinate dehydrogenase (SDH) with dimethyl malonate (DMM), it is possible to modulate the LPS-induced metabolic rewiring, facilitating an anti-inflammatory phenotype. DMM improves mitochondrial function in a direct way and by reducing LPS-induced mitochondrial biogenesis. Moreover, the block of SDH with DMM inhibits the recruitment of hypoxia inducible-factor 1 α (HIF-1α), which mediates the induction of glycolysis and cytokine expression. Similar bioenergetic alterations were observed in the microglia isolated from AD mice (3xTg-AD), which present high levels of circulating LPS and brain toll-like receptor4 (TLR4). Moreover, this well-established model of AD was used to show a potential effect of SDH inhibition in vivo as DMM administration abrogated brain inflammation and modulated the microglia metabolic alterations of 3xTg-AD mice. The RNA-sequencing analysis from a public dataset confirmed the consistent transcription of genes encoding for ETC subunits in the microglia of AD mice (5xFAD). In conclusion, TLR4 activation promotes metabolic changes and the pro-inflammatory activity in microglia, and SDH might represent a promising therapeutic target to prevent AD development.

Keywords: 3xTg-AD mice; Alzheimer's disease; Bioenergetics; Dimethyl malonate; Immunometabolism; Macrophage; Microglia.


Conflict of interest statement

Declaration of competing interest The authors declare that they have no known competing financial interests or personal relationships that could have appeared to influence the work reported in this paper.

Figures

Image 1
Graphical abstract
Fig. 1
Fig. 1
SDH inhibition with DMM controls LPS-induced metabolic rewiring (A and B) Relative mRNA expression of pro-inflammatory cytokines (IL-1β and TNF-α) and M1, M2 macrophage markers (iNOS, Arg1 and iNOS/Arg1 ratio) in HMC3 treated with LPS (1 μg/mL) and DMM (10 mM) for 24 h determined by qPCR (n= 5 experiments performed in triplicate). (C–E) Glycolysis determined by measuring ECAR and (F–I) mitochondrial respiration determined by measuring OCR in HMC3 treated with LPS (1 μg/mL) and DMM (10 mM) for 24 h (n= 4 experiments performed in quadruplicate). (J) Relative mRNA expression of pro-inflammatory cytokines (IL-1β and TNF-α) and (K) TLR4 tag, MyD88 in HMC3 pre-treated with TAK-242 (1 μM) for 1 h prior to LPS stimulation (1 μg/mL) for 24 h or treated with simple TAK-242 (1 μM) and LPS (1 μg/mL) for 24 h determined by qPCR (n= 5 experiments performed in triplicate). (L) Glycolysis determined by measuring ECAR and (M) mitochondrial respiration determined by measuring OCR in HMC3 pre-treated with TAK-242 (1 μM) for 1 h prior to LPS stimulation (1 μg/mL) for 24 h or treated with simple TAK-242 (1 μM) and LPS (1 μg/mL) for 24 h (n= 4 experiments performed in quadruplicate). Data are expressed in mean ± SEM; *p < 0.05; **p < 0.01; ***p < 0.001, ****p < 0.0001 according to one-Way ANOVA followed by post hoc analysis (Bonferroni test). Il-1β, interleukin-1β; TNF-α, tumor necrosis factor-α; iNOS, inducible nitric oxide synthase; Arg1, arginase1; MyD88, MYD88 innate immune signal transduction adaptor; LPS, lipopolysaccharide; DMM, dimethyl malonate; ECAR, extracellular acidification rate; OCR, oxygen consumption rate.
Fig. 2
Fig. 2
SDH inhibition with DMM reduces mitochondrial dysfunction and oxidative stress (A) Relative mRNA expression of pro-inflammatory cytokines (IL-1β and TNF-α) in HMC3 treated with LPS (1 μg/mL) and DMM (10 mM) and with increasing concentrations of glucose (3 g/L, 7 g/L, 10 g/L) and H2O2 (100 μM, 200 μM, 500 μM) for 24 h determined by qPCR (n= 3 experiments performed in triplicate). (B) Respiratory chain Complexes I, II, V enzymatic activity determined spectrofotometrically in HMC3 after 24 h treatment with LPS (1 μg/mL) and DMM (10 mM) (n= 3 experiments performed in triplicate). (C) Peroxide production from pyruvate/malate (complex I-III) and succinate (complex II-III), in HMC3 after 24 h treatment with LPS (1 μg/mL) and DMM (10 mM) (n= 3 experiments performed in triplicate). (D) Mitochondrial levels of MDA- and HNE-protein adducts in HMC3 after 24 h treatment with LPS (1 μg/mL) and DMM (10 mM) (n= 3 experiments performed in triplicate). Data are expressed in mean ± SEM; *p < 0.05; **p < 0.01; ***p < 0.001, ****p < 0.0001 according to one-Way ANOVA followed by post hoc analysis (Bonferroni test). Il-1β, interleukin-1β; TNF-α, tumor necrosis factor-α; LPS, lipopolysaccharide; DMM, dimethyl malonate; MDA, malondialdehyde; HNE, 4-hydroxynonenal.
Fig. 3
Fig. 3
SDH inhibition limits the LPS-induced mitochondrial biogenesis (A and B) Relative mRNA expression of markers of mitochondrial biogenesis (TFAM and PGC1-α) and (C) different mitochondrial complexes subunits (NDUFA1, NDUFA8, NDUFB3, SDHB, COX4I1, COX5B, COX6A1, ATP5G2) in HMC3 treated with LPS (1 μg/mL) and DMM (10 mM) for 24 h determined by qPCR (n= 3 experiments performed in triplicate). Data are expressed in mean ± SEM; *p < 0.05; **p < 0.01; ***p < 0.001, according to one-Way ANOVA followed by post hoc analysis (Bonferroni test). TFAM, Transcription Factor A, Mitochondrial; PGC-1 α, Peroxisome proliferator–activated receptor gamma coactivator-1 alpha; LPS, lipopolysaccharide; DMM, dimethyl malonate; NDUFA1, NADH:ubiquinone oxidoreductase subunit A1; NDUFA8, NADH:ubiquinone oxidoreductase subunit A8; NDUFB3, NADH:ubiquinone oxidoreductase subunit B3; SDHB, Succinate dehydrogenase complex iron sulfur subunit B; COX4I1, Cytochrome c oxidase subunit 4I1; COX5B, Cytochrome c oxidase subunit 5B, COX6A1, Cytochrome c oxidase subunit 6A1; ATP5G2, ATP synthase membrane subunit c locus 2.
Fig. 4
Fig. 4
HIF-1α is induced by SDH and partially mediates glycolysis enhancement and cytokine expression (A) Representative pictures of protein levels of β-actin and HIF-1α determined by western blot analysis. HMC3 cells were treated for 24 h with LPS (1 μg/mL) +/- DMM (10 mM). (B) Relative mRNA expression of IL-1β and TNF-α in HMC3 treated with LPS (1 μg/mL), DMM (10 mM), and HIF-1α inhibitor (PX-478) (10 μM) for 24 h, determined by qPCR (n= 3 experiments performed in triplicate). (C) Glycolysis and glycolytic capacity determined by measuring ECAR in HMC3 treated with LPS, and PX-478 for 24h (n= 3 experiments performed in quadruplicate). (D) Representative pictures of protein levels of β-actin and HIF-1α determined by western blot analysis. HMC3 were pretreated for 3 h with diethyl succinate (5 mM) prior to stimulation with LPS (1 μg/mL) +/- DMM (10 mM) for 24 h. Data are expressed in mean ± SEM; **p < 0.01; ***p < 0.001, ****p < 0.0001 according to one-Way ANOVA followed by post hoc analysis (Bonferroni test). Il-1β, interleukin-1β; TNF-α, tumor necrosis factor-α; HIF-1α, hypoxia-Inducible factor-α; LPS, lipopolysaccharide; ECAR, extracellular acidification rate; Succ, diethyl succinate.
Fig. 5
Fig. 5
Effects in vivo of SDH inhibition with DMM in 6-month-aged 3xTg-AD mice (A) Representative pictures and quantification of TLR4 staining in cerebral cortices of Non-Tg and 3xTg-AD mice determined by immunohistochemistry (n= 4 per group). (B) Quantification of endotoxin (LPS) concentration in serum of Non-Tg and 3xTg-AD mice determined by using the Pierce™ Chromogenic Endotoxin Quant Kit (Thermo Fisher scientific) (n= 4 per group). (C) Experimental design. (D) Relative mRNA expression of Il-1β and TNF-α and iNOS/Arg1 ratio in cerebral cortices of 6-mo Non-Tg and 3xTg-AD mice intraperitoneally injected with vehicle (PBS) or DMM (160 mg/kg) for three days, and determined by qPCR (Non-Tg groups: n = 4; 3xTg-AD groups: n = 5). (E) Glycolysis and glycolytic capacity determined by measuring ECAR (Non-Tg groups: n= 4; 3xTg-AD groups: n = 6; each measurement performed in triplicate) and (F) mitochondrial respiration (basal, maximal and proton leak) determined by measuring OCR (Non-Tg groups: n= 3; 3xTg-AD: n = 4; each measurement performed in triplicate) in primary microglia cells isolated from 6-mo Non-Tg and 3xTg-AD mice intraperitoneally injected with vehicle (PBS) or DMM (160 mg/kg) for three days. Data are expressed in mean ± SEM; *p < 0.05; **p < 0.01; ***p < 0.001, ****p < 0.0001 according to one-Way ANOVA followed by post hoc analysis (Bonferroni test). TLR4, toll-like receptor 4; Il-1β, interleukin-1β; TNF-α, tumor necrosis factor-α; iNOS, inducible nitric oxide synthase; Arg1, arginase1; ECAR, extracellular acidification rate; OCR, oxygen consumption rate; DMM, dimethyl malonate.
Fig. 6
Fig. 6
Transcriptomic profile of microglia (WT vs 5xFAD mice) from public RNA-seq dataset (A) Volcano Plot. (B–D) Top 20 terms from GO enrichment analysis of up-regulated genes, expressed in -Log10(p-value), for the three categories Cellular Component (CC), Molecular Function (MF) and Biological Process (BP). The analysis has been performed by downloaded public RNA-seq data (GSE231403; https://www.ncbi.nlm.nih.gov/geo/query/acc.cgi?acc=GSE231403), comparing transcriptomic profile of microglia from 3 WT mice vs 3 5xFAD mice.
Fig. 7
Fig. 7
Bioenergetic alterations in microglia of 18 month-aged 3xTg-AD mice and HMC3 after long-lasting LPS exposure (A) Glycolysis and glycolytic capacity determined by measuring ECAR (Non-Tg group: n= 4; 3xTg-AD groups: n = 6; each measurement performed in triplicate) and (B) mitochondrial respiration (basal, maximal and proton leak) determined by measuring OCR (Non-Tg group: n= 3; 3xTg-AD groups: n = 4; each measurement performed in triplicate) in primary microglia isolated from 18-mo Non-Tg and 3xTg-AD mice intraperitoneally injected with vehicle (PBS) or DMM (160 mg/kg) for three days (C) Glycolysis and glycolytic capacity determined by measuring ECAR and (D) mitochondrial respiration (basal, maximal and proton leak) determined by measuring OCR in HMC3 cells treated with LPS (1 μg/mL) for 10 days ± DMM (10 mM) added the last 24h only (n = 3 per group; each measurement performed in quadruplicate). Data are expressed in mean ± SEM; *p < 0.05; **p < 0.01; ***p < 0.001, according to one-Way ANOVA followed by post hoc analysis (Bonferroni test).

References

    1. Mucke L. Neuroscience: Alzheimer's disease. Nature. 2009;461:895–897. - PubMed
    1. Kwon H.S., Koh S.H. Neuroinflammation in neurodegenerative disorders: the roles of microglia and astrocytes. Transl. Neurodegener. 2020;9:42. - PMC - PubMed
    1. Yang J., Wise L., Fukuchi K.I. TLR4 cross-talk with NLRP3 inflammasome and complement signaling pathways in Alzheimer's disease. Front. Immunol. 2020;11:724. - PMC - PubMed
    1. Calvo-Rodriguez M., Garcia-Rodriguez C., Villalobos C., et al. Role of toll like receptor 4 in Alzheimer's disease. Front. Immunol. 2020;11:1588. - PMC - PubMed
    1. d'Errico P., Ziegler-Waldkirch S., Aires V., et al. Microglia contribute to the propagation of Abeta into unaffected brain tissue. Nat. Neurosci. 2022;25:20–25. - PMC - PubMed

Publication types

LinkOut - more resources