Clinical Trial
. 2023 Aug 15;4(8):101133.
doi: 10.1016/j.xcrm.2023.101133.

Phase 1 clinical trial to assess safety and efficacy of NY-ESO-1-specific TCR T cells in HLA-A∗02:01 patients with advanced soft tissue sarcoma

Affiliations
Clinical Trial

Phase 1 clinical trial to assess safety and efficacy of NY-ESO-1-specific TCR T cells in HLA-A∗02:01 patients with advanced soft tissue sarcoma

Qiuzhong Pan et al. Cell Rep Med. .

Abstract

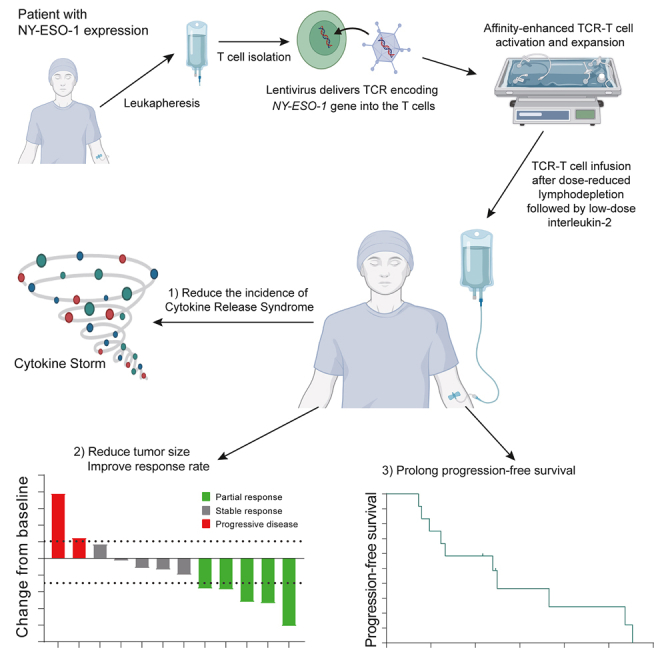
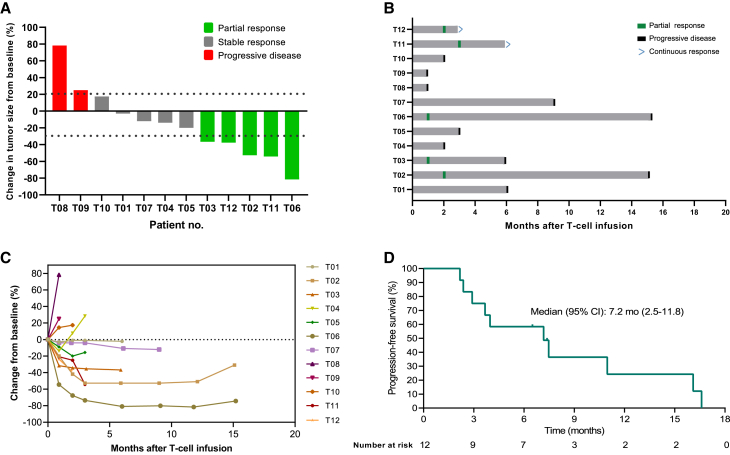
New York esophageal squamous cell carcinoma-1 (NY-ESO-1)-specific T cell receptor (TCR) T cell therapy is effective in tumors with NY-ESO-1 expression, but a safe and effective TCR-T cell therapeutic protocol remains to be improved. Here, we report a phase 1 investigational new drug clinical trial with TCR affinity-enhanced specific T cell therapy (TAEST16001) for targeting NY-ESO-1. Enrolled patients receive TAEST16001 cell infusion after dose-reduced lymphodepletion with cyclophosphamide (15 mg/kg/day × 3 days) combined with fludarabine (20 mg/m2/day × 3 days), and the TCR-T cells are maintained with low doses of interleukin-2 injection post-adoptive transfer. Analysis of 12 patients treated with the regimen demonstrates no treatment-related serious adverse events. The overall response rate is 41.7%. The median progression-free survival is 7.2 months, and the median duration of response is 13.1 months. The protocol of TAEST16001 cells delivers a safe and highly effective treatment for patients with advanced soft tissue sarcoma (ClinicalTrials.gov: NCT04318964).


Conflict of interest statement

Declaration of interests Z.H., Y.O., L.Z., H.G., A.C., J.C., S.Z., Y. Lin, Y. Li, and K.M. are employees of Xiangxue Life Science Technology (Guangdong) Co., Ltd.

Figures

None
Graphical abstract
Figure 1
Figure 1
Clinical response and progression-free survival outcomes in 12 patients who were treated with TAEST16001 cells (A) Waterfall plot of the best clinical response for each evaluable patient. (B) Swimlane plot shows clinical outcomes of treated patients. (C) Spider plot shows the change in the sum of the diameters of each patient’s target lesions over time. (D) Kaplan-Meier estimates of the progression-free survival. Tick marks indicate the time of data censoring at their last date of contact.
Figure 2
Figure 2
Computed tomography (CT) scans demonstrating tumor regression (A) CT scans from patient T06, who had large synovial sarcoma in the right arm with numerous lung metastatic lesions. (B) CT scans from patient T02, who had recurrent myxoliposarcoma in the right leg. Red arrows and ellipse point to tumors.
Figure 3
Figure 3
Peak TCR-engineered T cell expansion and association with response (A) TCR copies as measured by vector transgene copies per μg genomic DNA in peripheral blood, according to clinical response. LLOQ, lower limit of quantitation. (B) Peak TCR-engineered T cells levels by dose level. (C) Association between peak TCR-engineered T cell expansion and the occurrence of tumor response. The horizontal lines within each box represent the median, the lower and upper borders of each box represent the interquartile range, and the bars show the range.
Figure 4
Figure 4
Phenotypic evolution of TAEST16001 cells and their correlation with the peak of TCR gene copies per μg gDNA after cell infusion (A) The compositional evolution of TAEST16001 cell pool in peripheral blood. Naive T (TN; CD45ROCCR7+) cells, central memory T (TCM; CD45RO+CCR7+) cells, effector memory T (TEM; CD45RO+CCR7) cells, and terminally differentiated effector T (TTE; CD45ROCCR7) cells were detected by flow cytometry in the manufactured product (MP) and at the time points indicated in each graph. The horizontal lines within each box represent the median, the lower and upper borders of each box represent the interquartile range, and the bars show the range. We calculated the p values using the Kruskal-Wallis (KW) test. ∗p < 0.05. (B) Flow cytometry of tetramer-binding TAEST 16001 cells expressing CD45RO and CCR7 from patient T02 within the manufactured cell product (MP) and at the time points indicated in each graph after cell infusion. TN cells, TCM cells, TEM cells, and TTE cells were detected by flow cytometry. (C) Correlation between frequencies of T cell subsets in the MP and the peak of TCR gene copies per μg gDNA after cell infusion. Spearman correlation analysis of the peak of TCR gene copies per μg gDNA after cell infusion and the frequencies of, TCM (CD45RO+CCR7+) cells, TEM (CD45RO+CCR7) cells, TN (CD45ROCCR7+) cells, and TTE(CD45ROCCR7) cells in TAEST16001 cell product.
Figure 5
Figure 5
Associations between peak values of inflammatory cytokines and tumor response (A–G) Relationship between (A) post-infusion interleukin-2 (IL-2) peak and treatment response; (B) post-infusion IL-6 peak and treatment response; (C) post-infusion IL-10 peak and treatment response; (D) post-infusion interferon-γ (IFN-γ) peak and treatment response; (E) post-infusion serum amyloid A (SAA) peak and treatment response; (F) post-infusion C-reactive protein (CRP) peak and treatment response; and (G) post-infusion ferritin peak and treatment response. Data are presented as mean ± SD. We calculated the p values using the two-sided Wilcoxon rank-sum test.

References

    1. von Mehren M., Randall R.L., Benjamin R.S., Boles S., Bui M.M., Ganjoo K.N., George S., Gonzalez R.J., Heslin M.J., Kane J.M., et al. Soft Tissue Sarcoma, Version 2.2018, NCCN Clinical Practice Guidelines in Oncology. J. Natl. Compr. Cancer Netw. 2018;16:536–563. doi: 10.6004/jnccn.2018.0025. - DOI - PubMed
    1. Li R.H., Zhou Q., Li A.B., Zhang H.Z., Lin Z.Q. A nomogram to predict metastasis of soft tissue sarcoma of the extremities. Medicine. 2020;99 doi: 10.1097/MD.0000000000020165. - DOI - PMC - PubMed
    1. Sleijfer S., Ouali M., van Glabbeke M., Krarup-Hansen A., Rodenhuis S., Le Cesne A., Hogendoorn P.C.W., Verweij J., Blay J.Y. Prognostic and predictive factors for outcome to first-line ifosfamide-containing chemotherapy for adult patients with advanced soft tissue sarcomas: an exploratory, retrospective analysis on large series from the European Organization for Research and Treatment of Cancer-Soft Tissue and Bone Sarcoma Group (EORTC-STBSG) Eur. J. Cancer. 2010;46:72–83. doi: 10.1016/j.ejca.2009.09.022. - DOI - PubMed
    1. Gronchi A., Miah A.B., Dei Tos A.P., Abecassis N., Bajpai J., Bauer S., Biagini R., Bielack S., Blay J.Y., Bolle S., et al. Soft tissue and visceral sarcomas: ESMO-EURACAN-GENTURIS Clinical Practice Guidelines for diagnosis, treatment and follow-up. Ann. Oncol. 2021;32:1348–1365. doi: 10.1016/j.annonc.2021.07.006. - DOI - PubMed
    1. Schöffski P., Cornillie J., Wozniak A., Li H., Hompes D. Soft tissue sarcoma: an update on systemic treatment options for patients with advanced disease. Oncol. Res. Treat. 2014;37:355–362. doi: 10.1159/000362631. - DOI - PubMed

Publication types

Associated data