. 2023 Aug 15;4(8):101160.
doi: 10.1016/j.xcrm.2023.101160.

Early activation of inflammatory pathways in UBA1-mutated hematopoietic stem and progenitor cells in VEXAS

Affiliations

Early activation of inflammatory pathways in UBA1-mutated hematopoietic stem and progenitor cells in VEXAS

Zhijie Wu et al. Cell Rep Med. .

Abstract

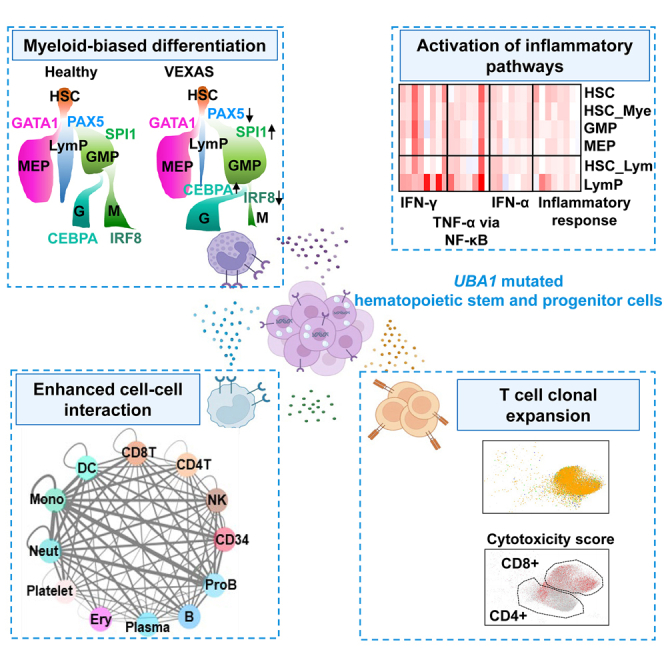
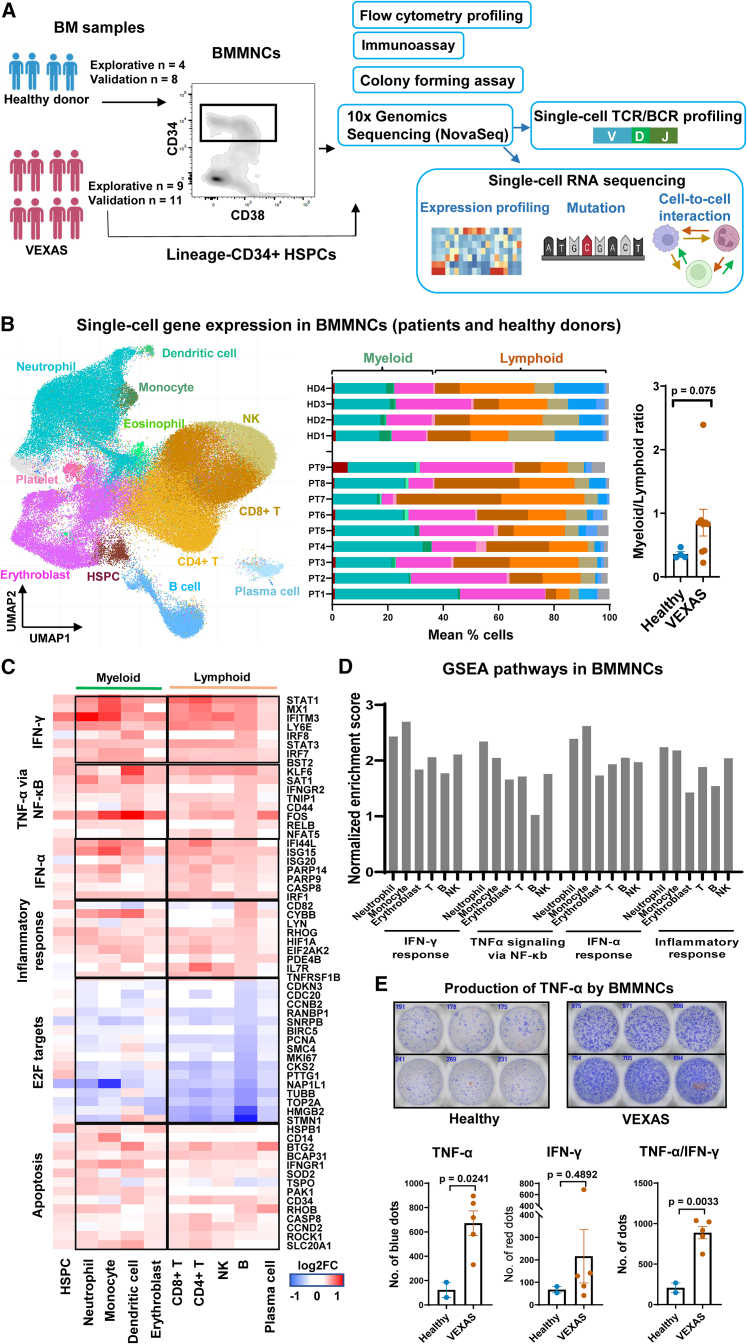
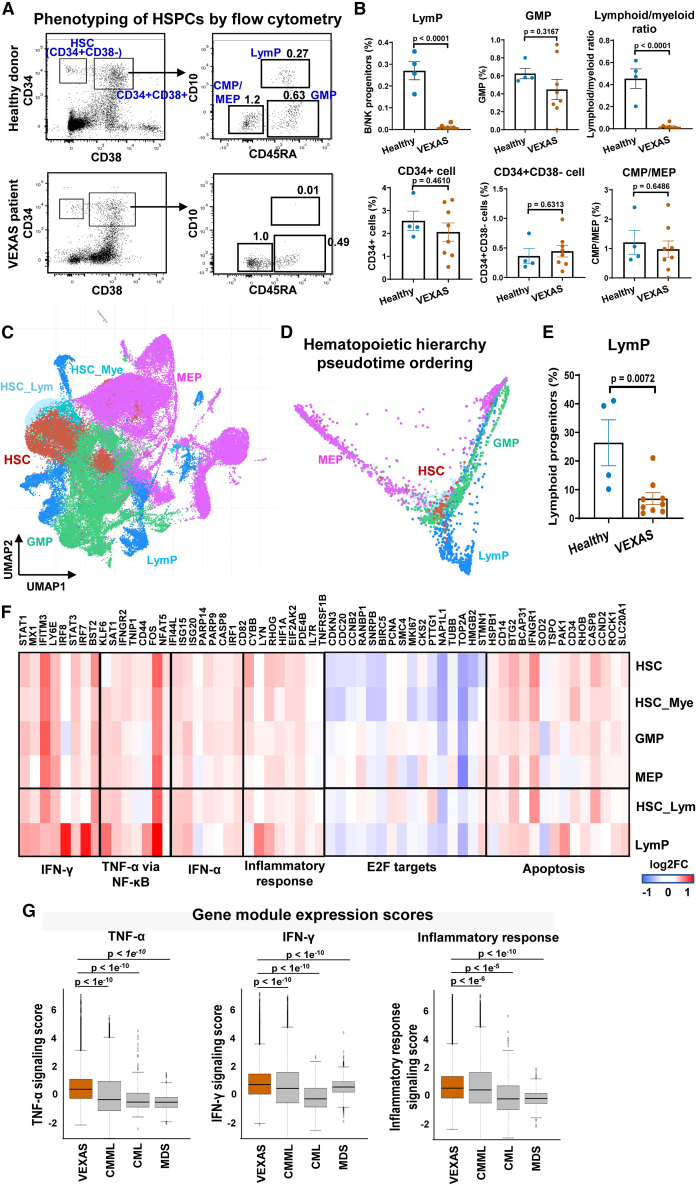
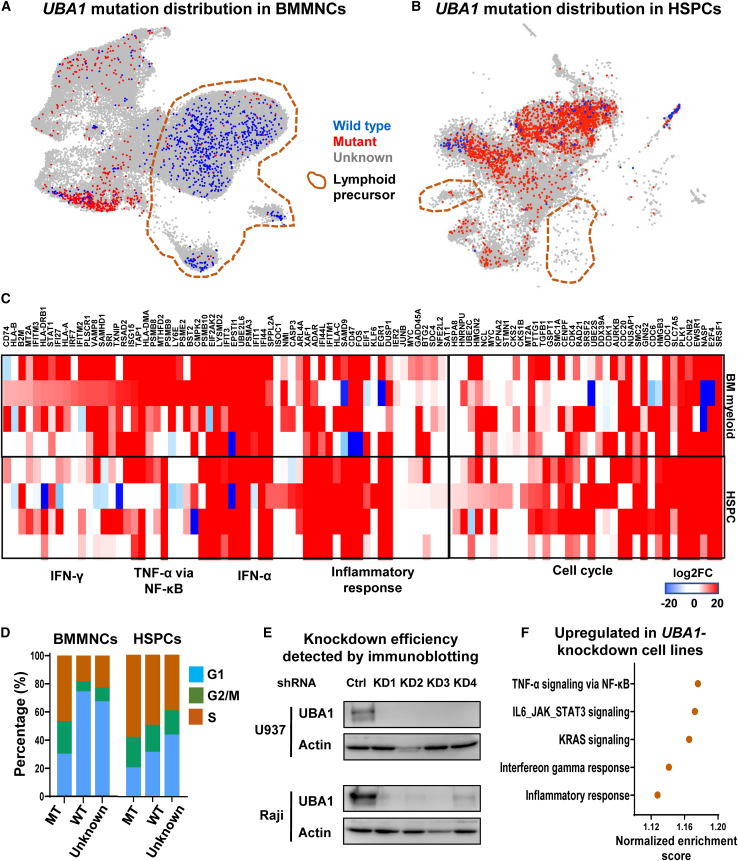
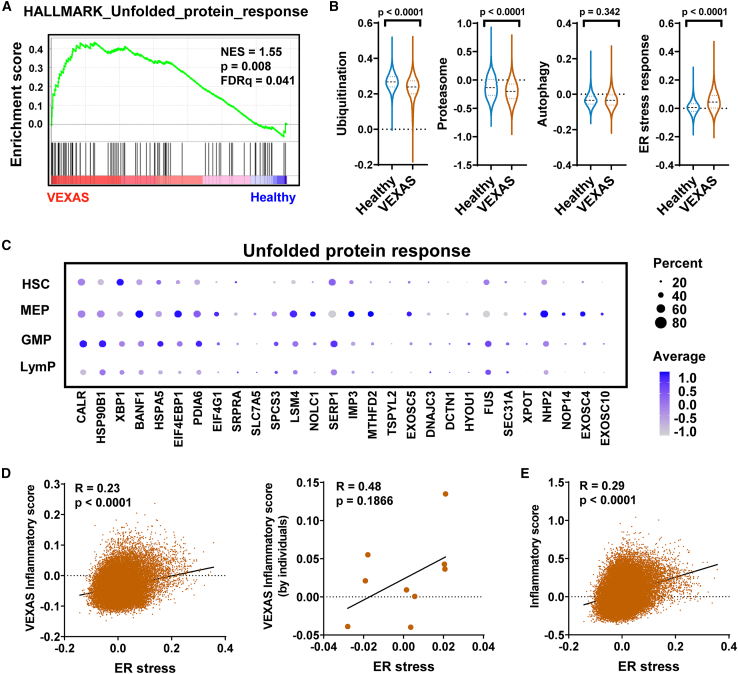
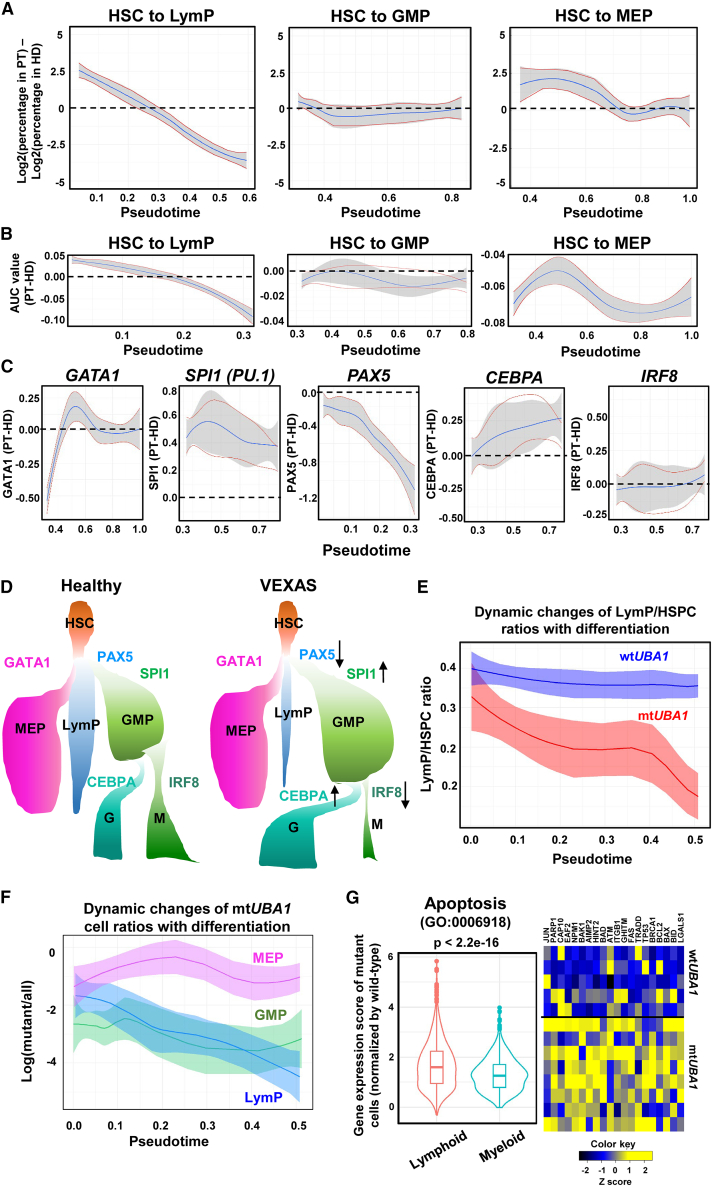
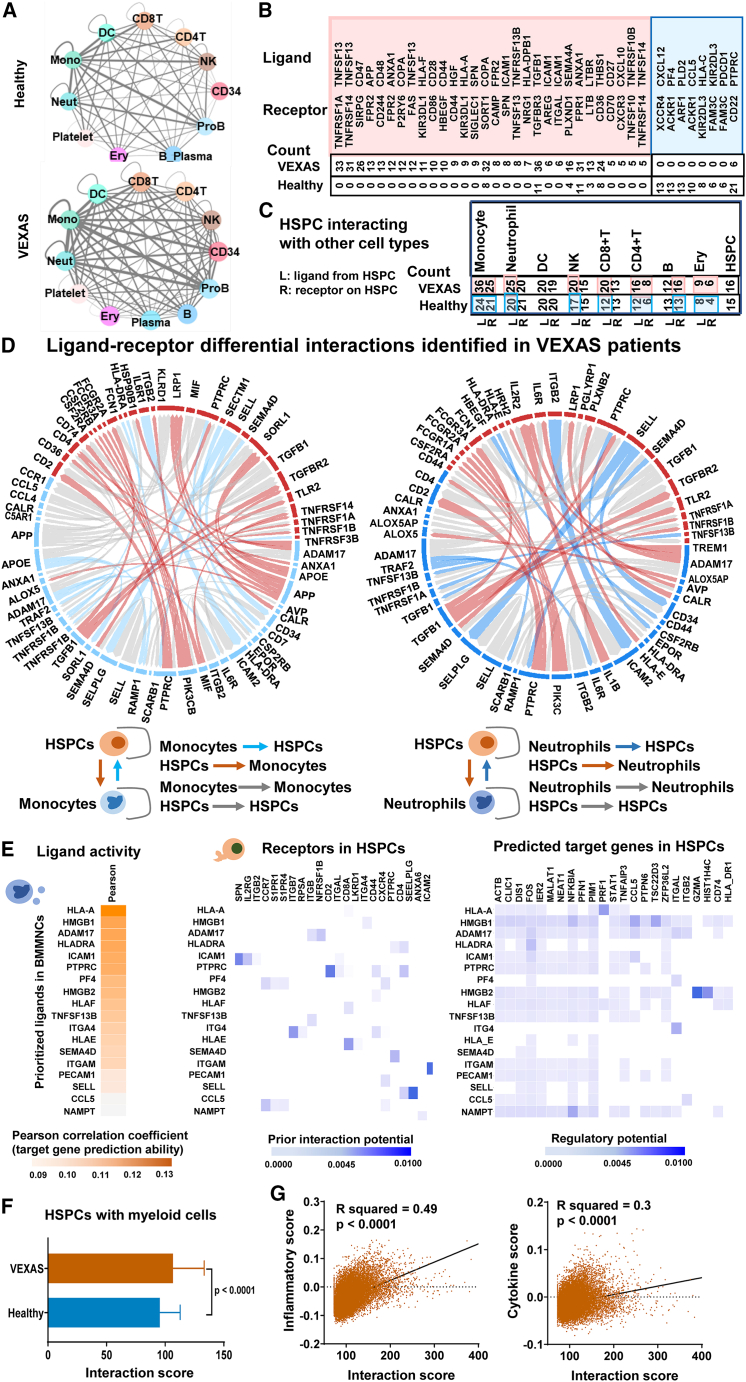
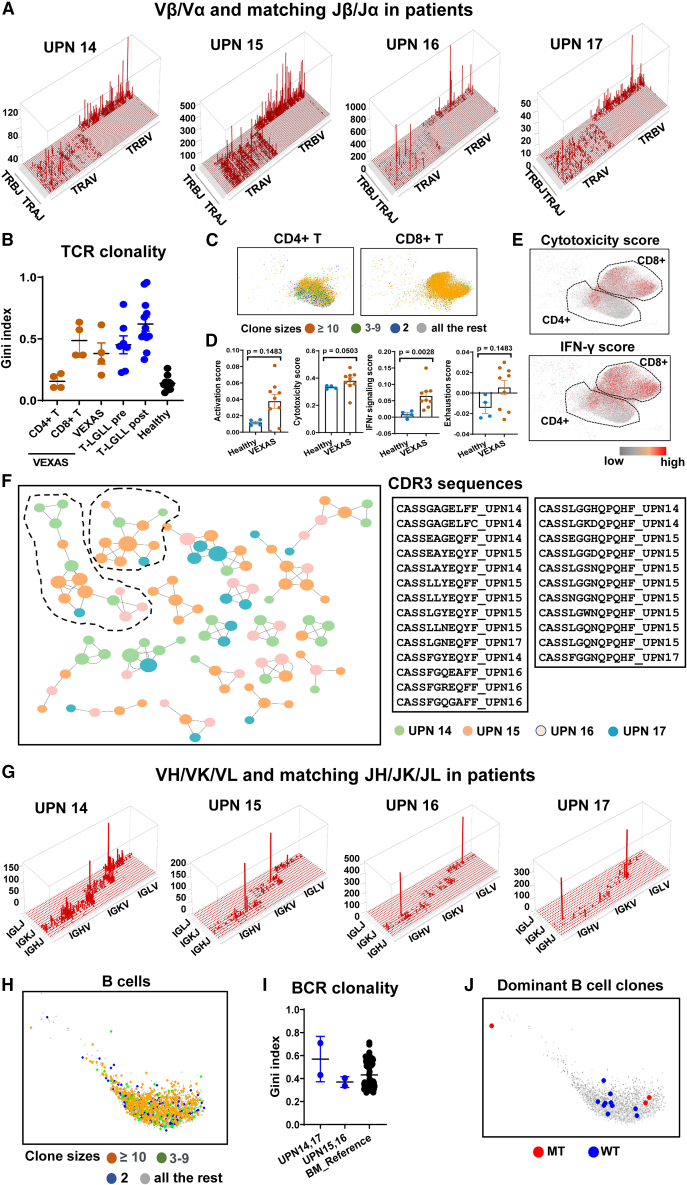
VEXAS (vacuoles, E1 enzyme, X-linked, autoinflammatory, somatic) syndrome is a pleiotropic, severe autoinflammatory disease caused by somatic mutations in the ubiquitin-like modifier activating enzyme 1 (UBA1) gene. To elucidate VEXAS pathophysiology, we performed transcriptome sequencing of single bone marrow mononuclear cells and hematopoietic stem and progenitor cells (HSPCs) from VEXAS patients. HSPCs are biased toward myeloid (granulocytic) differentiation, and against lymphoid differentiation in VEXAS. Activation of multiple inflammatory pathways (interferons and tumor necrosis factor alpha) occurs ontogenically early in primitive hematopoietic cells and particularly in the myeloid lineage in VEXAS, and inflammation is prominent in UBA1-mutated cells. Dysregulation in protein degradation likely leads to higher stress response in VEXAS HSPCs, which positively correlates with inflammation. TCR usage is restricted and there are increased cytotoxicity and IFN-γ signaling in T cells. In VEXAS syndrome, both aberrant inflammation and myeloid predominance appear intrinsic to hematopoietic stem cells mutated in UBA1.

Keywords: VEXAS; clonal hematopoiesis; inflammation; single-cell RNA sequencing.


Conflict of interest statement

Declaration of interests The authors declare no competing interests.

Figures

None
Graphical abstract
Figure 1
Figure 1
Myeloid dominance and activation of the inflammatory pathways in VEXAS BMMNCs (A) Experimental workflow. BMMNC samples from patients and healthy donors were subjected to multi-color flow cytometry to profile hematopoietic stem and progenitor cell (HSPC) subpopulations, and to ELISpot assay to quantify BMMNCs secreting TNF-α or IFN-γ. BMMNCs and FACS-sorted LineageCD34+ cells were subjected to colony forming assay and single-cell RNA sequencing (scRNA-seq) using the 10x Genomics platform. scRNA-seq libraries were sequenced on the Illumina NovaSeq system before data analysis, including single-cell transcriptome profiling (gene expression, gene mutation, and cell-cell interaction) and single-cell T cell receptor/B cell receptor (scTCR/BCR) profiling. (B) A Uniform Manifold Approximation and Projection (UMAP) plot of single-cell gene expression in BMMNCs of all patients and healthy donors. Cells are colored by types (HSPC, erythroblast, neutrophil, monocyte, T cell, NK cell, B cell, plasma cell, eosinophil, and dendritic cell). A bar chart shows percentages of these cell populations in individual patients and healthy donors. The color legend is the same as that in the UMAP plot. A dot plot showing a myeloid (erythroblast, neutrophil, monocyte, and dendritic cell) vs. lymphoid (T cell, B cell, NK cell, and plasma cell) ratio in patients and healthy donors. Data are presented as mean values ± standard error of the mean (SEM). p values with the two-sided unpaired Mann-Whitney test are shown. (C) Heatmap showing expression of representative differentially expressed genes grouped by their functional pathways in IFN-γ and IFN-α signaling, TNF-α via NF-κB signaling, inflammatory response, E2F targets, and apoptosis, between BMMNCs from VEXAS patients (n = 9) and healthy controls (n = 4). Values are presented as log2 fold-changes (log2FC). (D) Gene set enrichment analysis (GSEA) of expressed genes in BMMNC subpopulations of VEXAS patients, including neutrophils, monocytes, erythroblasts, T cells, B cells, and NK cells. Normalized enrichment scores for the GSEA pathways are plotted, showing higher enrichment of the inflammatory pathways in neutrophils and monocytes than those in lymphoid cells. (E) Representative ELISpot wells showing TNF-α secretion by BMMNCs from two VEXAS patients and two healthy donors in a second batch of the validation cohort, in triplicate. Bottom, quantification of TNF-α-, IFN-γ-, and TNF-α/IFN-γ-positive spots in BMMNCs plated (VEXAS patients n = 5 and healthy donors n = 2, in triplicate). Data are presented as mean values ± standard error of the mean (SEM). p values with the two-sided unpaired Mann-Whitney test are shown.
Figure 2
Figure 2
Myeloid bias and activation of the inflammatory pathways in VEXAS HSPCs (A) Phenotypes of HSPCs in healthy donors and VEXAS patients by flow cytometry. Cell populations were defined as reported: HSC, LineageCD34+CD38; CMP/MEP, LineageCD34+CD38+CD10CD45RA; GMP, LineageCD34+CD38+CD10CD45RA+; LymP, LineageCD34+CD38+CD10+; HSC, hematopoietic stem cells and multipotent progenitors; CMP, multipotent common myeloid progenitor; MEP, megakaryocytic-erythrocytic progenitors; GMP, granulocytic-monocytic progenitors; LymP, lymphoid progenitors. (B) Proportions of progenitor populations were compared between VEXAS patients (n = 9) and healthy donors (n = 4). Data are shown with mean values ± SEM. p values with the two-sided unpaired Mann-Whitney test are shown. (C) A UMAP plot of single-cell gene expression in HSPCs of all patients and healthy donors. Cells are colored by cell types as HSC, MEP, GMP, LymP, HSC_Lym (HSC with lymphoid differentiation potential), and HSC_Mye (HSC with myeloid differentiation potential). (D) Reconstruction of hematopoietic hierarchy pseudotime ordering with Palantir. The color legend is the same as in (C). (E) Percentages of LymPs were compared between VEXAS patients (n = 9) and healthy donors (n = 4). Data are presented as mean values ± SEM. p values with the two-sided unpaired Mann-Whitney test are shown. (F) Heatmap showing expression of representative differentially expressed genes grouped by their functional pathways in IFN-γ and IFN-α signaling, TNF-α via NF-κB signaling, inflammatory response, E2F targets, and apoptosis, between HSPCs from VEXAS patients (n = 9) and healthy controls (n = 4). Values are presented as log2FC. (G) Relative inflammatory pathway scores (TNF-α signaling, IFN-γ signaling, and inflammatory response signaling scores) in VEXAS, CMML, CML, and MDS patients.,, p values with the two-sided unpaired t test are shown.
Figure 3
Figure 3
UBA1-mutated HSPCs exhibit increased inflammation and active cell cycling (A) A UMAP plot of single-cell gene expression in BMMNCs of VEXAS patients, as in Figure 1B. Cells with expressed mutated UBA1 (mtUBA1) and wild-type UBA1 (wtUBA1) are colored red and blue, respectively, and all the other cells in gray. Lymphoid precursors are circled on the UMAP plot. (B) A UMAP plot of HSPCs of VEXAS patients, the same as Figure 2C. Cells with expressed mtUBA1 and wtUBA1 are colored red and blue, respectively, and all the other cells in gray. (C) A heatmap showing expression of representative differentially expressed genes grouped by their functional pathways in IFN-γ and IFN-α signaling, TNF-α via NF-κB signaling, inflammatory response, and cell cycling, between mtUBA1 and wtUBA1 BMMNCs (top) and HSPCs (bottom) in VEXAS patients (n = 9). Values are presented as log2FC. (D) Bar plots showing percentages of BMMNCs (left) and HSPCs (right) in G1, G2/M, and S phases of cell cycle in mtUBA1, wtUBA1, and NULL cells in VEXAS patients. (E) Immunoblotting results showing knockdown efficiency of UBA1 in cell lines (U937 and Raji). (F) A dot plot showing top GO terms enriched in upregulated genes in UBA1 knockdown cell lines (U937, THP1, Raji, and Jurkat) compared with those in wild-type control cell lines.
Figure 4
Figure 4
Dysregulated protein degradation and stress response in VEXAS HSPCs (A) A GSEA enrichment plot for a hallmark_unfolded protein response gene set for differentially expressed genes of mtUBA1 HSPCs compared with wtUBA1 HSPCs in VEXAS patients. GSEA was based on the Kolmogorov-Smirnov test. (B) Expression levels of pathways (protein ubiquitination, proteasome, autophagy, and response to ER stress) in HSPCs of VEXAS patients (n = 9) and healthy controls (n = 4). p values with the two-sided unpaired t test are shown. (C) Bubble plot showing expression of genes in the unfolded protein response pathway in HSPC subsets in VEXAS patients. Dot sizes correspond to percentages of cells expressing genes, and dot colors correspond to expression levels of genes. (D) Correlation of a VEXAS inflammatory score (calculated based on a gene list of IFN-γ and IFN-α signaling, TNF-α via NF-κB signaling, and the inflammatory response pathways) and ER stress on single-cell levels (left, each dot indicates one cell) and in individual patients (right, each dot indicates one patient). p values and R value estimated using a Pearson correlation test are shown. (E) Correlation of an inflammatory score, and ER stress on single-cell levels. Each dot indicates one cell. p values and R value estimated using a Pearson correlation test are shown.
Figure 5
Figure 5
Lineage bias, increased cell apoptosis in mtUBA1 LymPs, and progressive loss of lymphocytic cells with differentiation (A) Dynamic changes of LymP, GMP, and MEP ratios in VEXAS patients and healthy donors along pseudotime differentiation. x axis: pseudotime ordering from HSCs to LymP, GMP, and MEP, respectively, estimated by Palantir. y axis: Log2(percentages of corresponding cells in VEXAS patients) − log2(percentages of corresponding cells in healthy donors). (B) Dynamic changes of lineage priming of HSCs to LymP, GMP, and MEP, along pseudotime differentiation. x axis: pseudotime ordering from HSCs to lineage-restricted progenitors estimated by Palantir. y axis: Log(lineage signature gene expression in patients/lineage signature gene expression in healthy donors). Lineage signature gene expression represented area under the receiver operating characteristic curve (AUC) values calculated with AUCell. (C) Dynamic changes of expression levels of transcription factors (GATA1, SPI1, PAX5, CEBPA, and IRF8) along pseudotime differentiation. x axis: pseudotime ordering from HSCs to MEP, GMP, and LymP, respectively, estimated by Palantir. y axis: expression of transcription factors in patients normalized by that in healthy donors. (D) A schematic diagram showing hematopoietic lineage specification and relative quantity of cell types in VEXAS patients and healthy donors. (E) Dynamic changes of wtUBA1 LymP and mtUBA1 LymP ratios in HSPCs in VEXAS patients along differentiation. x axis: pseudotime ordering from HSCs to lineage-restricted progenitors estimated by Palantir. y axis: ratios of wtUBA1 LymP or mtUBA1 LymP in HSPCs. (F) Dynamic changes of mtUBA1 cell ratios in LymP, GMP, and MEP in VEXAS patients along differentiation. x axis: pseudotime ordering from HSCs to lineage-restricted progenitors estimated by Palantir. y axis: Log(cell numbers of mutant/all HSPCs). (G) Apoptosis gene expression scores (calculated by the AddModuleScore function in Seurat) of mtUBA1 cells normalized by wtUBA1 cells in myeloid and lymphoid BMMNCs were compared. y axis: normalized expression levels of apoptosis genes. A heatmap of apoptosis genes upregulated in mtUBA1 cells is shown on the right.
Figure 6
Figure 6
Enhanced cell-cell interactions of activated myeloid cells with HSPCs in VEXAS patients (A) Ligand-receptor pairs among cell types in BMMNCs were estimated by CellPhoneDB. Color legends for cell types are the same as in Figure 1B. Thickness of lines connecting cell types indicates total number of ligand-receptor pairs between two cell types estimated by CellPhoneDB. In general, there were more ligand-receptor interactions between cell types in BMMNCs of VEXAS (bottom) than in those of healthy donors (top). CD8T, CD8+ T cell; CD4T, CD4+ T cell; NK, natural killer cell; CD34, CD34+ cell; ProB, pro-B cell; B_Plasma, B cell_Plasma cell; Ery, erythroblast; Neut, neutrophil; Mono, monocyte; DC, dendritic cell. (B) Among the 149 ligand-receptor pairs expressed in VEXAS patients and healthy donors, the number of ligand-receptor pairs presenting in BMMNCs in VEXAS patients and healthy donors were counted. A pink box indicates ligand-receptor pairs most represented in VEXAS; most of them were unique in VEXAS BMMNCs. A blue box indicates ligand-receptor pairs that are less represented in VEXAS than in healthy donors. (C) Summary of ligand-receptor pairs between HSPCs with many immune cell types in VEXAS patients and in healthy donors. Highlights in pink for patients and blue for healthy donors indicate that the number of ligand-receptor pairs is higher in patients than in healthy donors. (D) Potential target genes were identified as differentially expressed in VEXAS patients compared with healthy donors with an adjusted p value < 0.05 and a log fold change > 0.1 or < −0.1. Summary of ligand-receptor differential interactions identified in VEXAS patients by NicheNetr based on differentially expressed genes. Blue segments, molecules expressed by monocytes (left) and neutrophils (right); red segments, molecules expressed by CD34+HSPCs; blue arcs, interactions of ligands from monocytes/neutrophils with receptors on CD34+HSPCs; red arcs, interactions of ligands from CD34+HSPCs with receptors on monocytes/neutrophils; gray arcs, interactions of ligands and receptors in the same cell types. Left and right panels show interactions between monocytes and CD34+HSPCs, and between neutrophils and CD34+HSPCs, respectively. (E) Cell-cell interactions were defined by NicheNetr. Ligands expressed by BMMNCs were ranked by likelihood that ligands would affect gene expression changes in CD34+HSPCs. Receptors expressed on CD34+HSPCs were selected based on their known potentials to interact with prioritized ligands. Finally, target genes were selected based on their differential expression in CD34+HSPCs and their potentials to be regulated by ligand-receptor interactions identified between BMMNCs and CD34+HSPCs. (F) Interaction scores of patients’ CD34+HSPCs with myeloid cells were compared with those in healthy donors. p values with the two-sided unpaired t test are shown. (G) Correlation of interaction scores (CD34+HSPCs with myeloid cells in patients) with inflammatory scores (left) and cytokine scores (right) were analyzed. p values and R values with the Pearson correlation test are shown.
Figure 7
Figure 7
TCR and BCR usage in VEXAS (A) Skyscraper plots showing Vβ/Vα and matching Jβ/Jα in VEXAS patients (UPNs 14–17). (B) Gini indexes of TCR clonality in CD4+ T cells, CD8+ T cells, and total T cells of BM of VEXAS patients (n = 4), peripheral blood T cells of T-large granular lymphocytic leukemia (T-LGLL) patients pre-aleumtuzmab treatment (n = 13), T-LGLL patients post-aleumtuzumab treatment (n = 12), and healthy donors (n = 7). (C) Clone size information was projected to the UMAP of CD4+ T and CD8+ T cells in VEXAS patients. Clones with size 2 (two cells with identical TCR sequences) are in blue color, clones with sizes 3–9 (three to nine cells with identical TCR sequences) in green, and highly expanded clones with sizes ≥ 10 (at least 10 cells with identical TCR sequences) in red, and all other cells in gray. (D) Expression of T cell activation score, cytotoxicity score, IFN-γ signaling score, and exhaustion score were plotted by individual for patients (n = 9) and healthy donors (n = 4). p values with the two-sided unpaired Mann-Whitney test were shown. (E) CD4+ and CD8+ T cells from VEXAS patients were plotted in UMAP. Top 10% cells expressing the highest cytotoxicity score and IFN-γ signaling score are highlighted in red and all the rest in gray. (F) TCRs identified in VEXAS patients were clustered by GLIPH2, and clusters with at least four TCRs are shown. Colors indicate TCR sequences originated from individual patients. CDR3 sequences for the top two largest TCR clusters are listed, encompassing TCRs from all four patients. (G) Skyscraper plots showing VH/VK/VL and matching JH/JK/JL in VEXAS patients (UPNs 14–17). (H) Clone size information was projected to the UMAP of B cells in VEXAS patients. Clones with size 2 (two cells with identical BCR sequences) are in blue color, clones with sizes 3–9 (three to nine cells with identical BCR sequences) in green, highly expanded clones with sizes ≥ 10 (at least 10 cells with identical BCR sequences) in red, and all other cells in gray. (I) Gini indexes of BCR clonality in UPNs 14–17, and healthy donors in a reference study (n = 71). Data are presented as mean values ± SEM. p values with two-sided unpaired Mann-Whitney test are shown. (J) B cells from the two largest clones are plotted on UMAP. Clone CAKVYSGEMATMFGFDHSHYYGMDVW (size 449) and clone CARNLLMWFGEFYPW (size 186). B cells with captured UBA1 mutations are highlighted in red; B cells with captured wild-type UBA1 transcripts and all the rest are highlighted in gray.

References

    1. Beck D.B., Ferrada M.A., Sikora K.A., Ombrello A.K., Collins J.C., Pei W., Balanda N., Ross D.L., Ospina Cardona D., Wu Z., et al. Somatic mutations in UBA1 and severe adult-onset autoinflammatory disease. N. Engl. J. Med. 2020;383:2628–2638. - PMC - PubMed
    1. Beck D.B., Bodian D.L., Shah V., Mirshahi U.L., Kim J., Ding Y., Magaziner S.J., Strande N.T., Cantor A., Haley J.S., et al. Estimated prevalence and clinical manifestations of UBA1 variants associated with VEXAS syndrome in a clinical population. JAMA. 2023;329:318–324. - PMC - PubMed
    1. Obiorah I.E., Patel B.A., Groarke E.M., Wang W., Trick M., Ombrello A.K., Ferrada M.A., Wu Z., Gutierrez-Rodrigues F., Lotter J., et al. Benign and malignant hematologic manifestations in patients with VEXAS syndrome due to somatic mutations in UBA1. Blood Adv. 2021;5:3203–3215. - PMC - PubMed
    1. Georgin-Lavialle S., Terrier B., Guedon A.F., Heiblig M., Comont T., Lazaro E., Lacombe V., Terriou L., Ardois S., Bouaziz J.-D., et al. Further characterization of clinical and laboratory features in VEXAS syndrome: large-scale analysis of a multicentre case-series of 116 French patients. Br. J. Dermatol. 2022;186:564–574. - PubMed
    1. Ferrada M.A., Sikora K.A., Luo Y., Wells K.V., Patel B., Groarke E.M., Ospina Cardona D., Rominger E., Hoffmann P., Le M.T., et al. Somatic mutations in UBA1 defined a distinct subset of relapsing polychondritis patients with VEXAS. Arthritis Rheumatol. 2021;73:1886–1895. - PubMed

Publication types

Supplementary concepts