. 2023 Oct 3;35(10):1782-1798.e8.
doi: 10.1016/j.cmet.2023.07.009. Epub 2023 Aug 15.

NSUN2 is a glucose sensor suppressing cGAS/STING to maintain tumorigenesis and immunotherapy resistance

Affiliations

NSUN2 is a glucose sensor suppressing cGAS/STING to maintain tumorigenesis and immunotherapy resistance

Tingjin Chen et al. Cell Metab. .

Abstract

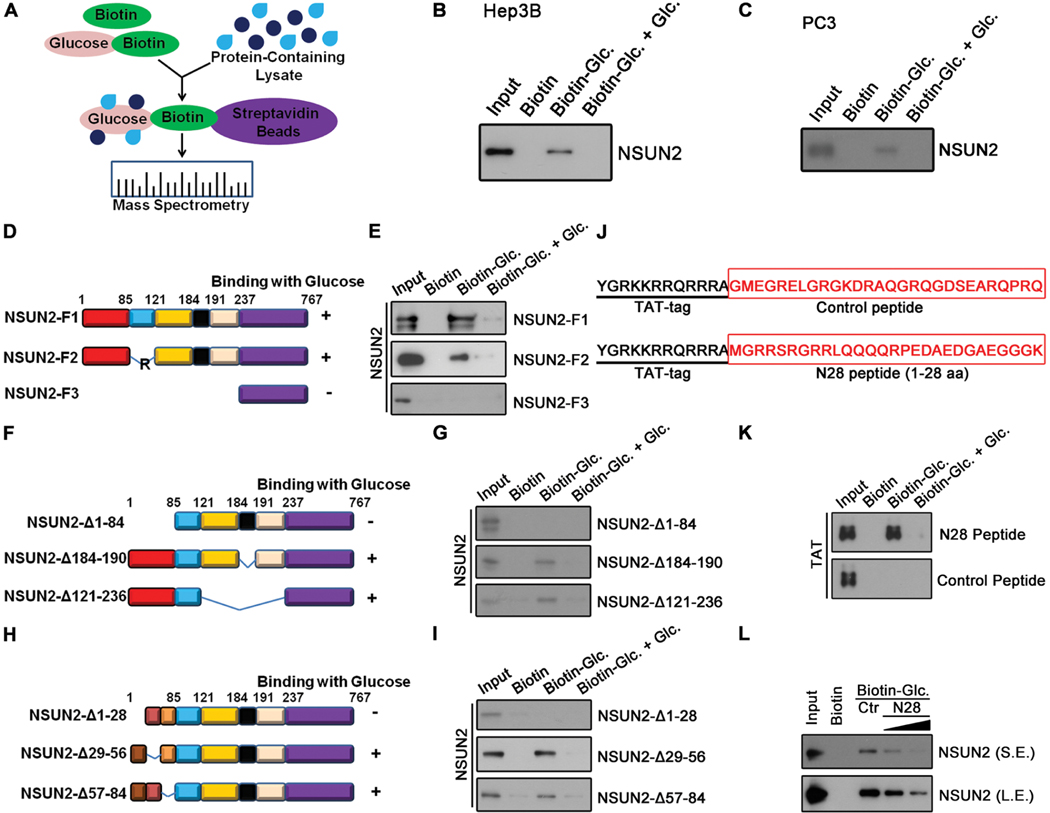
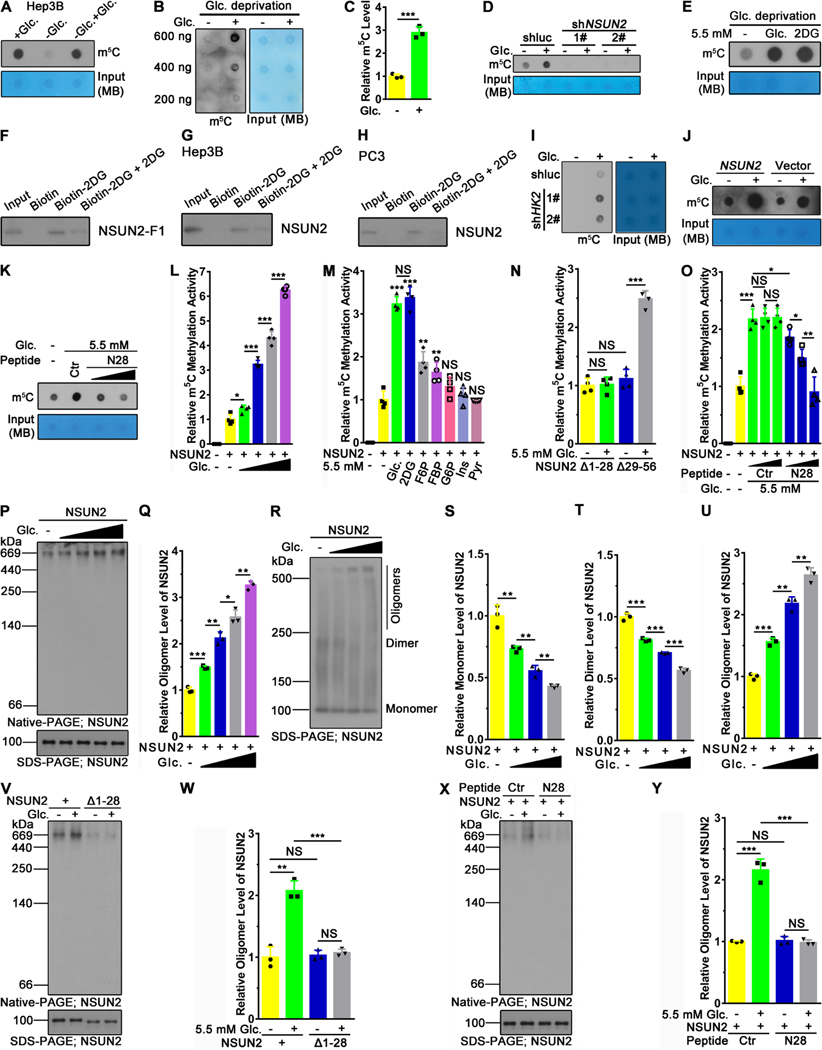
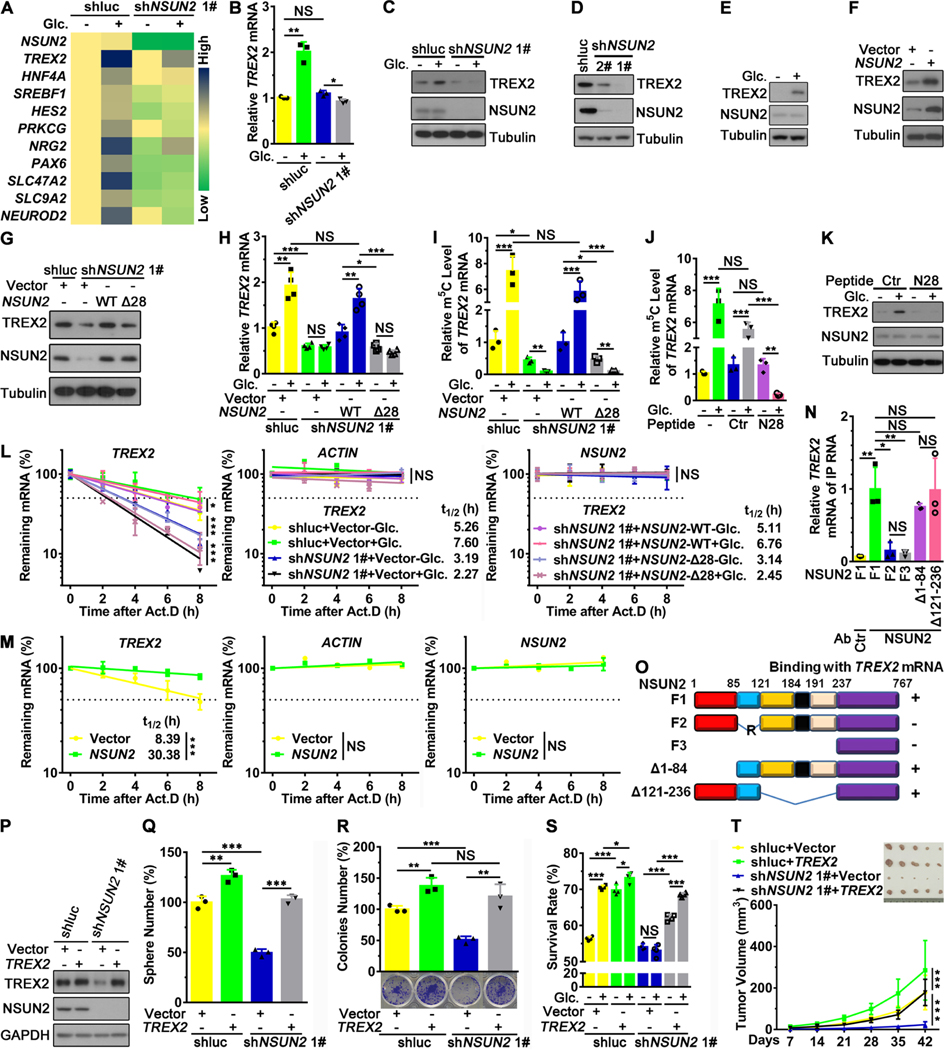
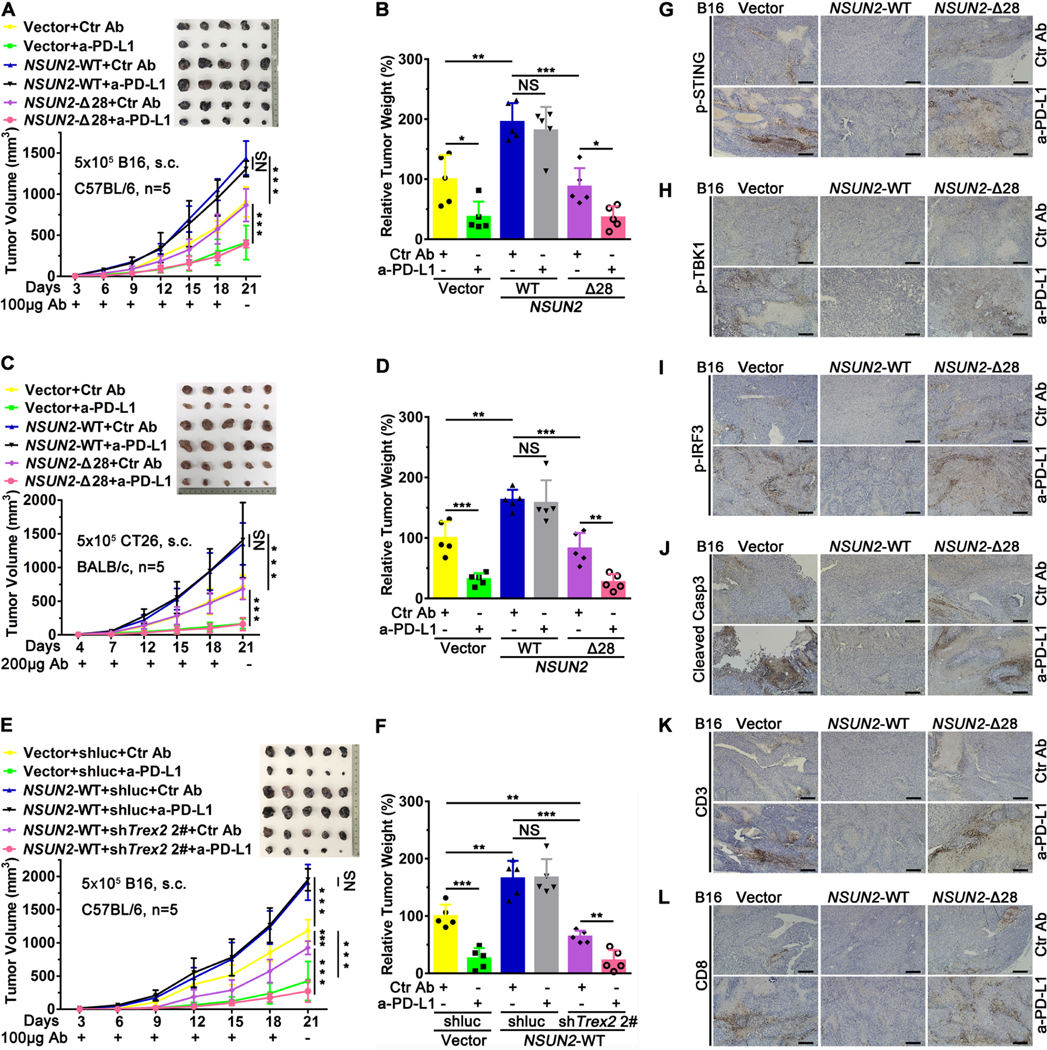
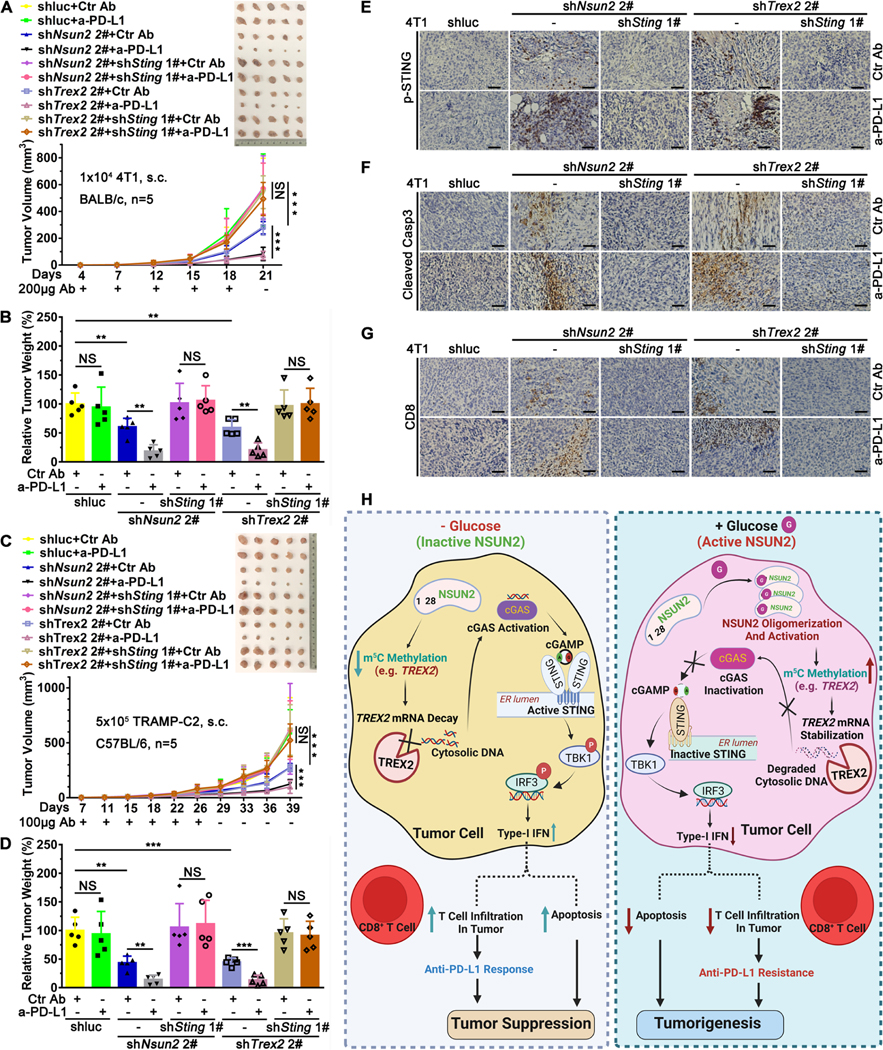
Glucose metabolism is known to orchestrate oncogenesis. Whether glucose serves as a signaling molecule directly regulating oncoprotein activity for tumorigenesis remains elusive. Here, we report that glucose is a cofactor binding to methyltransferase NSUN2 at amino acid 1-28 to promote NSUN2 oligomerization and activation. NSUN2 activation maintains global m5C RNA methylation, including TREX2, and stabilizes TREX2 to restrict cytosolic dsDNA accumulation and cGAS/STING activation for promoting tumorigenesis and anti-PD-L1 immunotherapy resistance. An NSUN2 mutant defective in glucose binding or disrupting glucose/NSUN2 interaction abolishes NSUN2 activity and TREX2 induction leading to cGAS/STING activation for oncogenic suppression. Strikingly, genetic deletion of the glucose/NSUN2/TREX2 axis suppresses tumorigenesis and overcomes anti-PD-L1 immunotherapy resistance in those cold tumors through cGAS/STING activation to facilitate apoptosis and CD8+ T cell infiltration. Our study identifies NSUN2 as a direct glucose sensor whose activation by glucose drives tumorigenesis and immunotherapy resistance by maintaining TREX2 expression for cGAS/STING inactivation.

Keywords: NSUN2; STING; T cell infiltration; TREX2; cGAS; glucose; immunotherapy resistance; m(5)C RNA methylation.


Conflict of interest statement

Declaration of interests H.-K.L. is a consultant for Stablix, Inc.

Figures

Figure 1.
Figure 1.. NSUN2 Is a Novel Interacting Protein of Glucose, and Its N-terminal Region Mediates Glucose Binding
(A) Identification of the potential glucose interacting proteins. Biotin or biotin-glucose was incubated with HEK293 cell lysate, followed by the incubation of streptavidin beads and subjected to mass spectrometry analysis (n = 3 biological replicates). (B and C) Immunoblotting of binding complexes isolated from cell extracts of Hep3B (B) or PC3 (C) incubated with biotin or biotin-glucose (n = 3 biological replicates for each cell line). (D) Schematic representations of three NSUN2 isoforms. (E) Immunoblotting from in vitro mapping assays among biotin-glucose and NSUN2-F1, NSUN2-F2 or NSUN2-F3 proteins (n = 3 biological replicates). (F) Schematic representations of various NSUN2 deletion mutants (NSUN2-Δ1–84, NSUN2-Δ184–190, NSUN2-Δ121–236). (G) Immunoblotting from in vitro mapping assays among biotin-glucose and NSUN2-Δ1–84, NSUN2-Δ184–190, NSUN2-Δ121–236 proteins (n = 3 biological replicates). (H) Schematic representations of various NSUN2 deletion mutants (NSUN2-Δ1–28, NSUN2-Δ29–56, NSUN2-Δ57–84). (I) Immunoblotting from in vitro mapping assays among biotin-glucose and NSUN2-Δ1–28, NSUN2-Δ29–56, NSUN2-Δ57–84 proteins (n = 3 biological replicates). (J) Schematic representations of the sequence for control or N28 peptide with a TAT tag in N-terminal region. (K) Immunoblotting from in vitro pull-down assays by incubating biotin or biotin-glucose directly bind with control or N28 peptide (n = 3 biological replicates). (L) Immunoblotting from in vitro pull-down assays by incubating biotin or biotin-glucose with NSUN2-F1 protein along with control or N28 peptide. S.E., short exposure; L.E., long exposure (n = 3 biological replicates). See also Figure S1, Table S1 and Table S2.
Figure 2.
Figure 2.. Glucose Serves As a Cofactor to Directly Promote Oligomerization and Activation of NSUN2
(A) Hep3B cells without or with glucose starvation for 4 h and restored with glucose (5.5 mM) 2 h before Dot blot assay of m5C levels (total RNA) (n = 3 biological replicates). (B) Hep3B cells were glucose-starved and restored with glucose, followed by Dot blot assay of m5C levels (n = 3 biological replicates). (C) The m5C level intensity of (B) was determined using ImageJ (n = 3 biological replicates). (D) NSUN2 knockdown Hep3B cells were glucose-starved for 4 h and restored with glucose (5.5 mM) 2 h for Dot blot assay (n = 3 biological replicates). (E) Hep3B were glucose-starved for 4 h and restored with glucose or 2DG (5.5 mM) 2 h for Dot blot assay (n = 3 biological replicates). (F) Immunoblotting from in vitro biotin pull-down assays among biotin-2DG and NSUN2-F1 protein (n = 3 biological replicates). (G and H) Immunoblotting from cell extracts of Hep3B (G) or PC3 (H) incubated with biotin or biotin-2DG (n = 3 biological replicates for each cell line). (I and J) HK2 knockdown (I) and NSUN2 overexpression (J) Hep3B cells were glucose-starved for 4 h and restored with glucose (5.5 mM) 2 h for Dot blot assay (n = 3 biological replicates). (K) Hep3B cells were glucose-starved for 4 h and restored with glucose (5.5 mM) 2 h along with control (6 μM) or N28 (2 μM, 6 μM) peptide treatment for Dot blot assay (n = 3 biological replicates). (L) In vitro m5C RNA methylation assays for NSUN2 activity with various concentrations of glucose (2.75 mM, 5.5 mM, 11 mM, 25 mM) (n = 4 biological replicates). (M) In vitro m5C RNA methylation assays for NSUN2 activity with 2DG, glucose or its downstream metabolites (n = 4 biological replicates). (N) In vitro m5C RNA methylation assays using NSUN2-Δ1–28, NSUN2-Δ29–56 proteins along with or without glucose (n = 4 biological replicates). (O) In vitro m5C RNA methylation assays using NSUN2 protein along with control or N28 peptide (n = 4 biological replicates). (P) Native-PAGE assay of NSUN2 protein with various concentrations of glucose (2.75 mM, 5.5 mM, 11 mM, 25 mM) (n = 3 biological replicates). (Q) Quantification of relative oligomer level of NSUN2 in (P) by normalization with the total level of NSUN2 in SDS-PAGE (n = 3 biological replicates). (R) Chemical crosslinking of NSUN2 protein with various concentrations of glucose (2.75 mM, 5.5 mM, 11 mM) (n = 3 biological replicates). (S, T and U) Quantification of relative monomer (S), dimer (T), and oligomer (U) level of NSUN2 in (R) by normalization with the control group of no glucose (Lane 1) (n = 3 biological replicates). (V and W) Native-PAGE assay (V) and quantification (W) of NSUN2, NSUN2-Δ1–28 proteins with or without glucose (5.5 mM). (X and Y) Native-PAGE assay (X) and quantification (Y) NSUN2 protein along with control or N28 peptide, the relative level of NSUN2 oligomerization in Native-PAGE by normalization with the total level of NSUN2 in SDS-PAGE (n = 3 biological replicates). Data are mean ± SD. *, p < 0.05, **, p < 0.01. ***, p < 0.001, NS, non-significant by Student’s t-test (C, L-O, Q, S, T, U, W, Y). See also Figure S2.
Figure 3.
Figure 3.. Glucose/NSUN2 Binding Leading to NSUN2 Activation Maintains Oncogenic Activity of Cancer Cells
(A) Sphere forming assays of Hep3B cells starved with glucose and restored with various concentrations of glucose (5.5 mM, 11 mM, 25 mM) (n = 3 biological replicates). (B) Sphere forming assays of Hep3B cells treated with 0 mM glucose, 5.5 mM glucose, 5.5 mM 2DG or 5.5 mM 3OMG (n = 3 biological replicates). (C) Sphere forming assays in glucose-starved Hep3B cells added back G6P (by transfection) with or without non-metabolizable glucose analog, 2DG or 3OMG (n = 3 biological replicates). (D, E, F, and G) Control and NSUN2 knockdown Hep3B cells were subject to immunoblotting (D), sphere forming assays (E), growth curve (F) and colony forming assays (G) (n = 3 biological replicates). (H) In vivo xenograft tumorigenesis assay of NSUN2 knockdown Hep3B cells subcutaneously injected to nude mice (n = 5 animals/group). (I, J, and K) Hep3B cells incubated with control or N28 peptide (2 μM, 6 μM) were subjected to sphere forming assays (I), growth curve (J) and colony forming assays (K) (n = 3 biological replicates). (L, M, N, O, P, and Q) Control and NSUN2 knockdown Hep3B cells restored with NSUN2-WT or NSUN2-Δ28 were subjected to immunoblotting (L), m5C Dot blot assay (M), sphere forming assays (N), growth curve (O), colony forming assays (P) and survival rate (Q) (n = 3 biological replicates). (R) In vivo xenograft tumorigenesis assay of control and NSUN2 knockdown Hep3B cells restored with NSUN2-WT or NSUN2-Δ28 subcutaneously injected to nude mice (n = 5 animals/group). Data are mean ± SD. *, p < 0.05, **, p < 0.01, ***, p < 0.001, NS, non-significant by Student’s t-test (A, B, C, E, G, I, K, N, P, Q) or by 2-way ANOVA (F, H, J, O, R). See also Figure S3.
Figure 4.
Figure 4.. The Glucose/NSUN2 Axis Maintains TREX2 Expression to Execute Its Oncogenic Activity
(A) The heatmap for relative mRNA level of selected target genes from RNA-seq in NSUN2 knockdown Hep3B cells glucose-starved for 4 h and restored with glucose (5.5 mM) 2 h (n = 3 biological replicates). (B and C) RT-qPCR analysis (B) and immunoblotting (C) in NSUN2 knockdown Hep3B cells glucose-starved for 4 h and restored with glucose (5.5 mM) 2 h (n = 3 biological replicates). (D) Immunoblotting in NSUN2 knockdown Hep3B cells (n = 3 biological replicates). (E) Immunoblotting in Hep3B cells glucose-starved for 4 h and restored with glucose (5.5 mM) 2 h (n = 3 biological replicates). (F) Immunoblotting in NSUN2 overexpression Hep3B cells (n = 3 biological replicates). (G) Immunoblotting in NSUN2 knockdown Hep3B cells restored with NSUN2-WT or NSUN2-Δ28 (n = 3 biological replicates). (H) RT-qPCR analysis in the restoration of NSUN2-WT or NSUN2-Δ28 upon NSUN2 knockdown Hep3B cells with or without glucose (5.5 mM) (n = 3 biological replicates). (I) RNA-IP using anti-m5C antibody, followed by RT-qPCR analysis in the restoration of NSUN2-WT or NSUN2-Δ28 upon NSUN2 knockdown Hep3B cells with or without glucose (5.5 mM) (n = 3 biological replicates). (J) RNA-IP using anti-m5C antibody, followed by RT-qPCR analysis in Hep3B with glucose starvation for 4 h and restored with glucose (5.5 mM) 2 h along with control or N28 peptide treatment (n = 3 biological replicates). (K) Immunoblotting in Hep3B cells, glucose-starved for 4 h and restored with glucose (5.5 mM) 2 h along with control or N28 peptide treatment (n = 3 biological replicates). (L) RNA decay assay in the restoration of NSUN2-WT or NSUN2-Δ28 in NSUN2 knockdown Hep3B cells, glucose-starved and restored with glucose (n = 3 biological replicates). (M) RNA decay assay in NSUN2 overexpression Hep3B cells treated with actinomycin D (Act. D, 2 μg/ml). RT-qPCR against GAPDH was performed to assess the half-life of TREX2 and ACTIN mRNA (n = 3 biological replicates). (N) RNA-IP using anti-NSUN2 antibody along with various NSUN2 truncated proteins, followed by RT-qPCR analysis of TREX2 mRNA (n = 3 biological replicates). (O) Schematic representations of mapping assay for the NSUN2 fragment binding to TREX2 mRNA. (P, Q, R, and S) Restoration of TREX2 in NSUN2 knockdown Hep3B cells were subjected to immunoblotting (P), sphere forming assays (Q), colony forming assay (R), and survival rate (S) (n = 3 biological replicates). (T) In vivo xenograft tumorigenesis assay of the restoration of TREX2 in NSUN2 knockdown Hep3B subcutaneously inoculated in nude mice (n = 5 animals/group). Data are mean ± SD. *, p < 0.05, **, p < 0.01, ***, p < 0.001, NS, non-significant by Student’s t-test (A, B, H-J, N, Q-S) or by 2-way ANOVA (L, M, T). See also Figure S4 and S5, and Table S3.
Figure 5.
Figure 5.. The Glucose/NSUN2/TREX2 Axis Restricts Cytosolic dsDNA Accumulation for cGAS/STING Activation to Maintain Oncogenic Activity of Cancer Cells
(A) Immunoblotting in NSUN2 knockdown Hep3B cells glucose-starved for 4 h and restored with glucose (5.5 mM) 2 h (n = 3 biological replicates). (B) RT-qPCR analysis in NSUN2 knockdown Hep3B cells restored with NSUN2-WT or NSUN2-Δ28, glucose-starved for 4 h and restored with glucose (5.5 mM) 2 h (n = 3 biological replicates). (C) Immunoblotting in NSUN2 knockdown Hep3B cells restored with NSUN2-WT or NSUN2-Δ28 (n = 3 biological replicates). (D and E) Immunoblotting (D) and RT-qPCR analysis (E) in Hep3B cells glucose-starved for 4 h and restored with glucose (5.5 mM) 2 h along with control or N28 peptide (2 μM) treatment (n = 3 biological replicates). (F and G) ELISA (F) and immunoblotting (G) in NSUN2 knockdown Hep3B cells restored with or without TREX2 (n = 3 biological replicates). (H) Immunoblotting in TREX2 knockdown Hep3B cells glucose-starved for 4 h and restored with glucose (5.5 mM) 2 h (n = 3 biological replicates). (I) Immunoblotting in Hep3B starved with glucose and restored for 4 h with glucose (5.5 mM) 2 h along with or without cGAMP (1 μM) (n = 3 biological replicates). (J) Immunoblotting in shluc, shNSUN2 and shNSUN2+shcGAS Hep3B cells (n = 3 biological replicates). (K) RT-qPCR analysis in shluc, shNSUN2, shNSUN2+shSTING and shNSUN2+shcGAS Hep3B cells (n = 3 biological replicates). (L and M) Confocal images (L) and quantification (M) of cytosolic dsDNA in NSUN2 knockdown Hep3B cells glucose-starved for 4 h and restored with glucose (5.5 mM) 2 h (n = 3 biological replicates). (N and O) Confocal images (N) and quantification (O) of cytosolic dsDNA in Hep3B cells glucose-starved for 4 h and restored with glucose (5.5 mM) 2 h along with control or N28 peptide (2 μM) treatment. Scale bar, 25 μm (n = 3 biological replicates). (P, Q, R, and S) Colony forming assays (P), sphere forming assays (Q), growth curve (R) and survival rate (S) in shluc, shNSUN2, shNSUN2+shSTING, or shNSUN2+shcGAS Hep3B cells (n = 3 biological replicates). (T) In vivo xenograft tumorigenesis assays of shluc, shNSUN2, shNSUN2+shSTING and shNSUN2+shcGAS Hep3B cells subcutaneously inoculated in nude mice (n = 5 animals/group). Data are mean ± SD. *, p < 0.05, **, p < 0.01, ***, p < 0.001, NS, non-significant by Student’s t-test (B, E, F, K, M, O, P, Q, S) or by 2-way ANOVA (R, T). See also Figure S6–S9.
Figure 6.
Figure 6.. The Glucose/NSUN2/TREX2 Axis Drives cGAS/STING Signaling Repression to Promote Anti-PD-L1 Immunotherapy Resistance by Restricting Apoptosis and CD8+ T Cell Infiltration
(A, B, and G-L) Tumor volume (A), tumor weight (B), immunohistochemistry for p-STING (G), p-TBK1 (H), p-IRF3 (I), cleaved caspase-3 (J), CD3 (K), and CD8 (L) in vivo allograft tumorigenesis assays of B16 cells overexpression with Vector control, NSUN2-WT or NSUN2-Δ28 inoculated in C57BL/6 mice (n = 5 animals/group), treated with anti-mouse PD-L1 or rat IgG2b isotype control antibodies. Scale bar, 200 μm. (C and D) Tumor volume (C) and tumor weight (D) in vivo allograft tumorigenesis assays of CT26 cells overexpression with Vector control, NSUN2-WT or NSUN2-Δ28 inoculated in BALB/c mice (n = 5 animals/group), treated with anti-mouse PD-L1 or rat IgG2b isotype control antibodies. (E and F) Tumor volume (E) and tumor weight (F) in vivo allograft tumorigenesis assays of Vector+shluc, NSUN2-WT+shluc and NSUN2-WT+shTrex2 B16 cells inoculated in C57BL/6 mice (n = 5 animals/group), treated with anti-mouse PD-L1 or rat IgG2b isotype control antibodies. Data are mean ± SD. *, p < 0.05, **, p < 0.01, ***, p < 0.001, NS, non-significant by Student’s t-test (B, D, F) or by 2-way ANOVA (A, C, E). See also Figure S10.
Figure 7.
Figure 7.. Targeting The Glucose/NSUN2/TREX2 Axis Overcomes Anti-PD-L1 Immunotherapy Resistance through cGAS/STING Activation for Apoptosis and CD8+ T Cell Infiltration
(A, B, E, F, and G) Tumor volume (A), tumor weight (B), immunohistochemistry for p-STING (E), cleaved caspase-3 (F), and CD8 (G) in vivo allograft tumorigenesis assays of shluc, shNsun2, shNsun2+shSting, shTrex2, and shTrex2+shSting 4T1 cells injected in BALB/c mice (n = 5 animals/group), treated with anti-mouse PD-L1 or rat IgG2b isotype control antibodies. Scale bar, 50 μm. (C and D) Tumor volume (C) and tumor weight (D) in vivo allograft tumorigenesis assays of shluc, shNsun2, shNsun2+shSting, shTrex2, and shTrex2+shSting TRAMP-C2 cells injected in C57BL/6 mice (n = 5 animals/group), treated with anti-mouse PD-L1 or rat IgG2b isotype control antibodies. (H) Illustration of the glucose sensing mechanism by NSUN2, which serves as a glucose sensor whose activation by glucose drives m5C RNA methylation and mRNA stability of TREX2 leading to cGAS/STING repression and subsequent tumor promotion and immunotherapy resistance. Data are mean ± SD. *, p < 0.05, **, p < 0.01, ***, p < 0.001, NS, non-significant by Student’s t-test (B, D) or by 2-way ANOVA (A, C). See also Figure S11.

References

    1. Bhattacharya B, Mohd Omar MF, and Soong R.(2016). The Warburg effect and drug resistance. Br J Pharmacol 173, 970–979. 10.1111/bph.13422. - DOI - PMC - PubMed
    1. Dang CV (2012). Links between metabolism and cancer. Genes Dev 26, 877–890. 10.1101/gad.189365.112. - DOI - PMC - PubMed
    1. Koppenol WH, Bounds PL, and Dang CV (2011). Otto Warburg’s contributions to current concepts of cancer metabolism. Nat Rev Cancer 11, 325–337. 10.1038/nrc3038. - DOI - PubMed
    1. Ward PS, and Thompson CB (2012). Metabolic reprogramming: a cancer hallmark even warburg did not anticipate. Cancer Cell 21, 297–308. 10.1016/j.ccr.2012.02.014. - DOI - PMC - PubMed
    1. Szablewski L.(2013). Expression of glucose transporters in cancers. Biochim Biophys Acta 1835, 164–169. 10.1016/j.bbcan.2012.12.004. - DOI - PubMed

Publication types

LinkOut - more resources