. 2023 Oct 18;111(20):3288-3306.e4.
doi: 10.1016/j.neuron.2023.07.011. Epub 2023 Aug 15.

Neural dynamics in the limbic system during male social behaviors

Affiliations

Neural dynamics in the limbic system during male social behaviors

Zhichao Guo et al. Neuron. .

Abstract

Sexual and aggressive behaviors are vital for species survival and individual reproductive success. Although many limbic regions have been found relevant to these behaviors, how social cues are represented across regions and how the network activity generates each behavior remains elusive. To answer these questions, we utilize multi-fiber photometry (MFP) to simultaneously record Ca2+ signals of estrogen receptor alpha (Esr1)-expressing cells from 13 limbic regions in male mice during mating and fighting. We find that conspecific sensory information and social action signals are widely distributed in the limbic system and can be decoded from the network activity. Cross-region correlation analysis reveals striking increases in the network functional connectivity during the social action initiation phase, whereas late copulation is accompanied by a "dissociated" network state. Based on the response patterns, we propose a mating-biased network (MBN) and an aggression-biased network (ABN) for mediating male sexual and aggressive behaviors, respectively.

Keywords: aggression; estrogen receptor alpha expressing cells; limbic system; mice; multi-fiber photometric recording; sexual behaviors.


Conflict of interest statement

Declaration of interests The authors declare no competing interests.

Figures

Figure 1:
Figure 1:. Multi-fiber photometry (MFP) recording of 13 regions in the limbic system.
(A) Illustration showing the recorded regions in the mouse hypothalamus (blue), amygdala (green), and other brain areas (gray). (B) The optic fiber arrays overlaid on a mouse brain model showing various targeted structures. The model is from https://connectivity.brain-map.org/. (C) Diagram of the MFP recording system. (D) An animal with the implanted fiber arrays and a head-fixation ring. (E) The end of the optic fiber bundle image. (F) Experimental and each recording session timeline. (G) Simultaneously recorded GCaMP6f traces (ΔF/F) from a representative recording session. See also Figures S1-S4.
Figure 2:
Figure 2:. Broad activation of the expanded SBN during initial encounters with male and female intruders.
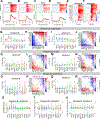
(A-D) Heatmaps (top) and PETHs (bottom) of Z scored ΔF/F signal of the VMHvl (A, B) and MeAa (C, D) aligned to the male and female intruder introduction from all recording animals. (E, F) Heatmaps showing average Z-scored ΔF/F aligned to male (E) and female (F) introduction across all recorded regions. (G, I) Average Z-scored ΔF/F during 0–30s after male (G) and female (I) introduction. n =13–25 animals. (H, J) Heatmaps showing the difference in average Z-scored ΔF/F during male (H) and female (J) introduction between each pair of regions. n = 21–61 sessions. (K, M) Average onset of responses upon male (K) and female (M) introduction. n =12-25 animals. (L, N) Heatmaps showing the difference in average response onset upon male (L) and female (N) introduction between each pair of regions. n = 17–59 sessions. (O, Q) Average latency to the peak response after male (O) and female (Q) introduction. n =13–25 animals. (P, R) Heatmaps showing the difference in average response peak time after male (P) and female (R) introduction between each pair of regions. n = 17–59 sessions. (S, T, U) Differences in response magnitude (Z scored ΔF/F) (S), onset time (T), and peak time (U) during the male and female introduction. n = 28–63 sessions. Shades in (A-D) and error bars in (G, I, S): Mean ± SEM; in (M, O, Q, T, U): Median ± 25%. Each gray circle in (G, I, K, M, O, Q) represents one animal. Each gray circle in (S-U) represents one recording session. Colored circles in (G, I, K, M, O, Q, S-U) represent the group average. Blue, green, and dark orange indicate hypothalamic regions, amygdala regions, and regions outside the hypothalamus and amygdala, respectively. (G, I, S, T, U): one sample t-test (if pass Lilliefors normality test) or Wilcoxon signed-rank test (if not pass Lilliefors normality test). (H, J, L, N, P, R): paired t-test (if pass Lilliefors normality test) or Wilcoxon signed-rank test (if not pass Lilliefors normality test). (G-U) p values are adjusted with Benjamini Hochberg procedure for controlling the false discovery rate. *p<0.05; **p<0.01; ***p<0.001. Black: significantly >0; Green: significantly <0; See Table S1 for raw data and detailed statistics. See also Figures S4-S7 and S14.
Figure 3:
Figure 3:. The same regions are activated during male and female investigation but with distinct patterns.
(A-D) Heatmaps (top) and PETHs (bottom) of Z scored ΔF/F signal of the AHN (A-B) and VMHvl (C-D) aligned to the investigation of male (A) and female (B) intruders from all recording animals. Horizontal bars indicate investigation duration (mean ± SEM). (E-F) Heatmaps showing average Z-scored ΔF/F aligned to the investigation of male (E) and female (F) intruders across all regions. Horizontal bars indicate investigation duration (mean ± SEM). (G, I) Average Z-scored ΔF/F during the investigation of male (G) and female (I) intruders. n =13–25 animals. (H, J) Heatmaps showing the difference in average Z-scored ΔF/F during male (H) and female (J) investigation between each pair of regions. n = 19–60 sessions. (K) Differences in response magnitude (Z-scored ΔF/F) during the male and female investigation. n = 31–59 sessions. (L) The response magnitude during male and female investigation is uncorrelated. n=10 responsive regions. (M, P) Representative simultaneously recorded Ca2+ traces of MeAa and PMv Esr1 cells during investigating male (M) and female (P) intruders. (N, Q) The response latency during male (N) and female investigation (Q) of all responsive regions. n = 13–25 animals. (O, R) Heatmaps showing the difference in average response onset during male (O) and female (R) investigation between each pair of regions. n = 32–345 trials. (S) Differences in response onset during the male and female investigation. n = 21–39 sessions. All error bars and shades in PETHs: Mean ± SEM; Each gray circle in (G, I, N, Q) represents one animal. Each gray circle in (K, S) represents one recording session. Colored circles in (G, I, K, L, N, Q, S) represent the group average. Blue, green, and dark orange indicate hypothalamic regions, amygdala regions, and other regions, respectively. (G, I, K, N, Q, S) one sample t-test (if pass Lilliefors normality test) or Wilcoxon signed-rank test (if not pass Lilliefors normality test). (H, J, O, R) paired t-test (if pass Lilliefors normality test) or Wilcoxon signed-rank test (if not pass Lilliefors normality test). (G-K, N, O, Q-S) p values are adjusted with Benjamini Hochberg procedure for controlling the false discovery rate. *p<0.05; **p<0.01; ***p<0.001. Black: significantly >0; Green: significantly <0; L: Pearson’s cross-correlation. See Table S1 for raw data and detailed statistics. See also Figures S4-S7 and S14.
Figure 4:
Figure 4:. Distinct activation patterns in the expanded SBN during male aggressive and sexual behaviors.
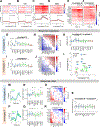
(A-B) Heatmaps showing average Z scored ΔF/F aligned to attack (A) and various phases of sexual behaviors (B) across all recorded regions. Horizontal bars indicate the average duration of the behavior episodes (mean ± SEM). (C, E) Average Z scored ΔF/F during attack (C) and mount (E). n =8–24 animals. (D, F) Heatmaps showing differences in average Z scored ΔF/F during attack (D) and mount (F) between each pair of regions. n = 11–55 sessions. (G-I) Average Z scored ΔF/F during shallow thrust (G), deep thrust (H), and ejaculation (I). n =12–25 animals. (J) The average Z scored ΔF/F during various stages of male sexual behaviors across regions. (K) The response magnitude during attack and mount is uncorrelated. n=12 regions that are responsive during at least one behavior. (L, O) Representative simultaneously recorded Ca2+ traces of VMHvl and lPAG Esr1 cells during attack (L) and MeAa and MPN Esr1 cells during mount (O). (M, P) The response latency during attack (M) and mount (P) of responsive regions. n = 8–23 animals. (N, Q) Heatmap showing the difference in average response onset during attack (N) and mount (Q) between each pair of regions. n = 23–260 trials. All error bars and shades of PETHs: Mean ± SEM; Each gray circle in (C, E, G, H, I, M, and P) represents one animal. Colored circles in (C, E, G, H, I, K, M, and P) represent the group average. Blue, green, and dark orange indicate hypothalamic regions, amygdala regions, and other regions, respectively. (C, E, G-I, M, P) one sample t-test (if pass Lilliefors normality test) or Wilcoxon signed-rank test (if not pass Lilliefors normality test). (D, F, N, and Q) paired t-test (if pass Lilliefors normality test) or Wilcoxon signed-rank test (if not pass Lilliefors normality test). (C-I, M, N, P, Q) p values are adjusted with Benjamini Hochberg procedure for controlling the false discovery rate. *p<0.05; **p<0.01; ***p<0.001. Black: significantly >0; Green: significantly <0; I: Pearson’s cross-correlation. See Table S1 for raw data and detailed statistics. See also Figures S4, S6, S7 and S14.
Figure 5.
Figure 5.. Activities in MBN and ABN predict male sexual and aggressive behaviors, respectively.
(A) Heat map showing the average Z scored ΔF/F during male- and female-directed social behaviors across regions in male mice. “Other M” and “Other F” refer to periods when the male or female intruder is present, but no specific social behavior is annotated. Inv: investigate; S Thrust: shallow thrust; D Thrust: deep thrust. (B) The variance in responses during different behaviors explained by the first 6 PCs. (C) The loading (coefficient) of the first 4 PCs. (D) The scores of the first 4 PCs for each region. (E) Confusion matrix shows the number of frames that are correctly and incorrectly classified for each behavior across all sessions. Left columns show the precision (blue) and false discovery rate (FDR, orange). Bottom rows show the recall (blue) and false negative rate (FNR, orange). (F) F1 scores of various behaviors computed using full models that include data from all recording regions, non-MBN models, non-ABN models, and models built with time-shifted data. Error bar: mean ± SEM. Paired t-test (if pass Lilliefors normality test) or Wilcoxon signed-rank test (if not pass Lilliefors normality test). All comparisons have p values < 0.05 unless marked. ns: not significant. n = 17–24 animals. (G) Heatmap showing the averaged decrease in F1 score when using non-MBN and non-ABN models compared to the full model. See Table S1 for raw data and detailed statistics. See also Figure S8 and S14.
Figure 6.
Figure 6.. Changes in the VMHvl and PMv functional connectivity during social behaviors.
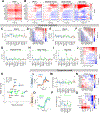
(A) The procedure to calculate R2 between a pair of regions during various behaviors. (B) Differential Z scored ΔF/F traces of VMHvl (black) and PMv (green) (top) and their moment-to-moment R2 (bottom) from a representative recording session. Shades indicate behavior episodes. (C) Heatmaps (top) and PETHs (bottom) aligned to the onset of male investigation (left), attack (middle), and deep thrust (right). It is from the same recording session shown in B. (D) Average R2 between VMHvl and PMv during various behaviors in the recording session shown in (B, C). n = 1–86 trials. Base: pre-intruder period. Other: With intruder but no specific social behaviors. Inv: investigate; S Thrust: shallow thrust; D Thrust: deep thrust. Kruskal-Wallis test followed by Benjamini Hochberg procedure for controlling the false discovery rate. (E-M) The distribution of R2 at the pre-intruder baseline (orange) and during specific behavior epochs (blue). Black and red dashed lines indicate the median values of the R2 during the baseline and behavior periods. Baseline and behavior sessions are matched. Paired t-test (if pass Lilliefors normality test) or Wilcoxon signed-rank test (if not pass Lilliefors normality test). Error bars and shades of PETHs: Mean ± SEM. *p<0.05; **p<0.01; ***p<0.001. See Table S1 for raw data and detailed statistics. See also Figure S9.
Figure 7.
Figure 7.. Changes in functional connectivity across the expanded SBN during social behaviors.
(A) Heatmap shows the average R2 of all pairs of regions during various behavior epochs and its comparison to the R2 values during the baseline period. Base: pre-intruder period. Other: with intruder but no specific social behaviors. Inv: investigate; S Thrust: shallow thrust; D Thrust: deep thrust. Paired t-test (if pass Lilliefors normality test) or Wilcoxon signed-rank test (if not pass Lilliefors normality test). p values are adjusted using with Benjamini Hochberg procedure for controlling the false discovery rate. *q<0.05; **q<0.01; ***q<0.001. Black and white: significantly increase and decrease from baseline, respectively. (B-K) Graph plots showing the strength of functional connectivity (R2) among different regions during various social behavior epochs. Only connections with R2> 0.1 are shown. The size of a node reflects its overall connection strength. (L) The averaged change of R2 of each region with all other regions during various behaviors. (M) The number of pairs of regions that show significantly increased R2 (red) or decreased R2 (blue) from the pre-intruder baseline. (N) Change in R2 values from the pre-intruder baseline for significantly changed connections. Red and blue show the mean ± SEM of significantly increased and decreased connections during each behavior. n = 0–72 pairs of regions. See Table S1 for raw data and detailed statistics. See also Figures S10-S14.

References

    1. Newman SW (1999). The medial extended amygdala in male reproductive behavior. A node in the mammalian social behavior network. Ann N Y Acad Sci 877, 242–257. 10.1111/j.1749-6632.1999.tb09271.x. - DOI - PubMed
    1. Goodson JL (2005). The vertebrate social behavior network: evolutionary themes and variations. Horm Behav 48, 11–22. 10.1016/j.yhbeh.2005.02.003. - DOI - PMC - PubMed
    1. Yang T, Yang CF, Chizari MD, Maheswaranathan N, Burke KJ Jr., Borius M, Inoue S, Chiang MC, Bender KJ, Ganguli S, and Shah NM (2017). Social Control of Hypothalamus-Mediated Male Aggression. Neuron 95, 955–970 e954. 10.1016/j.neuron.2017.06.046. - DOI - PMC - PubMed
    1. Hashikawa K, Hashikawa Y, Tremblay R, Zhang J, Feng JE, Sabol A, Piper WT, Lee H, Rudy B, and Lin D (2017). Esr1+ cells in the ventromedial hypothalamus control female aggression. Nat Neurosci. 10.1038/nn.4644. - DOI - PMC - PubMed
    1. Falkner AL, Grosenick L, Davidson TJ, Deisseroth K, and Lin D (2016). Hypothalamic control of male aggression-seeking behavior. Nat Neurosci 19, 596–604. 10.1038/nn.4264. - DOI - PMC - PubMed

Publication types

LinkOut - more resources