

An evolutionarily nascent architecture underlying the formation and emergence of biomolecular condensates
- PMID: 37586369
- PMCID: PMC10529244
- DOI: 10.1016/j.celrep.2023.112955
An evolutionarily nascent architecture underlying the formation and emergence of biomolecular condensates
Abstract
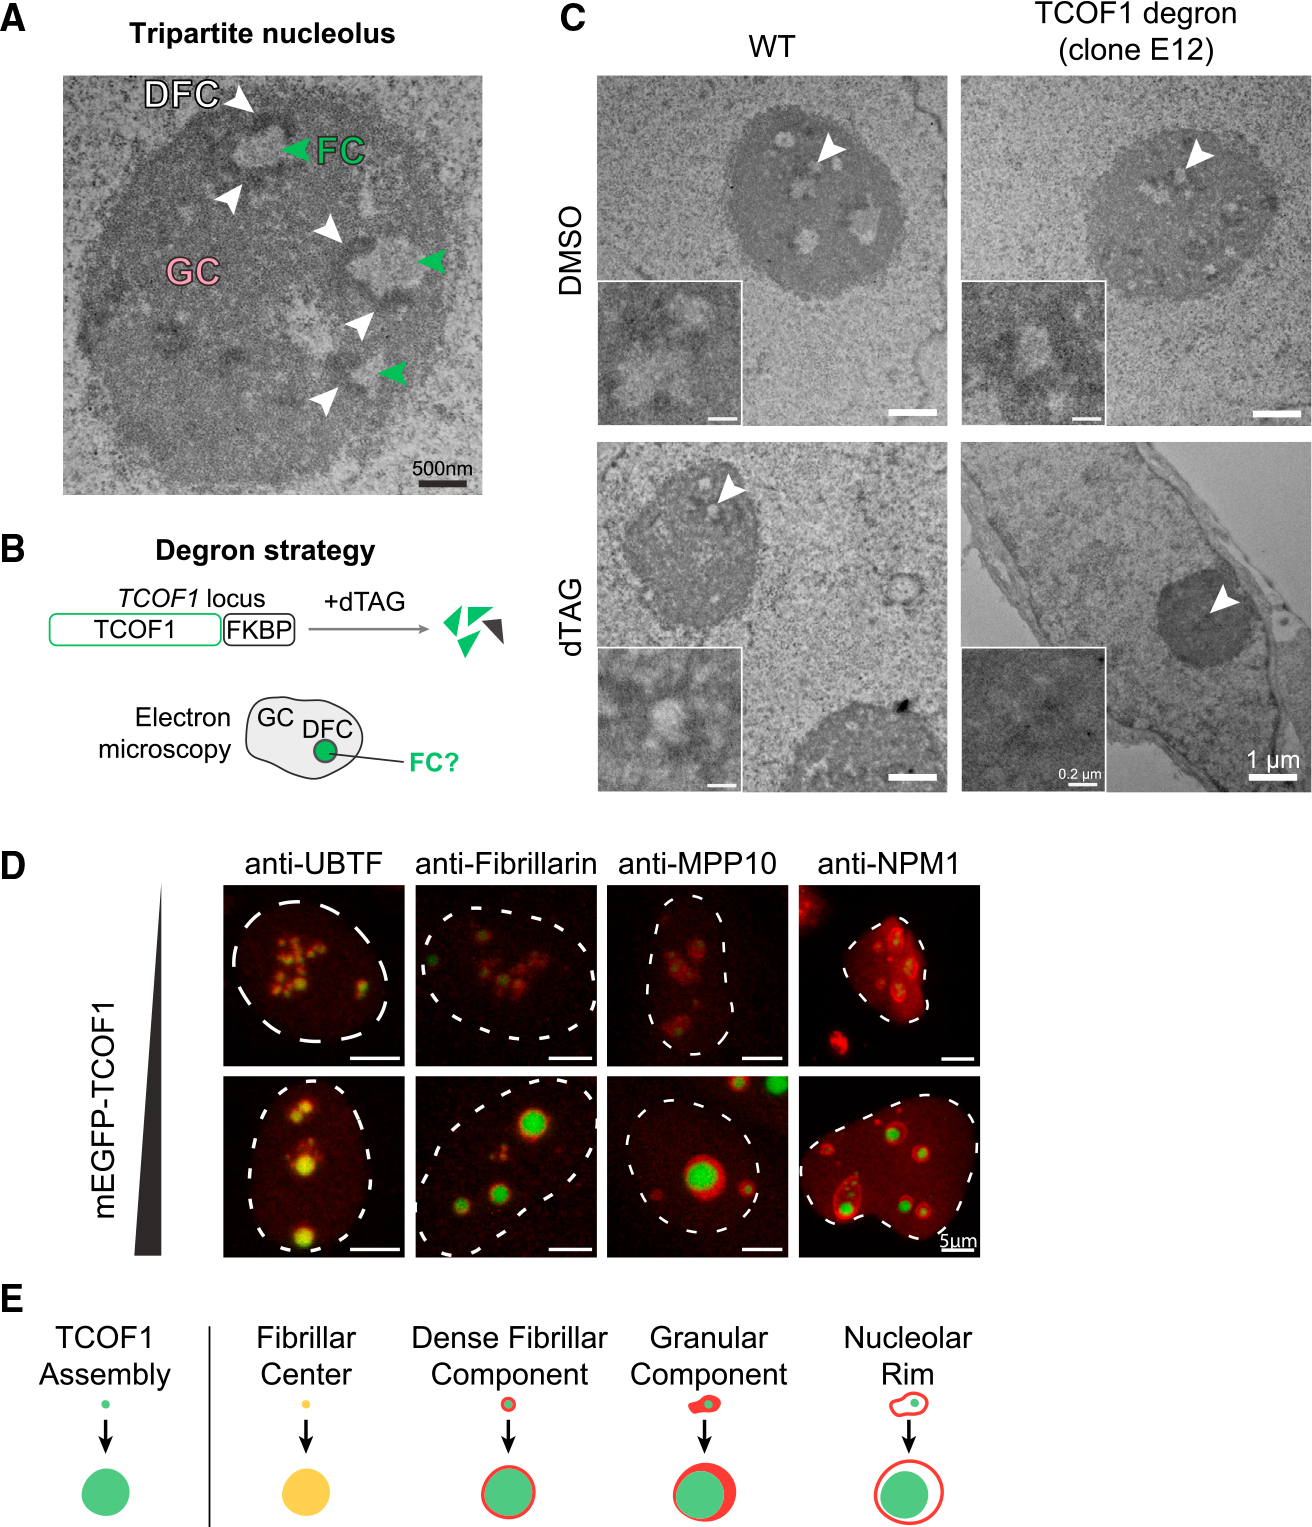
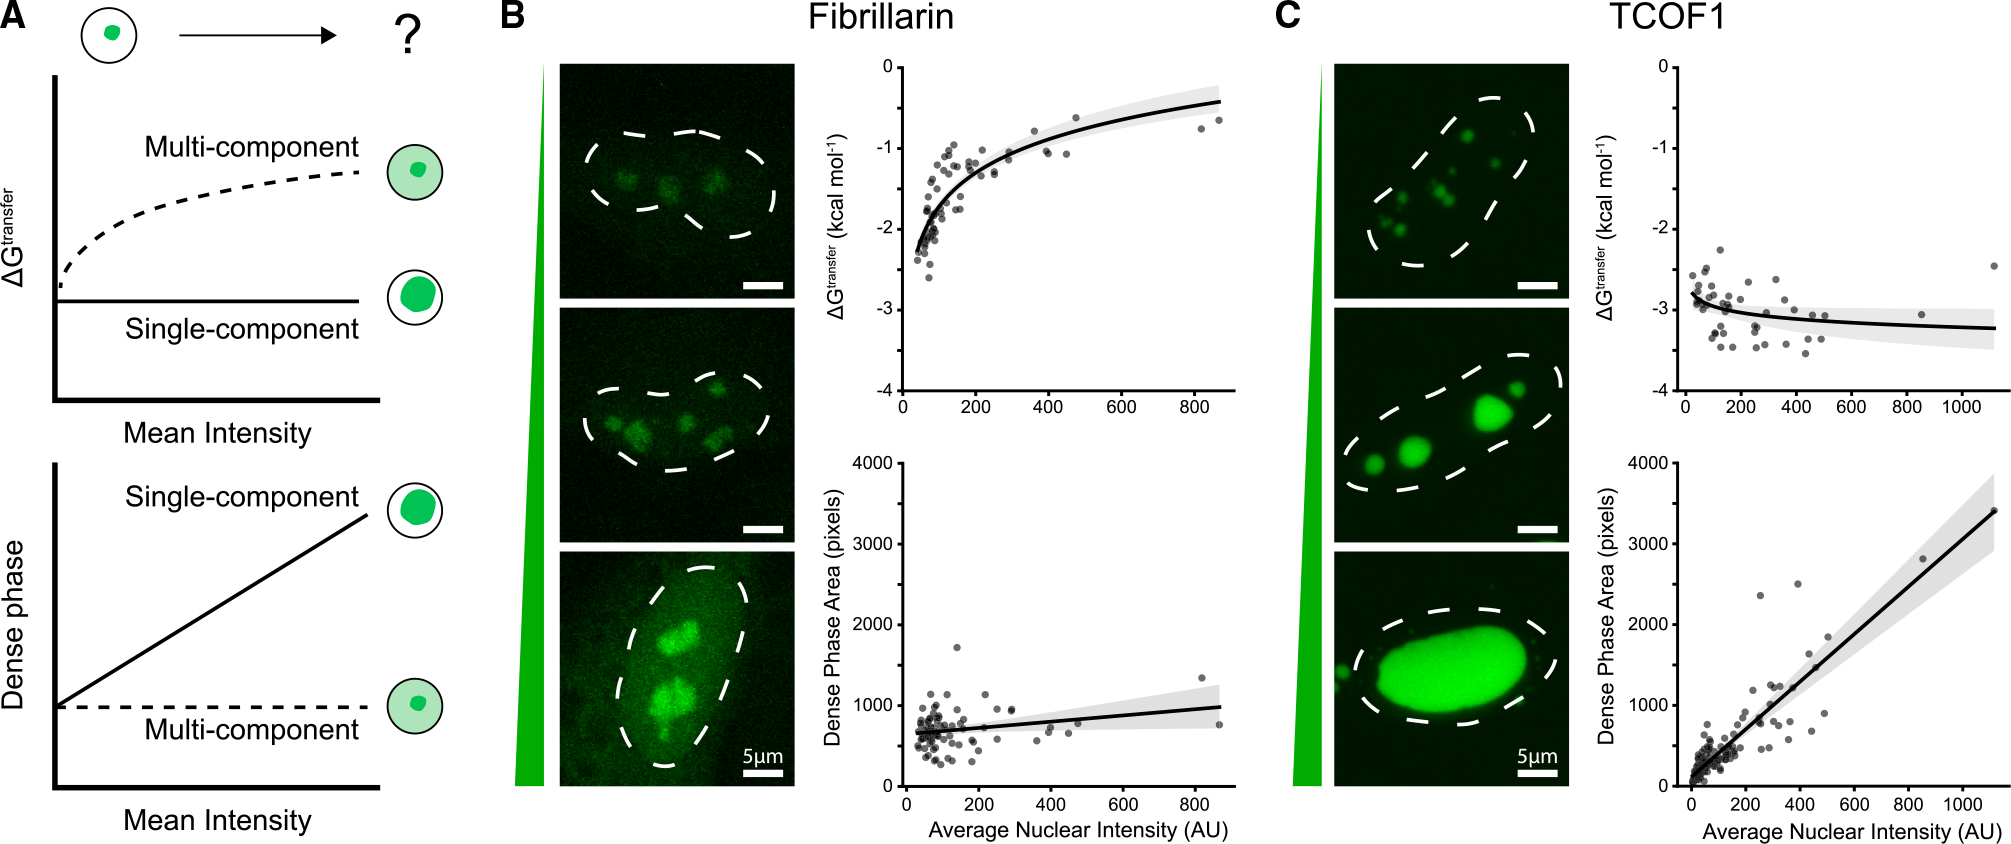
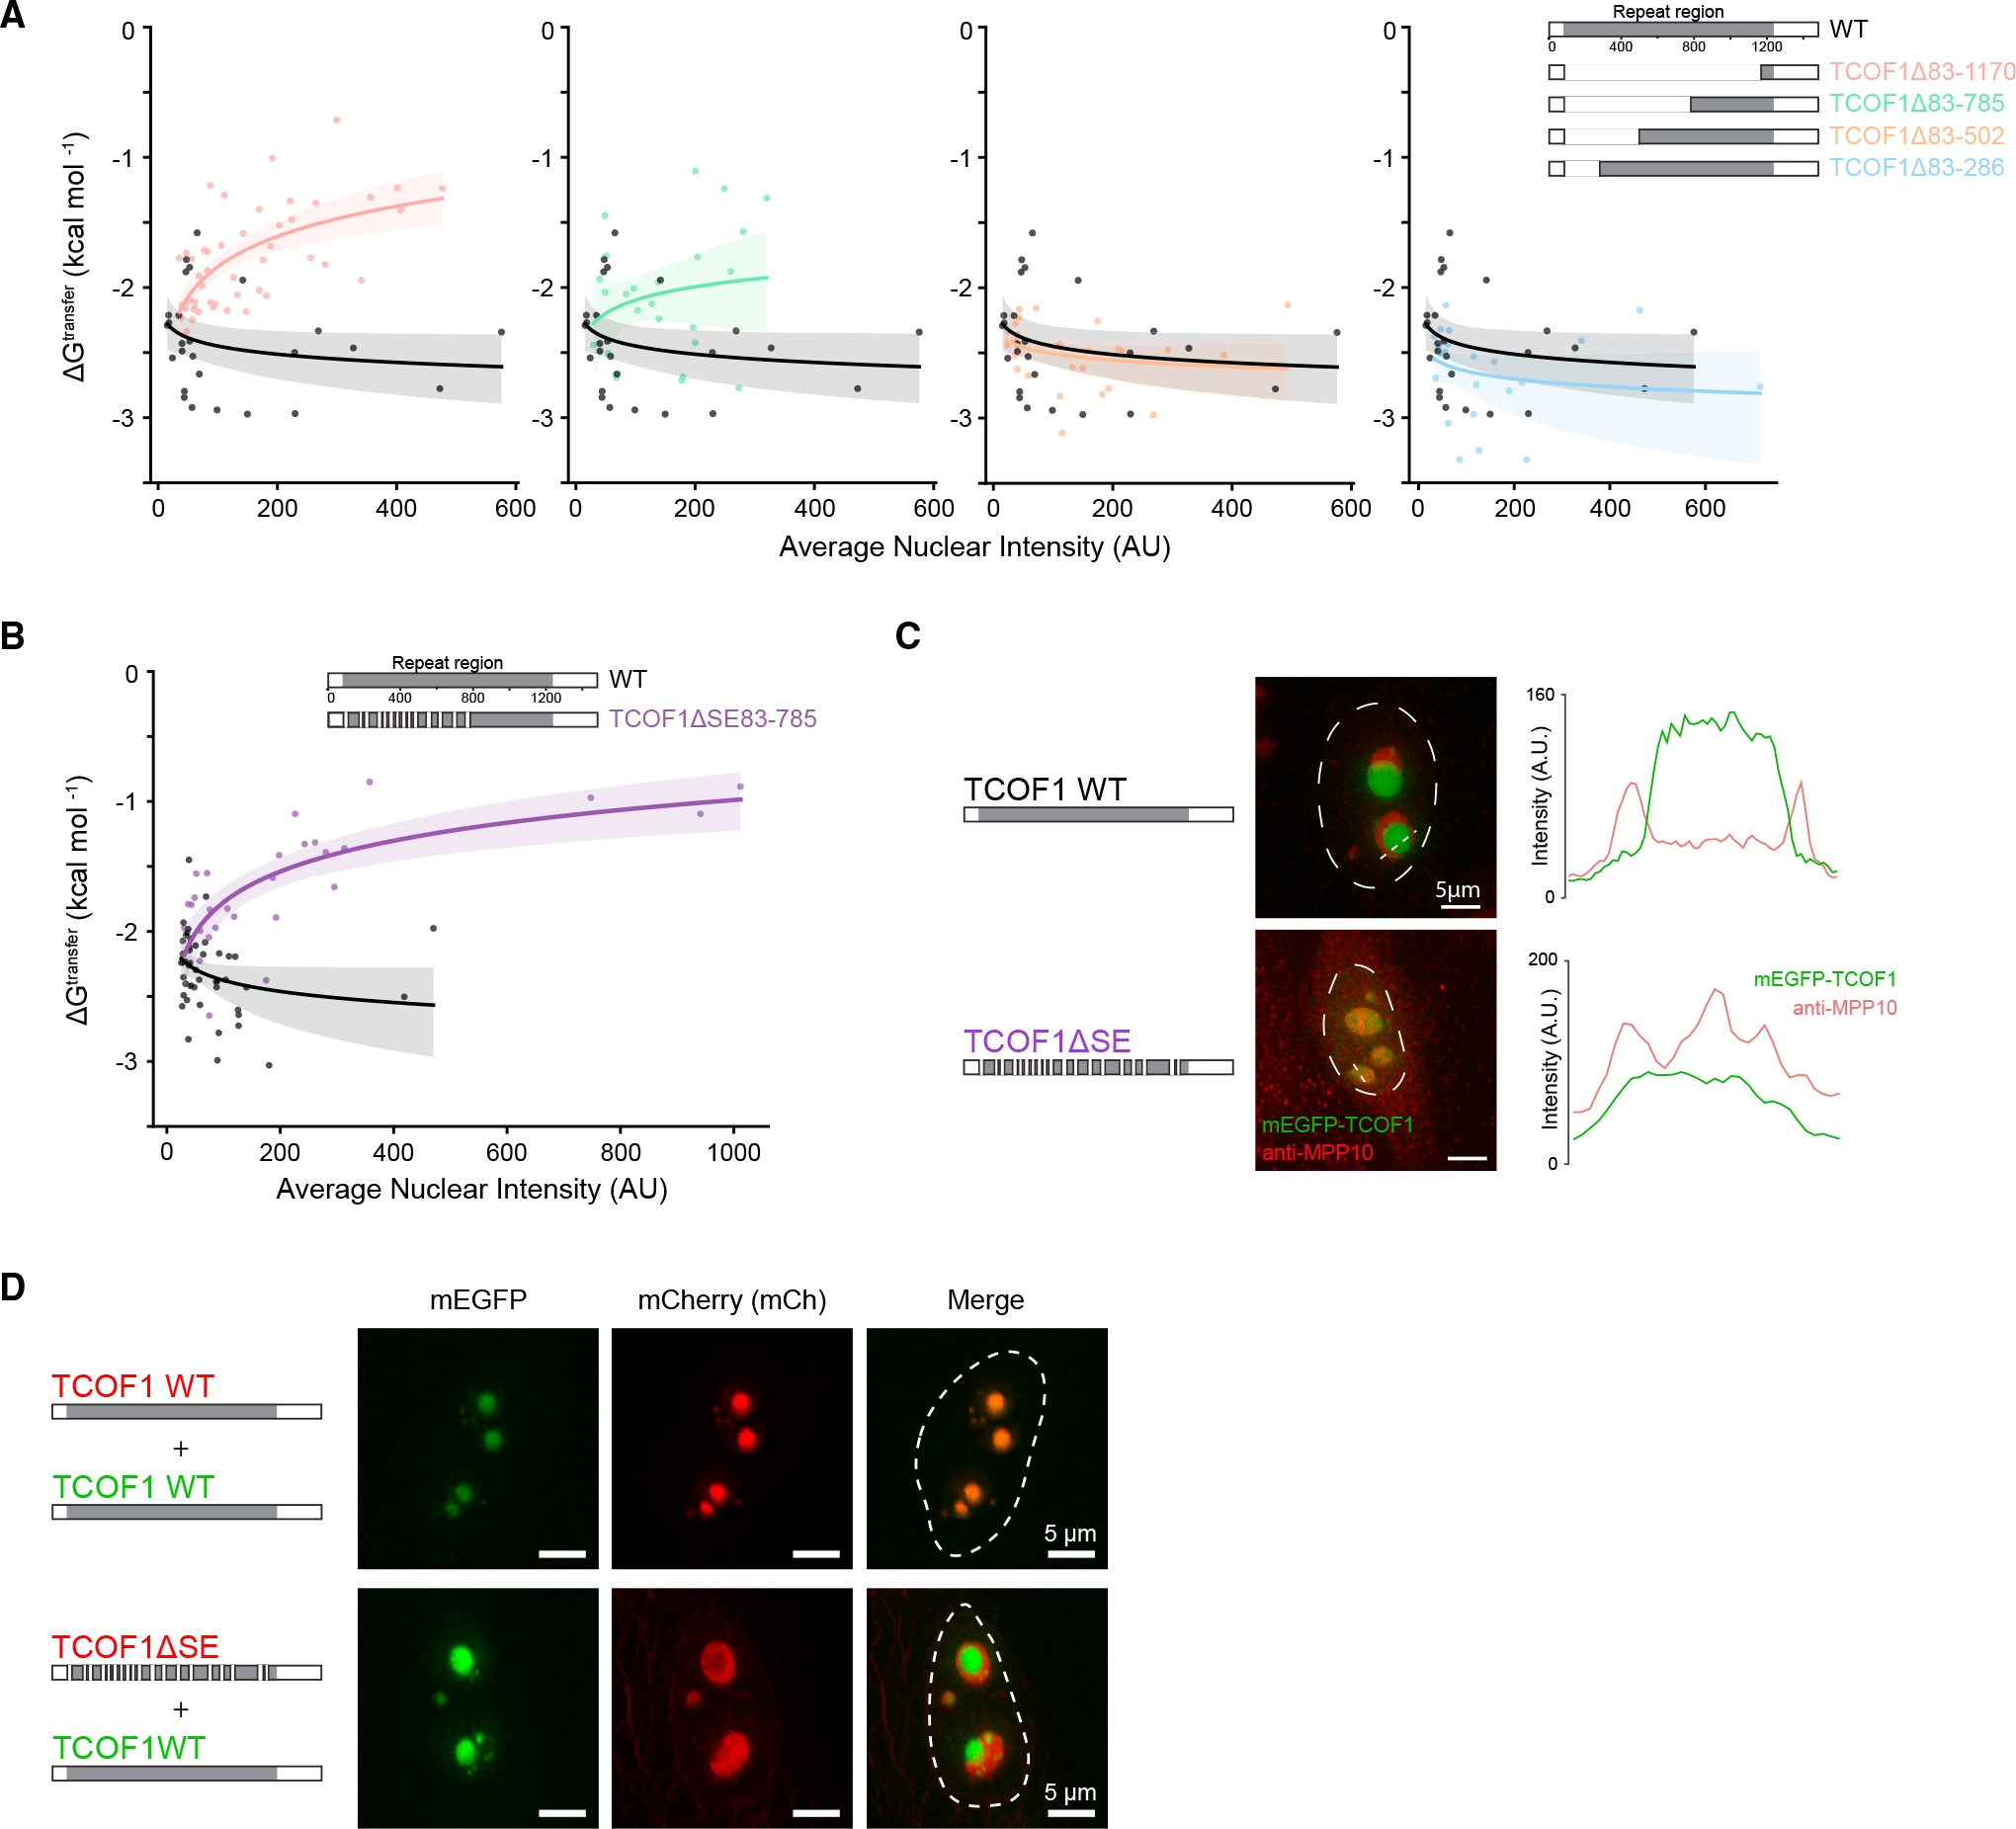
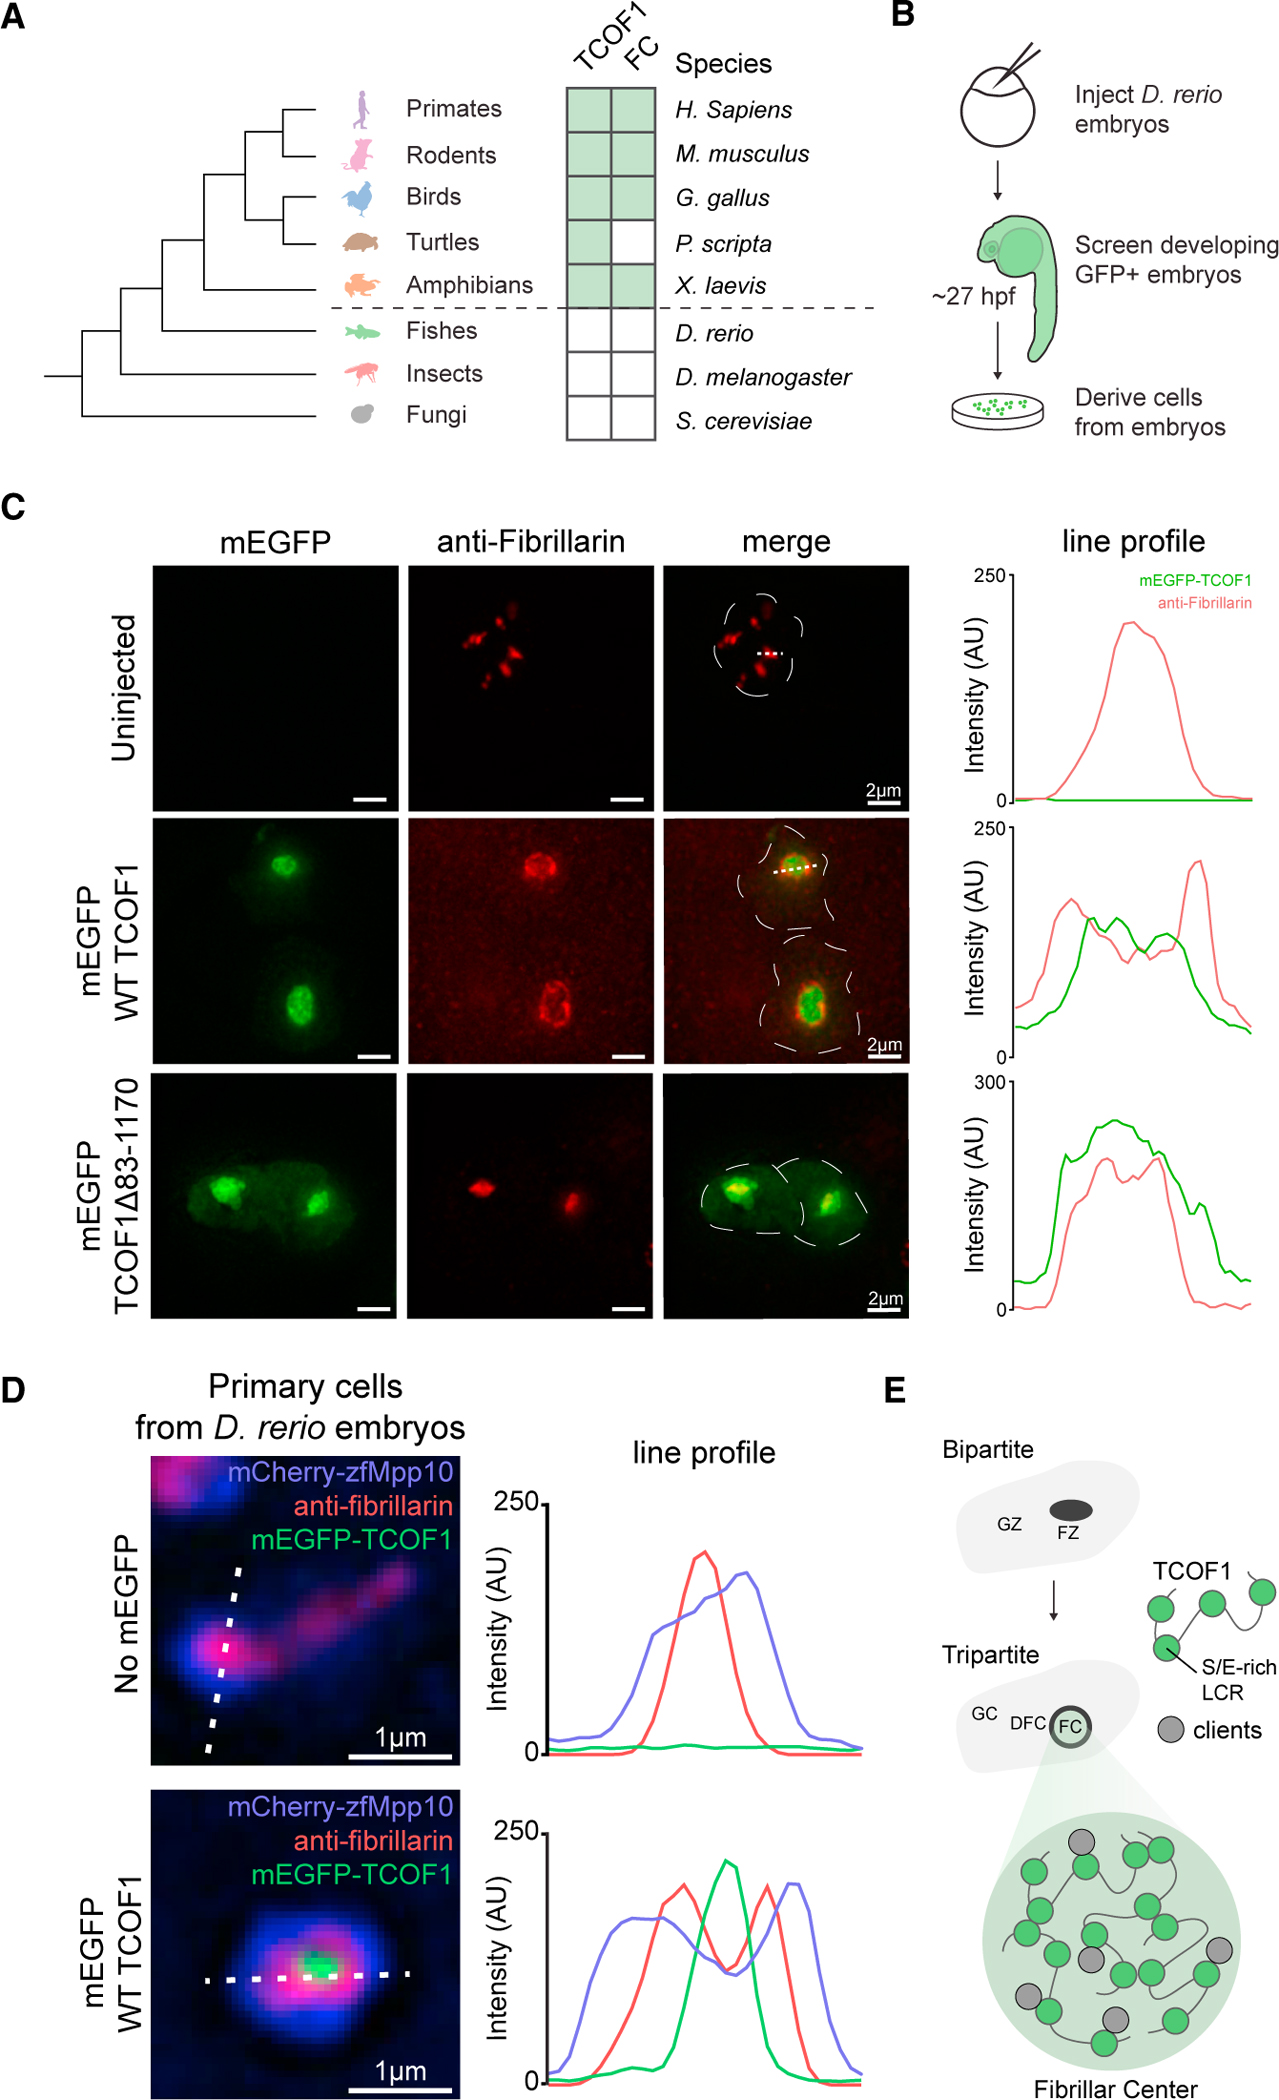
Biomolecular condensates are implicated in core cellular processes such as gene regulation and ribosome biogenesis. Although the architecture of biomolecular condensates is thought to rely on collective interactions between many components, it is unclear how the collective interactions required for their formation emerge during evolution. Here, we show that the structure and evolution of a recently emerged biomolecular condensate, the nucleolar fibrillar center (FC), is explained by a single self-assembling scaffold, TCOF1. TCOF1 is necessary to form the FC, and it structurally defines the FC through self-assembly mediated by homotypic interactions of serine/glutamate-rich low-complexity regions (LCRs). Finally, introduction of TCOF1 into a species lacking the FC is sufficient to form an FC-like biomolecular condensate. By demonstrating that a recently emerged biomolecular condensate is built on a simple architecture determined by a single self-assembling protein, our work provides a compelling mechanism by which biomolecular condensates can emerge in the tree of life.
Keywords: CP: Cell biology; CP: Molecular biology; biophysics; condensates; evolution; low-complexity regions; nucleolus; phase separation; scaffolds; self-assembly.
Copyright © 2023 The Author(s). Published by Elsevier Inc. All rights reserved.
Conflict of interest statement
Declaration of interests B.L. is currently affiliated with Sequome, Inc.
Figures
Similar articles
-
Treacle's ability to form liquid-like phase condensates is essential for nucleolar fibrillar center assembly, efficient rRNA transcription and processing, and rRNA gene repair.Elife. 2025 Apr 14;13:RP96722. doi: 10.7554/eLife.96722. Elife. 2025. PMID: 40223701 Free PMC article.
-
Structured protein domains enter the spotlight: modulators of biomolecular condensate form and function.Trends Biochem Sci. 2025 Mar;50(3):206-223. doi: 10.1016/j.tibs.2024.12.008. Epub 2025 Jan 17. Trends Biochem Sci. 2025. PMID: 39827079 Review.
-
Protein compactness and interaction valency define the architecture of a biomolecular condensate across scales.Elife. 2023 Jul 20;12:e80038. doi: 10.7554/eLife.80038. Elife. 2023. PMID: 37470705 Free PMC article.
-
Stress-related biomolecular condensates in plants.Plant Cell. 2023 Sep 1;35(9):3187-3204. doi: 10.1093/plcell/koad127. Plant Cell. 2023. PMID: 37162152 Free PMC article.
-
Sequence variations of phase-separating proteins and resources for studying biomolecular condensates.Acta Biochim Biophys Sin (Shanghai). 2023 Jul 18;55(7):1119-1132. doi: 10.3724/abbs.2023131. Acta Biochim Biophys Sin (Shanghai). 2023. PMID: 37464880 Free PMC article. Review.
Cited by
-
Pre-rRNA spatial distribution and functional organization of the nucleolus.Nature. 2025 Jul 23. doi: 10.1038/s41586-025-09412-1. Online ahead of print. Nature. 2025. PMID: 40701178
-
Macromolecular condensation organizes nucleolar sub-phases to set up a pH gradient.Cell. 2024 Apr 11;187(8):1889-1906.e24. doi: 10.1016/j.cell.2024.02.029. Epub 2024 Mar 18. Cell. 2024. PMID: 38503281 Free PMC article.
-
Active RNA synthesis patterns nuclear condensates.bioRxiv [Preprint]. 2024 Oct 13:2024.10.12.614958. doi: 10.1101/2024.10.12.614958. bioRxiv. 2024. PMID: 39498261 Free PMC article. Preprint.
-
Untangling Zebrafish Genetic Annotation: Addressing Complexities and Nomenclature Issues in Orthologous Evaluation of TCOF1 and NOLC1.J Mol Evol. 2024 Dec;92(6):744-760. doi: 10.1007/s00239-024-10200-0. Epub 2024 Sep 13. J Mol Evol. 2024. PMID: 39269459
-
Emergent microenvironments of nucleoli.Nucleus. 2024 Dec;15(1):2319957. doi: 10.1080/19491034.2024.2319957. Epub 2024 Mar 5. Nucleus. 2024. PMID: 38443761 Free PMC article. Review.
References
-
- Boija A, Klein IA, Sabari BR, Dall’Agnese A, Coffey EL, Zamudio AV, Li CH, Shrinivas K, Manteiga JC, Hannett NM, et al. (2018). Transcription Factors Activate Genes through the Phase-Separation Capacity of Their Activation Domains. Cell 175, 1842–1855.e16. 10.1016/j.cell.2018.10.042. - DOI - PMC - PubMed
Publication types
MeSH terms
Substances
Grants and funding
LinkOut - more resources
Full Text Sources
Miscellaneous
