. 2023 Dec;36(12):e5021.
doi: 10.1002/nbm.5021. Epub 2023 Aug 16.

Map-based B0 shimming for single voxel brain spectroscopy at 7T

Affiliations

Map-based B0 shimming for single voxel brain spectroscopy at 7T

Jullie W Pan et al. NMR Biomed. 2023 Dec.

Abstract

While B0 shimming is an important requirement for in vivo brain spectroscopy, for single voxel spectroscopy (SVS), the role for advanced shim methods has been questioned. Specifically, with the small spatial dimensions of the voxel, the extent to which inhomogeneities higher than second order exist and the ability of higher order shims to correct them is controversial. To assess this, we acquired SVS from two loci of neurophysiological interest, the rostral prefrontal cortex (rPFC; 8 cc) and hippocampus (Hc; 9 cc). The rPFC voxel was placed using SUsceptibility Managed Optimization (SUMO) and an initial B0 map that covers the entire cerebrum to cerebellum. In each location, we compared map-based shimming (Bolero) with projection-based shimming (FAST(EST)MAP). We also compared vendor-provided spherical harmonic first- and second-order shims with additional third- and fourth-order shim hardware. The 7T SVS acquisition used stimulated echo acquisition mode (STEAM) TR/TM/TE of 6 s/20 ms/8 ms, a tissue water acquisition for concentration reference, and LCModel for spectral analysis. In the rPFC (n = 7 subjects), Bolero shimming with first- and second-order shims reduced the residual inhomogeneity σ B 0 from 9.8 ± 4.5 Hz with FAST(EST)MAP to 6.5 ± 2.0 Hz. The addition of third- and fourth-order shims further reduced σ B 0 to 4.0 ± 0.8 Hz. In the Hc (n = 7 subjects), FAST(EST)MAP, Bolero with first- and second-order shims, and Bolero with first- to fourth-order shims achieved σ B 0 values of 8.6 ± 1.9, 5.6 ± 1.0, and 4.6 ± 0.9 Hz, respectively. The spectral linewidth, Δ v σ B 0 , was estimated with a Voigt lineshape using σ B 0 and T2 = 130 ms. Δ v σ B 0 significantly correlated with the Cramer-Rao lower bounds and concentrations of several metabolites, including glutamate and glutamine in the rPFC. In both loci, if the B0 distribution is well described by a Gaussian model, the variance of the metabolite concentrations is reduced, consistent with the LCModel fit based on a unimodal lineshape. Overall, the use of the high order and map-based B0 shim methods improved the accuracy and consistency of spectroscopic data.

Keywords: 7T; CRLB; linewidth; shimming; spectroscopy; spherical harmonic.


Conflict of interest statement

CONFLICT OF INTEREST STATEMENT

H. P. Hetherington PhD is an employee of Resonance Research Inc., who is the vendor of the high order shim coil and RF coil. H. P. Hetherington is also Adjunct Professor of Radiology at University of Missouri Columbia.

Figures

FIGURE 1
FIGURE 1
(A) MP2RAGE images showing the positioning of the location for the rostral prefrontal cortex voxel using SUsceptibility Managed Optimization (SUMO). The red box indicates the initial target location; the yellow box is the acceptable target region; and the green box is the SUMO-determined optimum position. The optimum position is selected based on a user-determined threshold, σB0<5Hz. In this example, the measured σB0 and the predicted σB0 after first- to fourth-order shimming at the initial location were 38.4 and 7.1 Hz, respectively. SUMO identified a location 4.24 mm away (3 mm in the superior and posterior directions) from the initial position with a predicted value of σB0=4.2Hz. The measured σB0 before and after first- to fourth-order shimming at this location was 34.5 and 3.9 Hz, respectively. (B) Positioning of the location for the hippocampal voxel along the temporal plane is determined by its well-known landmarks. MP2RAGE, magnetization-prepared 2 rapid gradient echo; σB0, standard deviation of the measured B0 map distribution from the selected voxel.
FIGURE 2
FIGURE 2
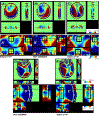
(A–C) rPFC B0 maps from a single subject after shimming with (A) Bolero first and second, (B) FAST(EST)MAP first and second, and (C) Bolero first to fourth. (D and E) Hc B0 maps from a single subject (D) FAST(EST)MAP first and second, and (E) Bolero first to fourth. Each panel (A–E) shows the axial, sagittal, and coronal views of the B0 maps (scale ±100 Hz) with magnified (panels A’–E’, scale ±25 Hz) views of the same data. The color scales are shown on the right. Hc, hippocampus; rPFC, rostral prefrontal cortex.
FIGURE 3
FIGURE 3
Histogram plots of the residual B0 field after shimming from voxels obtained with different shim conditions from the (A) rPFC and (B) Hc. The data were acquired in four separate sessions (#1–#4). Bolero and FAST(EST)MAP data from the same session were acquired from the same location. For each plot, the σB0 and σG are reported; the dashed black lines show the Gaussian lineshape with the indicated value of σG fitted to the histogram data. Hc, hippocampus; rPFC, rostral prefrontal cortex; σB0, standard deviation of the measured B0 map distribution from the selected voxel (in Hz); σG, center bandwidth of a Gaussian model of the measured B0 map distribution (in Hz).
FIGURE 4
FIGURE 4
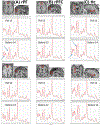
(A–C) Fitted spectra are shown from six paired datasets. With each column (A)–(C) of shim condition and locus, two different subjects are shown, with T1 MP2RAGE axial and sagittal images identifying the locus (red box) of acquisition. (A) rPFC acquired with Bolero first to fourth and FM first and second, (B) rPFC acquired with Bolero first and second and FM first and second, and (C) Hc spectra acquired with Bolero first to fourth and FM first and second. There are differences between the rPFC and Hc spectra; two of these differences are indicated with arrows at 3.75 ppm (summed amino acids) and choline (3.2 ppm). FM, FAST(EST)MAP; Hc, hippocampus; MP2RAGE, magnetization-prepared 2 rapid gradient echo; rPFC, rostral prefrontal cortex.
FIGURE 5
FIGURE 5
Correlations of ΔvLCM with calculated Voigt linewidths (A) ΔvσG and (B) ΔvσB0. The regressions shown were taken without any offset, that is, y=kx (both x and y parameters are measures of linewidth) and were all significant. The diagonal (black solid line) indicates the line of equality (ΔvLCM equals ΔvσG or ΔvσB0). These data show that ΔvLCM is well matched to ΔvσG for most of the data, while ΔvLCM matches ΔvσB0 primarily where ΔvσB0 is small, and where σB0 is small. The black circled markers of corresponding color identify the Bolero first to fourth shimmed data. Hc, hippocampus; RMSE, root-mean-square error; rPFC, rostral prefrontal cortex; SE, standard error; ΔvLCM, LCModel-estimated spectral linewidth (in Hz); ΔvσB0, Voigt linewidth estimated by using σB0 (in Hz); ΔvσG, Voigt linewidth estimated by using σG (in Hz); σB0, standard deviation of the measured B0 map distribution from the selected voxel (in Hz); σG, center bandwidth of a Gaussian model of the measured B0 map distribution (in Hz).
FIGURE 6
FIGURE 6
Regressions between LCM and shim parameters. (A and B) rPFC relationships between ΔvLCM with (A) CRLB, and (B) CSF-corrected tissue concentrations for Ins, Gln, and Glu. (C and D) rPFC correlations between ΔvσB0 with (C) CRLB, and (D) CSF-corrected tissue concentrations. (E) Hc correlations between ΔvσB0 with CRLB. Other Hc regressions for individual metabolites were not significant and thus are not shown. (F and G) rPFC and Hc correlations between the total scaled signal and (F) ΔvσB0, and (G) ΔvLCM. For all panels, the significant regressions are identified with their R2 values and linear equations. If the data are not significantly correlated, the regression line is not shown. In (B) and (D), the regression with Gln shows that a narrower linewidth correlates with less Gln concentration. Note that for (E), with the limited CRLB values (integer %), the Bolero first to fourth group data for Glu %SD CRLB values substantially overlap the Ins %SD CRLB values and are not visible. The black circled markers of corresponding color identify Bolero first to fourth shimmed data. CRLB, Cramer–Rao lower bound; CSF, cerebrospinal fluid; Gln, glutamine; Glu, glutamate; Hc, hippocampus; Ins, myo-inositol; LCM, LCModel, linear combination model software used for spectral fitting; rPFC, rostral prefrontal cortex; ΔvLCM, LCModel-estimated spectral linewidth; ΔvσB0, Voigt linewidth estimated by using σB0; σB0, standard deviation of the measured B0 map distribution from the selected voxel.
FIGURE 7
FIGURE 7
(A and B) Histograms (1.5 Hz bins) of the measured B0 field across an rPFC voxel superimposed with the LCModel-fitted lineshape (solid line) after Bolero first- to fourth-order and FAST(EST)MAP shimming from matched voxels. The maximum value of the LCModel lineshape was centered on and scaled to be equal to the maximum value of the histogram. (C) The summed total signal (all metabolite signal scaled for proton multiplicity, macromolecule, and lipid content) SrPFC and SHc are plotted against fG. The variances for total signal in both the rPFC and Hc increase as fG declines. With a dividing threshold value for fG=2.0, the mean and standard deviations for fG and total signal for the separated groups are shown with the cross hairs. The thick cross hairs are for the rPFC, and thin cross hairs are for the Hc. From this, F-tests show that the variances in the SrPFC and SHc are significantly different between fG<2.0 versus fG>2.0: in the rPFC, σSrPFC2 is 57.07 versus 949.28 (p < 0.05), and in the Hc, σSHc2 is 145.35 versus 541.78 (p < 0.05). For both loci, the black circled markers of corresponding color identify the Bolero first to fourth shimmed data. (D) Plots of tissue concentrations for Ins, Gln, Glu, and GSH against the calculated fG parameter from the rPFC. Not all metabolites show an increase in variance as fG declines, although there is a trend to this effect consistent with the summed total signal data. (E) To allow a broader lineshape in the analysis, RFWHM = 5 was used to fit the data. The SrPFC and SHc values are plotted against fG. Gln, glutamine; Glu, glutamate; GSH, glutathione; Hc, hippocampus; Ins, myo-inositol; RFWHM, range for full width half maximum; rPFC, rostral prefrontal cortex.

References

    1. Wilson M, Andronesi O, Barker PB, et al. Methodological consensus on clinical proton MRS of the brain: review and recommendations. Magn Reson Med 2019;82(2):527–550. doi:10.1002/mrm.27742 - DOI - PMC - PubMed
    1. Near J, Harris AD, Juchem C, et al. Preprocessing, analysis and quantification in single-voxel magnetic resonance spectroscopy: experts’ consensus recommendations. NMR Biomed 2021;34(5):e4257. doi:10.1002/nbm.4257 - DOI - PMC - PubMed
    1. Marjańska M, Terpstra M. Influence of fitting approaches in LCModel on MRS quantification focusing on age-specific macromolecules and the spline baseline. NMR Biomed 2021;34(5):e4197. doi:10.1002/nbm.4197 - DOI - PMC - PubMed
    1. Kreis R, Boer V, Choi IY, et al. Terminology and concepts for the characterization of in vivo MR spectroscopy methods and MR spectra: background and experts’ consensus recommendations. NMR Biomed 2020;34(5):e4347. doi:10.1002/nbm.4347 - DOI - PMC - PubMed
    1. Collins CM, Yang B, Yang QX, Smith MB. Numerical calculations of the static magnetic field in three-dimensional multi-tissue models of the human head. Magn Reson Imaging. 2002;20(5):413–424. doi:10.1016/s0730-725x(02)00507-6 - DOI - PubMed

Publication types

MeSH terms

Substances

LinkOut - more resources