. 2023 Sep;621(7980):821-829.
doi: 10.1038/s41586-023-06508-4. Epub 2023 Aug 16.

Endothelial sensing of AHR ligands regulates intestinal homeostasis

Affiliations

Endothelial sensing of AHR ligands regulates intestinal homeostasis

Benjamin G Wiggins et al. Nature. 2023 Sep.

Abstract

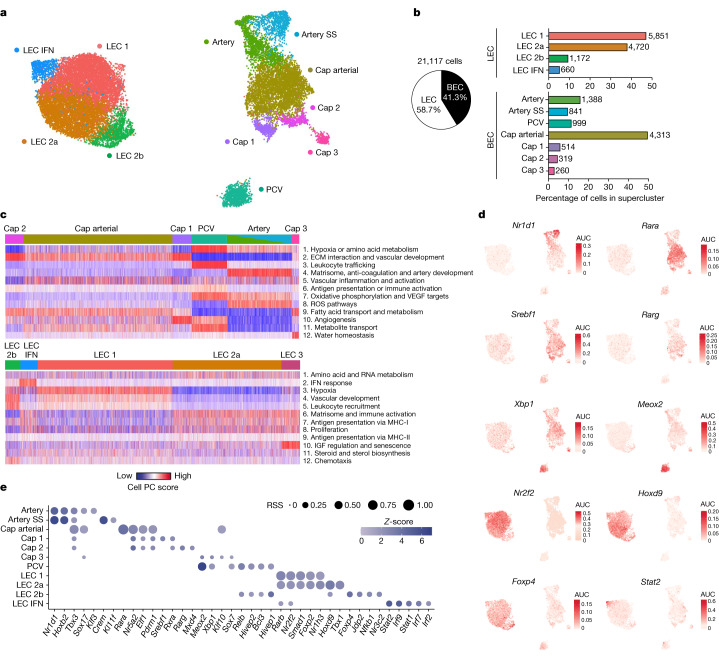
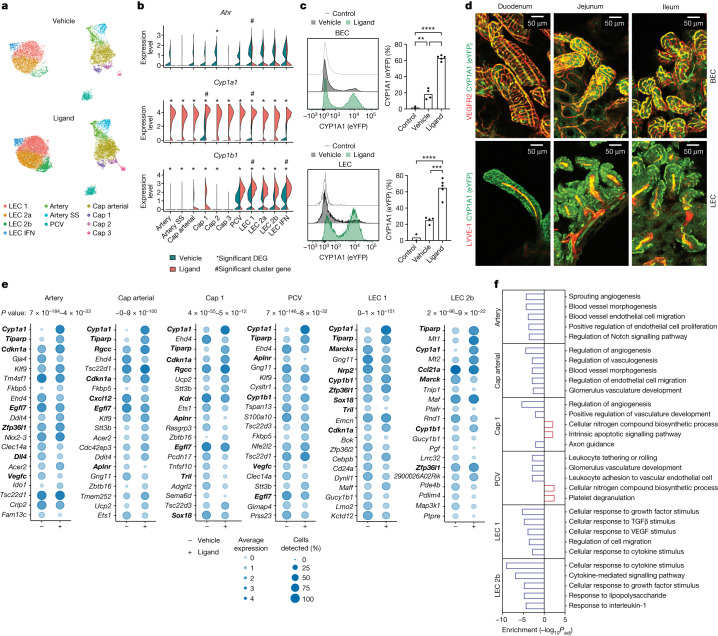
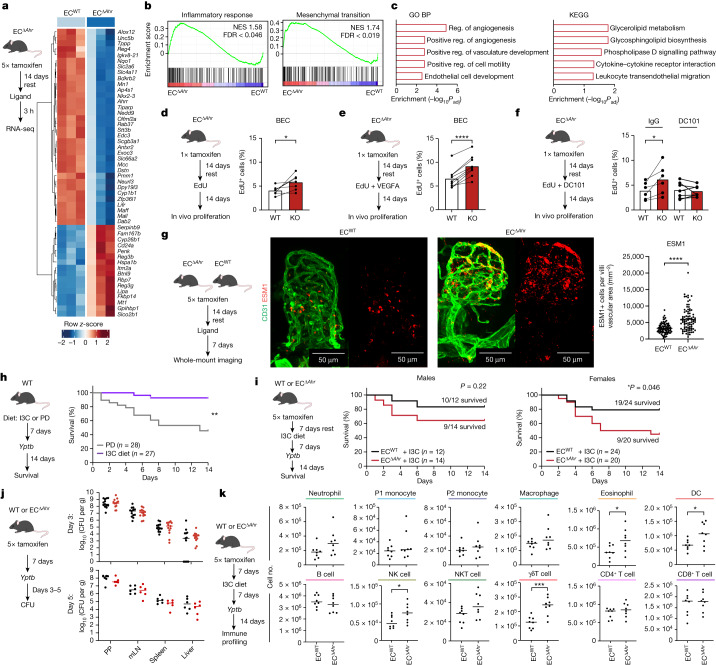
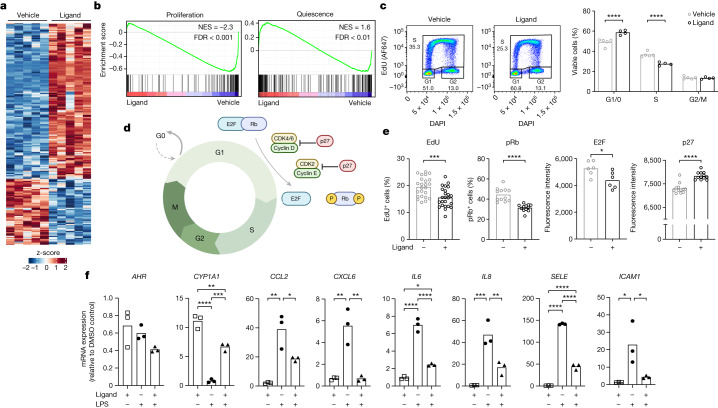
Endothelial cells line the blood and lymphatic vasculature, and act as an essential physical barrier, control nutrient transport, facilitate tissue immunosurveillance and coordinate angiogenesis and lymphangiogenesis1,2. In the intestine, dietary and microbial cues are particularly important in the regulation of organ homeostasis. However, whether enteric endothelial cells actively sense and integrate such signals is currently unknown. Here we show that the aryl hydrocarbon receptor (AHR) acts as a critical node for endothelial cell sensing of dietary metabolites in adult mice and human primary endothelial cells. We first established a comprehensive single-cell endothelial atlas of the mouse small intestine, uncovering the cellular complexity and functional heterogeneity of blood and lymphatic endothelial cells. Analyses of AHR-mediated responses at single-cell resolution identified tissue-protective transcriptional signatures and regulatory networks promoting cellular quiescence and vascular normalcy at steady state. Endothelial AHR deficiency in adult mice resulted in dysregulated inflammatory responses and the initiation of proliferative pathways. Furthermore, endothelial sensing of dietary AHR ligands was required for optimal protection against enteric infection. In human endothelial cells, AHR signalling promoted quiescence and restrained activation by inflammatory mediators. Together, our data provide a comprehensive dissection of the effect of environmental sensing across the spectrum of enteric endothelia, demonstrating that endothelial AHR signalling integrates dietary cues to maintain tissue homeostasis by promoting endothelial cell quiescence and vascular normalcy.


Conflict of interest statement

The authors declare no competing interests.

Figures

Fig. 1
Fig. 1. Single-cell transcriptomics reveals the cellular complexity of enteric vasculature.
a, Uniform manifold approximation and projection (UMAP) of small intestine endothelial cells. Artery SS, artery shear stress; cap, capillary. b, Representation of BEC and LEC superclusters (pie chart) and supercluster breakdown (bar charts). Cell numbers given at the end of bars. c, Pagoda2 analysis of BEC and LEC subclusters. The heat map shows principal component (PC)/aspect scores for each cell assigned on the basis of the level of statistical enrichment within curated endothelial-related input gene sets (see Methods and Supplementary Table 3). Gene sets are clustered together on the basis of similarities within constituent genes and similar patterns of cell separation to create aspects (heat map rows; see also Supplementary Table 4). Top 12 aspects are annotated manually based on top constituent pathways. ECM, extracellular matrix; IGF, insulin-like growth factor; ROS, reactive oxygen species. d, Transcription factor network activity area under the curve (AUC) score distributions of selected top enriched regulons for each cluster following SCENIC analysis. e, Top 5 enriched regulons, by regulon specificity score (RSS), for each of the clusters. RSS and normalized regulon activity (z-score) are shown. Source data
Fig. 2
Fig. 2. AHR activation promotes vasculoprotective responses in endothelial subtypes.
a, UMAP plots split by condition (vehicle or ligand-treated). b, Expression of Ahr, Cyp1a1 and Cyp1b1 across the clusters. *Significant DEG (adjusted P < 0.05); #Conserved marker enriched in indicated cluster (adjusted P < 0.05). cCyp1a1-eYFP expression within BEC or LEC isolated from Cyp1a1-reporter mice following treatment with the AHR ligand 3-MC (n = 5), vehicle (n = 4) or (3-MC-treated) non-reporter controls (n = 2). Bars show mean and symbols represent individual mice. d, Representative whole-mount gut staining in Cyp1a1-reporter mice 5 days after 3-MC administration (4–6 images per segment). e, Dot plots of top 20 differentially expressed (DE) genes for six selected scRNA-seq clusters in ligand-treated and vehicle-treated conditions, sorted by adjusted P value. The adjusted P value range for each cluster is shown above the plots. Genes related to the canonical AHR pathway or proliferation are in bold. f, Top 5 enriched gene sets in ligand-treated mice for the six indicated clusters. Upregulated and downregulated gene sets were tested separately and the top 5 combined enrichment scores are shown. P values calculated by Wilcoxon Rank Sum tests (b,e), one-way ANOVA with Tukey’s multiple comparisons tests(c) or Fisher’s exact tests (f). Source data
Fig. 3
Fig. 3. AHR ligands act directly on endothelial cells to promote quiescence and anti-inflammatory programmes.
a, Sorted small intestine BECs from FICZ-treated ECWT and ECΔAhr analysed by RNA-seq. Relative expression of top 50 DEGs. b, Barcode plots of gene set enrichment analysis (GSEA) on selected Hallmark gene sets. FDR, false discovery rate; NES, normalized enrichment score. c, BEC top 5 biological processes (BP) and KEGG gene sets upregulated in ECΔAhr compared with ECWT. Reg., regulation. df, Proliferation (as percentage of EdU+ cells) among wild-type and AHR-deficient (KO) BECs within the same mice following single-dose tamoxifen treatment and 14 days after feeding with EdU: at homeostasis (d; n = 7 per group), following 2-week VEGFA administration (e; n = 9 per group) and following 2-week treatment with VEGFR2-blocking antibody (DC101) or IgG control (IgG) (f; n = 6–7 per group). g, ESM1 expression within villi vasculature (CD31+ cells) in the small intestine of ECΔAhr or ECWT mice analysed seven days after treatment with 3-MC. Representative images (left) and quantification (right) of ESM1+ cells normalized to villi vasculature area between groups (ECWT n = 85 villi, ECΔAhr n = 88 villi). Points represent individual villi combined from 4 mice per group and bar height represents mean. h, Survival curve comparing Yptb-infected wild-type mice fed with purified diet (PD; n = 28) or purified diet containing I3C (I3C diet; n = 27). Data combined from 4 individual experiments (5 × 107 colony-forming units (CFU) per mouse). i, Survival curves of I3C-fed ECΔAhr and ECWT male and female mice after Yptb infection (5 × 107 CFU/mouse). Data combined from two or three independent cohorts. The proportion of surviving mice is shown. j, Yptb CFU number in 4 tissues 3 or 5 days after infection of ECΔAhr and ECWT mice with 5 × 108 CFU per mouse. Dots show individual mice, and lines show mean values (day 3, n = 13 per group, 2 independent experiments; day 5, n = 6 per group, 1 independent experiment). mLN, mesenteric lymph node; PP, Peyer ’s patches. k, Immune cell profiling in small intestine lamina propria 3 days after infection with 5 × 107 CFU Yptb per mouse. Data show total cell numbers of ten immune cell populations. n = 8 per group. Dots represent individual mice and lines show means. Population underline colours indicate gating origin (Extended Data Fig. 7a and Extended Data Fig. 8d). DC, dendritic cell; NK, natural killer. P values calculated by Fisher’s exact tests (c), paired t-tests (df), unpaired t-tests (g,jk) or Gehan–Breslow–Wilcoxon tests (h,i). Source data
Fig. 4
Fig. 4. AHR facilitates vasculoprotective pathways in human endothelial cells.
a, Heat map showing unsupervised hierarchical clustering of DEGs following bulk RNA-seq of FICZ-treated HUVECs compared with HUVECs treated with vehicle (n = 5 per group). b, Enrichment plots showing GSEA using HUVEC-specific proliferation and quiescence gene sets. Tested gene sets were from ref. . c, Flow cytometric cell cycle analysis of HUVECs treated with 100 nM FICZ (n = 4 replicates) compared with DMSO vehicle control (n = 5 replicates). d, Schematic of cell cycle regulators (created with BioRender.com). e, Single-cell imaging of cell cycle regulators in HUVECs treated with 100 nM FICZ (+) or vehicle (−). Symbols represent mean expression from individual wells (n = 6–24). f, HUVECs were treated with 100 nM FICZ (for 2 h), followed by LPS stimulation (for 4 h) and profiled for expression of AHR pathway genes and endothelial inflammatory markers by quantitative PCR (qPCR). Data are representative of 3 independent experiments. Bar height shows mean throughout. P values calculated by two-way ANOVA with Šidák’s multiple comparisons tests (c), unpaired t-tests (e) and one-way ANOVA with Tukey’s multiple comparison tests (f). Source data
Extended Data Fig. 1
Extended Data Fig. 1. Design and cluster identification in the enteric endothelial single cell RNAseq dataset.
a, Experimental design. WT mice (n = 3/group) treated with FICZ or vehicle control for 3h, before small intestine digest, total live CD31+ cell sorting by FACS; single-cell barcoding, library generation and sequencing. b, UMAP showing data structure post QC and doublet removal. Boxes indicate the four contaminant populations that were removed based on cluster size (clusters 12–14), or dominant heat-shock signature (cluster 8). c-e, Violin plots for verification, showing expression of common BEC markers (c), common LEC markers (d), and potential contaminant markers (e) (epithelial cells, pericytes, mural cells, fibroblasts, erythrocytes, and immune cells) in combined dataset. f, Heatmap of average expression of lymphatic capillary, collecting duct and valve genes in vehicle dataset (based on reference in LEC clusters. g, Heatmap displaying relative expression of capillary, valve, and collecting duct LEC markers amongst our LEC clusters. Source data
Extended Data Fig. 2
Extended Data Fig. 2. Characterising intestinal endothelial heterogeneity with single cell transcriptomics.
a, Dot plot showing selected top marker gene expression for each cluster scaled across all clusters (colour intensity), and percentage expression within that cluster (dot size). b, Annotated tSNE projection of BEC, and LEC subclustering used in Pagoda2 analysis pipeline (Fig. 1c). c, Regulon specificity score (RSS) for each cluster. Top 5 regulons for each type are annotated on the plots. d, Heatmap showing normalised regulon activity (AUC) score in each cluster for all 167 identified regulons. Source data
Extended Data Fig. 3
Extended Data Fig. 3. Interrogating EC AHR activation with flow cytometry, fluorescent imaging, and scRNAseq.
a, Percentage composition of each cluster in vehicle (open bar), and ligand-treated conditions (closed bar). b, Ahr, Cyp1a1, and Cyp1b1 expression shown across the clusters in vehicle and ligand-treated mice. c, Percentages of Cyp1a1+ cells in ligand-treated compared to vehicle-treated mice. Bar lengths represent % of cells (over relative expression threshold of 1) expressing Cyp1a1 in vehicle-treated (blue) and ligand-treated (red) data. d, Experimental design and gating strategy for Cyp1a1-reporter mice by flow cytometry (Fig. 2c). Cyp1a1-reporter mice treated with AHR ligand 3-MC (5d prior small intestinal tissues digest and analyses by flow cytometry. Gates sequentially demonstrate exclusion of debris, exclusion of multiplets, exclusion of dead cells, and selection of CD31+ endothelial cells. e, Whole mount gut staining of Cyp1a1-reporter mice, and WT non-reporter controls both treated with 3-MC for 5d. Panels show VEGFR2, Cyp1a1-eYFP and merged staining at 10x magnification. Representative images of 3–6 images/condition. f, 20x representative images of CYP1A1 staining in the small intestinal villi of WT non-reporter mice (left) compared to Cyp1a1-reporter mice (right). Representative of minimum 3 images. g, h, Percentage Cyp1a1-eYFP expression in BEC (g) and LEC (h) from different SI segments following treatment with 3-MC (n = 6 mice), vehicle (n = 2-3 mice), or from non-reporter control mice (n = 3 mice). Bar heights represent the mean, symbols show individual mice. i, Heatmaps showing % Cyp1a1-eYFP expression in 5d 3-MC/vehicle treated Cyp1a1-reporters (n = 4-5 per group except liver n = 6–8, kidney/lung/spleen n = 3, and colon LEC n = 2). SI - small intestine, BAT - brown adipose tissue, iWAT - inguinal white adipose tissue. *P < 0.05, **P < 0.01, ***P < 0.001, ****P < 0.0001 as calculated by one-way ANOVA with Tukey’s multiple comparisons tests. Source data
Extended Data Fig. 4
Extended Data Fig. 4. Further differential gene and pathway analysis on each cluster.
a, Dot plots showing top 20 DE genes for remaining 5 clusters (other 6 in Fig. 2e). + and – indicate ligand- and vehicle- treated conditions respectively. Colour intensity represents average expression level, dot size – average % expression of each gene. Genes relating to canonical AHR pathway, or proliferation in bold. b, UpSet plots showing DE gene overlaps between each cluster, within BEC (top) or LEC (bottom) supercluster. Black connecting lines in columns represent all possible overlaps, intersection size the number of shared genes in each overlap. Total DE genes for each cluster shown in right bars. Coloured bars at top of plot indicate number of overlaps within range. Only genes expressed in all BEC or LEC clusters were included in this analysis. c, Venn diagram showing overlap between DE genes shared in all BEC and DE genes shared across all LEC. d,e, Heatmaps to compare DE gene expression across clusters. Heatmaps show DE gene expression (as log2 fold-change compared to vehicle only) in either shared genes in all parent BEC/LEC clusters (d), or top 5 unique genes for each cluster (e). Numbers to right of unique gene heatmaps indicate total number of unique DE genes within each cluster. f, As in Fig. 2e, Top 5 enriched genesets (GO Biological Processes) in 5 remaining clusters (red – upregulated geneset, blue – downregulated geneset). P values calculated by Wilcoxon Rank Sum tests. Source data
Extended Data Fig. 5
Extended Data Fig. 5. RNA sequencing of AHR-deficient intestinal LEC.
a, Histogram overlays showing Cre efficiency and specificity in SI BEC (CD45CD31+PDPN; red) and LEC (CD45CD31+PDPN; green) from ECΔAhr mice treated with a full (5x) tamoxifen regimen (shaded histograms) comapred to tamoxifen-treated littermate ECWT controls. Grey bar shows negligable Cre+ cells within CD31 gate. Graphs show summary data (ECWT n = 24; ECΔAhr n = 29). b, Composition of immune cell subsets between ECWT and ECΔAhr mice during tamoxifen treatment (analysed day 7 of 14 day course, n = 5–7 mice/genotype). Immune cell subsets defined as in Extended Data Fig. 6a. c, Experimental setup and gating strategy for RNA sequencing experiments. 3h post-FICZ treatment, NuTRAP-reporter+ (mCherry-RanGAP1+eGFP-L10a+) BEC and LEC from SI and colon of ECΔAhr and ECWT controls were sorted by FACS and sequenced. d, Small intestinal LEC – expression of top 50 DE genes (based on adjusted p value) between ECΔAhr (Ahr-deficient) and ECWT (Ahr WT). e, Results of GSEA analysis of selected Hallmark pathways in ECΔAhr LEC, displayed as a barcode plot (NES, normalised enrichment score; FDR, false discovery rate). f, Venn diagram showing number of DE genes that overlap in BEC and LEC. g, Homeostatic proliferation: EdU detection following 2-week EdU feeding in WT and KO LEC from suboptimally-depleted ECΔAhr mice (n = 7 mice). Gating eample of WT and KO BEC and LEC selection (within total CD31+ gate) shown. h, VEGFA administration: EdU detection in ECΔAhr mice WT and KO LEC following 2-week VEGFA165 administration alongside EdU feeding (n = 9 mice). i, DC101-mediated blockade: EdU detection in ECΔAhr mice WT and KO LEC following VEGFR2 blockade with DC101 antibody (n = 7 mice), or control IgG alongside EdU feeding (n = 6 mice). *P < 0.05, **P < 0.01, ****P < 0.0001, as calculated by paired t-tests (g,i). or unpaired t-tests (i – WT-WT, and KO-KO comparisons only). Source data
Extended Data Fig. 6
Extended Data Fig. 6. Endothelial AHR-deficiency does not directly impact enteric stromal cell activation.
a, Representative gating strategy to target immune populations in the gut, based off refs. , Arrows indicate direction of gating. Coloured gates indicate final population designation. b, summary data of 8 defined populations between fully tamoxifen treated ECWT (WT, n = 12) and ECΔAhr (KO, n = 13) as total cell numbers/SI lamina propria. Data from two independent experiments shown. c, SI epithelial cells (EPCAM+) activation marker profiling between fully-tamoxifen treated ECΔAhr and ECWT mice. Representative gating shows selection of EPCAM+ intestinal epithelial cells (IECs), and gate setting for CD74LO and CD74HI IECs. Summary data shows marker expression within IECs between ECWT (WT, n = 13) and ECΔAhr (KO, n = 11), data from 2 independent experiments. d, Bulk RNA sequencing experimental set-up and resulting volcano plot comparing whole tissue sampling from fully-tamoxifen treated ECΔAhr and ECWT mice. Mice (n = 4/group) were treated with FICZ 3 h before tissue collection. Volcano plot DE genes shown in red (significantly increased) and blue (significantly decreased). e, Relative expression of all significant genes between ECΔAhr and ECWT: individual replicates shown in columns. Genes in rows. f, VEGFR2 (red) and LYVE1 (blue) whole-mount immunostaining in ECΔAhr and ECWT mice treated with 3-MC (7 days). Quantification shows blood vascular density per villi, blood vascular branchpoints/villi, blood vascular cage height, and relative lacteal length per villi (lacteal height: blood vascular cage height). ECWT n = 41, ECΔAhr n = 43 villi from 4 mice/group. Points represent individual villi, lines represent means. g, ECΔAhr and ECWT mice treated as in f, with additional infusion of 100 nm fluorescent microspheres 5 min before tissue collection. Images show representative villi, submucosal veins, and vasculature around villus crypts (VEGFR2 – blue, MADCAM-1 – green, 100 nm beads – red). Quantification shows % of villi, crypt vessels, or veins per image with clear bead distribution outside the vessels. Points represent images taken (n = 12/group from 4 mice/group), lines show means. Source data
Extended Data Fig. 7
Extended Data Fig. 7. AHR-deficiency alters gut EC inflammatory activation profiles.
a, Suboptimally deleted ECΔAhr mice were fed I3C containing diet for 7 days followed by 24h i.p. LPS challenge (or vehicle control – PBS), before activation and inflammatory surface markers compared by flow cytometry in WT and KO BEC within the same animals within both PBS-, and LPS-treated conditions. Representative histograms show position of positive gates, bar plots show MFI of positive BEC for each marker in the 4 conditions (n = 5/group, lines represent means). b, as in part a, but examining WT and KO LEC from suboptimally deleted ECΔAhr mice following LPS or PBS vehicle treatment ((n = 5/group, lines represent means). *P < 0.05, **P < 0.01, ***P < 0.001, ****P < 0.0001 as calculated by unpaired t-tests (a-b, PBS vs. LPS comparisons), and paired t-tests (a-b, WT vs. KO within same mouse). Source data
Extended Data Fig. 8
Extended Data Fig. 8. Global Ahr-deficiency leads to increased susceptibility to enteric infection.
a, Globally Ahr-deficient (Ahr−/−) mice or WT controls were infected with Yptb (5 x 10⁸ CFU/mouse) and survival recorded. b, Survival curve comparing Ahr−/− (n = 14) and WT (n = 19) mice. Data combined from two experiments. c, colony-forming unit (CFU) determination in the 5 tissues shown at day 3 (left, n = 11-12/group) or day 5 (right, n = 5–10/group) following Yptb infection (5 x 10⁸ CFU/mouse) in WT and Ahr−/− mice. Data combined from two experiments. d, Gating strategy for additional immune cell populations quantified in Fig. 3k. Gating for NK cells, NKT cells, γδT cells, CD4+ αβT cells, and CD8+ αβT cells shown. Input gates (as represented in Extended Data Fig. 6a) listed above plots. e, Inflammatory activation marker profiling of BEC in WT or ECΔAhr mice 3 days after Yptb infection (5 x 10⁷ CFU/mouse) by flow cytometry (n = 8 mice/group). *P < 0.05, **P < 0.01 ***P < 0.001, *P < 0.0001 as calculated by Gehan-Breslow-Wilcoxon tests (b), by unpaired t-tests(c), or by paired t-tests (e). Source data
Extended Data Fig. 9
Extended Data Fig. 9. Responses of human endothelia to AHR ligand stimulation and AHR deficiency.
a, CYP1A1 expression (qPCR) in HUVECs at different timepoints following either FICZ, or DMSO control treatment (n = 2-3/timepoint). b, Representative flow plots and combined data of AHR-knockdown HUVECs (siAHR) or siRNA control (siScr) subjected to flow cytometric cell cycle analysis. Both AHR-knockdown and control HUVEC cultured with 100 nM FICZ following siRNA treatment (n = 3/group). c, Representative images from combined single-cell imaging data shown in Fig. 4e. Hoechst – blue, EdU – red, totalRb – green, pRb – orange, p27 – orange. Scale bars represent 100 µm. Data representative of 3 independent experiments. Bar heights represent means throughout. **P < 0.01, ****P < 0.0001 as calculated by two-way ANOVA with Šidák’s multiple comparisons tests. Source data

References

    1. Ricard N, Bailly S, Guignabert C, Simons M. The quiescent endothelium: signalling pathways regulating organ-specific endothelial normalcy. Nat. Rev. Cardiol. 2021;18:565–580. doi: 10.1038/s41569-021-00517-4. - DOI - PMC - PubMed
    1. Petrova TV, Koh GY. Organ-specific lymphatic vasculature: From development to pathophysiology. J. Exp. Med. 2018;215:35–49. doi: 10.1084/jem.20171868. - DOI - PMC - PubMed
    1. Brulois K, et al. A molecular map of murine lymph node blood vascular endothelium at single cell resolution. Nat. Commun. 2020;11:3798. doi: 10.1038/s41467-020-17291-5. - DOI - PMC - PubMed
    1. Gonzalez-Loyola A, et al. FOXC2 controls adult lymphatic endothelial specialization, function, and gut lymphatic barrier preventing multiorgan failure. Sci. Adv. 2021;7:eabf4335. doi: 10.1126/sciadv.abf4335. - DOI - PMC - PubMed
    1. Kalucka J, et al. Single-cell transcriptome atlas of murine endothelial cells. Cell. 2020;180:764–779.e720. doi: 10.1016/j.cell.2020.01.015. - DOI - PubMed

Publication types