. 2023 Aug 16;13(1):13325.
doi: 10.1038/s41598-023-40595-7.

Prioritizing non-communicable diseases in the post-pandemic era based on a comprehensive analysis of the GBD 2019 from 1990 to 2019

Affiliations

Prioritizing non-communicable diseases in the post-pandemic era based on a comprehensive analysis of the GBD 2019 from 1990 to 2019

Jianhao Shu et al. Sci Rep. .

Abstract

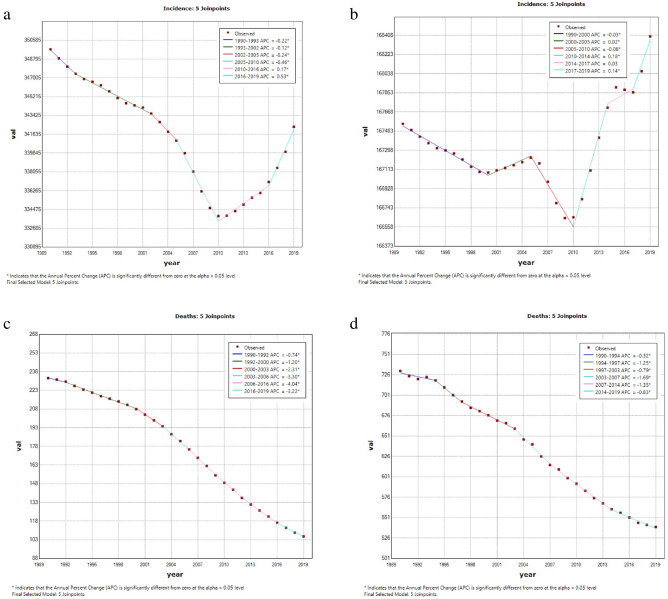
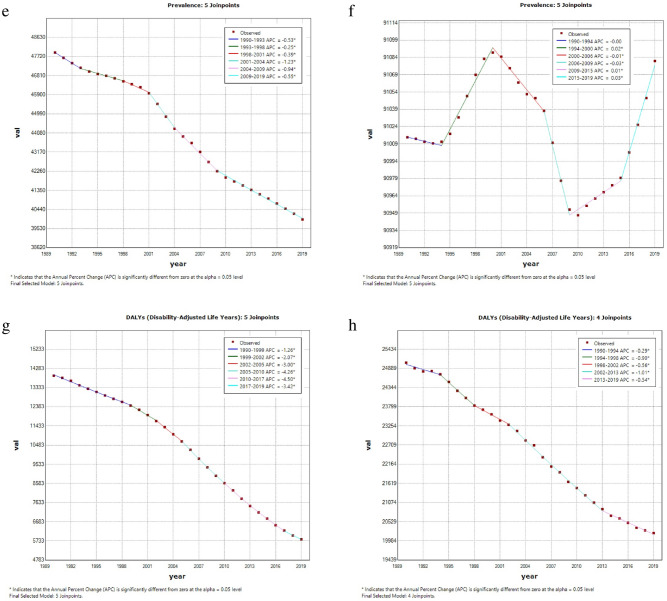
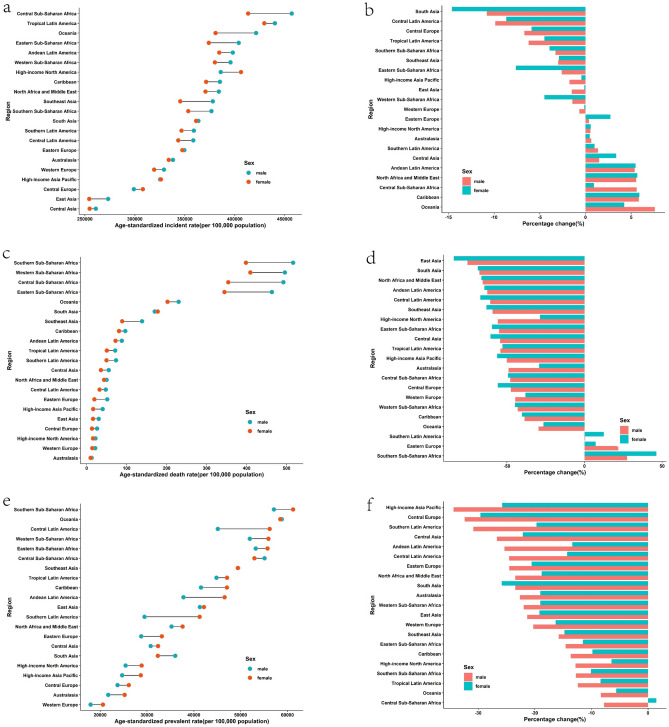
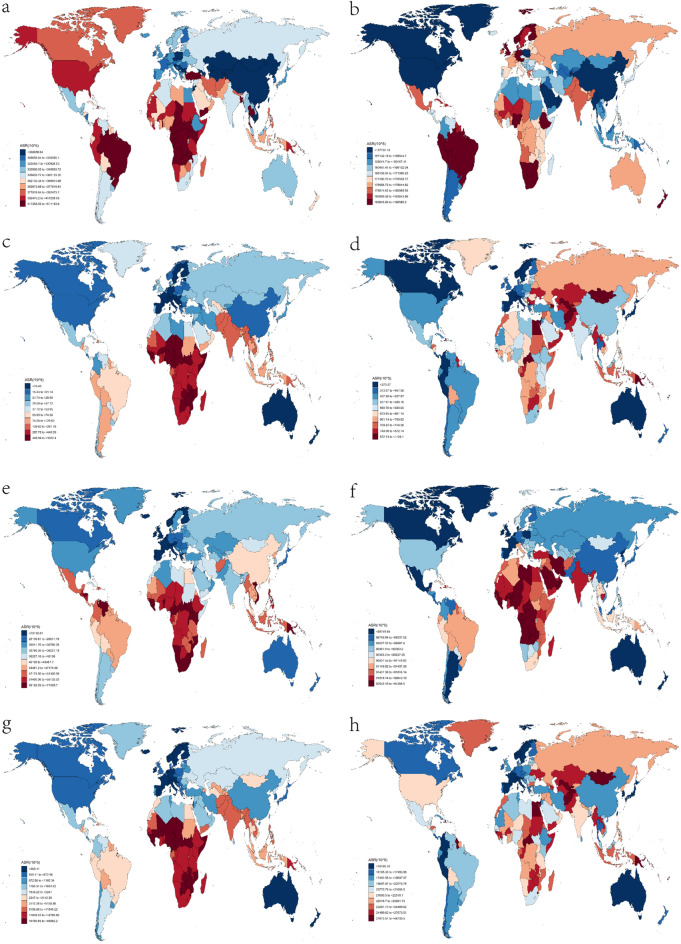
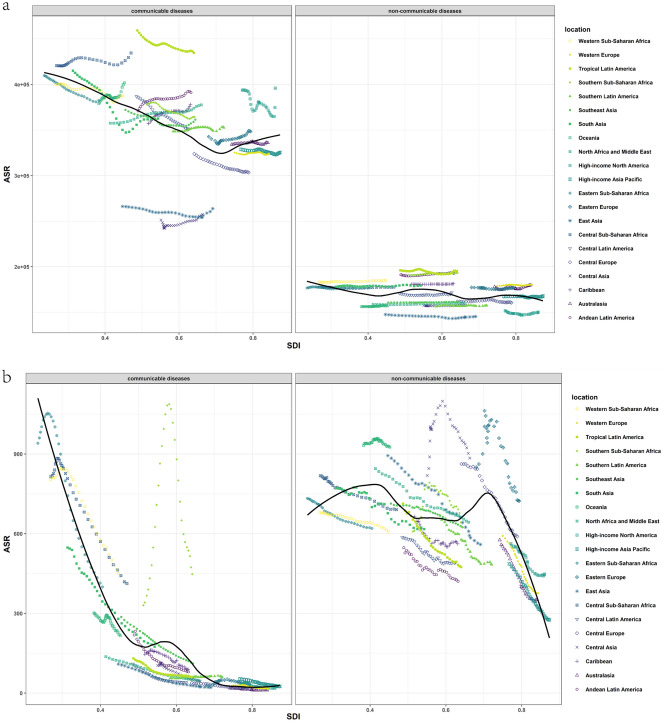
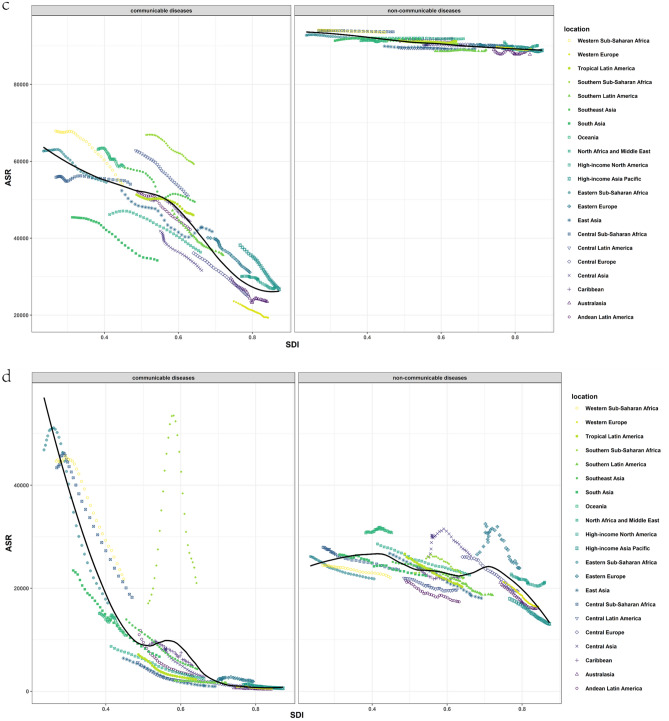
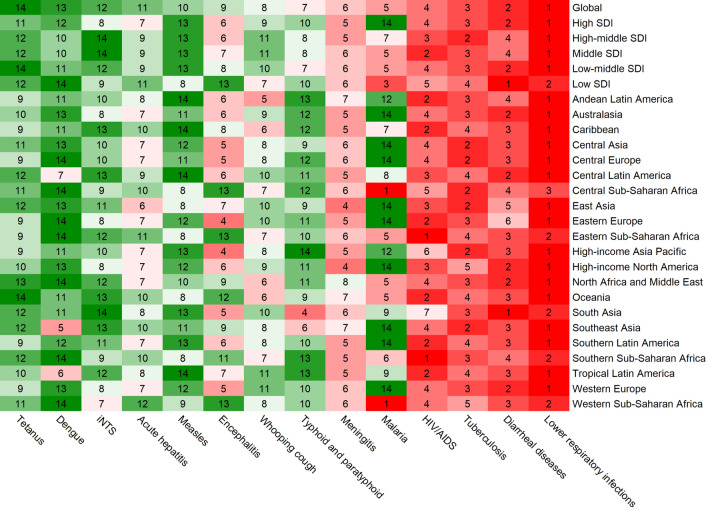
This study aimed to assess the burden of communicable diseases (CDs) and non-communicable diseases (NCDs) globally, regionally, and nationally from 1990 to 2019, and propose global strategies to transform the public health policy. Using data from the Global Burden of Disease Study (GBD) 2019, we analyzed CDs and NCDs across various factors such as sex, age, year, and location, and evaluate the temporal trends of these diseases with joinpoint analysis. We also examined the differences between regions based on their socio-demographic index (SDI). In 2019, there were 7,862,907 (95% uncertainty interval [UI], 7,183,475 to 8,654,104) deaths from CDs and 42,034,124 (40,081,323 to 43,942,475) deaths from NCDs recorded worldwide. The low SDI region had markedly high age-standardized death and DALY rates of CDs. Although the age-standardized incidence rate of CDs has decreased in about half of the regions since 1990, NCDs have been on the rise in most regions. Over the past 30 years, the global burden of CDs has decreased significantly, while the burden of NCDs has aggrandized to an extent. In the post-pandemic era, effective interventions and cooperation among countries should be promoted to allocate medical resources more reasonably and improve healthcare for NCD patients.


Conflict of interest statement

The authors declare no competing interests.

Figures

Figure 1
Figure 1
Global trends for age-standardized rates (per 100,000 population) of communicable diseases and NCDs from 1990 to 2019. (a) age-standardized incidence rate of communicable disease; (b) age-standardized incidence rate of non-communicable disease; (c) age-standardized death rate of communicable disease; (d) age-standardized death rate of non-communicable disease; (e) age-standardized prevalence rate of communicable disease; (f) age-standardized prevalence rate of non-communicable disease; (g) age-standardized DALYs rate of communicable disease; (h) age-standardized DALYs rate of noncommunicable disease. DALY disability-adjusted life year.
Figure 1
Figure 1
Global trends for age-standardized rates (per 100,000 population) of communicable diseases and NCDs from 1990 to 2019. (a) age-standardized incidence rate of communicable disease; (b) age-standardized incidence rate of non-communicable disease; (c) age-standardized death rate of communicable disease; (d) age-standardized death rate of non-communicable disease; (e) age-standardized prevalence rate of communicable disease; (f) age-standardized prevalence rate of non-communicable disease; (g) age-standardized DALYs rate of communicable disease; (h) age-standardized DALYs rate of noncommunicable disease. DALY disability-adjusted life year.
Figure 2
Figure 2
Regional age-standardized incidence rates (per 100,000 population) of communicable disease in 2019 and their sex-specific percentage changes from 1990 to 2019. (a) age-standardized incidence rate in 2019; (b) percentage change in age-standardized incidence rate, 1990–2019; (c) age-standardized death rate in 2019; (d) percentage change in age-standardized death rate, 1990–2019; (e) age-standardized prevalence rate in 2019; (f) percentage change in age-standardized prevalence rate in 2019; (g) age-standardized DALY rate in 2019; (h) percentage change in age-standardized DALY rate, 1990–2019. DALY disability-adjusted life year.
Figure 2
Figure 2
Regional age-standardized incidence rates (per 100,000 population) of communicable disease in 2019 and their sex-specific percentage changes from 1990 to 2019. (a) age-standardized incidence rate in 2019; (b) percentage change in age-standardized incidence rate, 1990–2019; (c) age-standardized death rate in 2019; (d) percentage change in age-standardized death rate, 1990–2019; (e) age-standardized prevalence rate in 2019; (f) percentage change in age-standardized prevalence rate in 2019; (g) age-standardized DALY rate in 2019; (h) percentage change in age-standardized DALY rate, 1990–2019. DALY disability-adjusted life year.
Figure 3
Figure 3
Regional age-standardized incidence rates (per 100,000 population) of non-communicable diseases in 2019 and their sex-specific percentage changes from 1990 to 2019. (a) The age-standardized incidence rate in 2019; (b) percentage change in age-standardized incidence rate, 1990–2019; (c) age-standardized death rate in 2019; (d) percentage change in age-standardized death rate, 1990–2019; (e) age-standardized prevalence rate in 2019; (f) percentage change in age-standardized prevalence rate in 2019; (g) age-standardized DALY rate in 2019; (h) percentage change in age-standardized DALY rate, 1990–2019. DALY disability-adjusted life year.
Figure 3
Figure 3
Regional age-standardized incidence rates (per 100,000 population) of non-communicable diseases in 2019 and their sex-specific percentage changes from 1990 to 2019. (a) The age-standardized incidence rate in 2019; (b) percentage change in age-standardized incidence rate, 1990–2019; (c) age-standardized death rate in 2019; (d) percentage change in age-standardized death rate, 1990–2019; (e) age-standardized prevalence rate in 2019; (f) percentage change in age-standardized prevalence rate in 2019; (g) age-standardized DALY rate in 2019; (h) percentage change in age-standardized DALY rate, 1990–2019. DALY disability-adjusted life year.
Figure 4
Figure 4
National age-standardized rates (per 100,000 population) of communicable diseases and NCDs in 2019. (a) The age-standardized incidence rate of communicable diseases; (b) age-standardized incidence rate of non-communicable diseases; (c) age-standardized death rate of communicable diseases; (d) age-standardized death rate of non-communicable diseases; (e) age-standardized prevalence rate of communicable diseases; (f) age-standardized prevalence rate of non-communicable diseases; (g) age-standardized DALYs rate of communicable diseases; (h) age-standardized DALYs rate of non-communicable diseases. DALY disability-adjusted life year. The original data was obtained from the GBD studies. There may be some problems with the regional partition, albeit it was not the focus of the present study.
Figure 5
Figure 5
Trends for age-standardized rates (per 100,000 population) of communicable diseases and NCDs among 21 regions by SDI, 1990–2019. (a) Age-standardized incidence rate; (b) age-standardized death rate; (c) age-standardized prevalence date; (d) age-standardized DALY rate. SDI Socio-demographic Index, DALY disability-adjusted life year.
Figure 5
Figure 5
Trends for age-standardized rates (per 100,000 population) of communicable diseases and NCDs among 21 regions by SDI, 1990–2019. (a) Age-standardized incidence rate; (b) age-standardized death rate; (c) age-standardized prevalence date; (d) age-standardized DALY rate. SDI Socio-demographic Index, DALY disability-adjusted life year.
Figure 6
Figure 6
Global and regional communicable diseases ranked by the total number of deaths in 2019.
Figure 7
Figure 7
Global and regional non-communicable diseases ranked by the total number of deaths in 2019.
Figure 8
Figure 8
Scatter plot of the relationship between COVID-19 and the predicted SDI in 2021 and 2022. (a) The relationship between COVID-19 incident cases and the predicted SDI; (b) the relationship between COVID-19 deaths and the predicted SDI.

References

    1. Standing up to infectious disease.Nat Microbiol4, 1, doi:10.1038/s41564-018-0331-3 (2019) - PMC - PubMed
    1. Elias C, Nkengasong JN, Qadri F. Emerging infectious diseases—Learning from the past and looking to the future. N. Engl. J. Med. 2021;384:1181–1184. doi: 10.1056/NEJMp2034517. - DOI - PubMed
    1. Baker RE, et al. Infectious disease in an era of global change. Nat. Rev. Microbiol. 2022;20:193–205. doi: 10.1038/s41579-021-00639-z. - DOI - PMC - PubMed
    1. Eckhardt M, Hultquist JF, Kaake RM, Huttenhain R, Krogan NJ. A systems approach to infectious disease. Nat. Rev. Genet. 2020;21:339–354. doi: 10.1038/s41576-020-0212-5. - DOI - PMC - PubMed
    1. Corbett S, Courtiol A, Lummaa V, Moorad J, Stearns S. The transition to modernity and chronic disease: Mismatch and natural selection. Nat. Rev. Genet. 2018;19:419–430. doi: 10.1038/s41576-018-0012-3. - DOI - PubMed

Publication types