. 2023 Aug 16;13(1):13289.
doi: 10.1038/s41598-023-40102-y.

A comparison of the infant gut microbiome before versus after the start of the covid-19 pandemic

Affiliations

A comparison of the infant gut microbiome before versus after the start of the covid-19 pandemic

Francesca R Querdasi et al. Sci Rep. .

Abstract

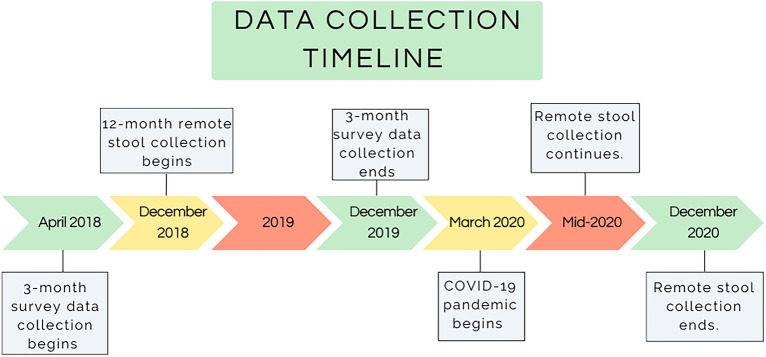
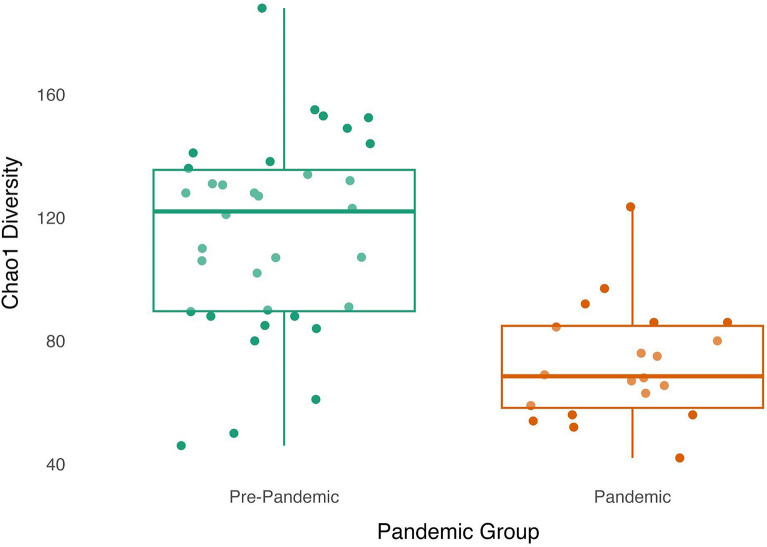
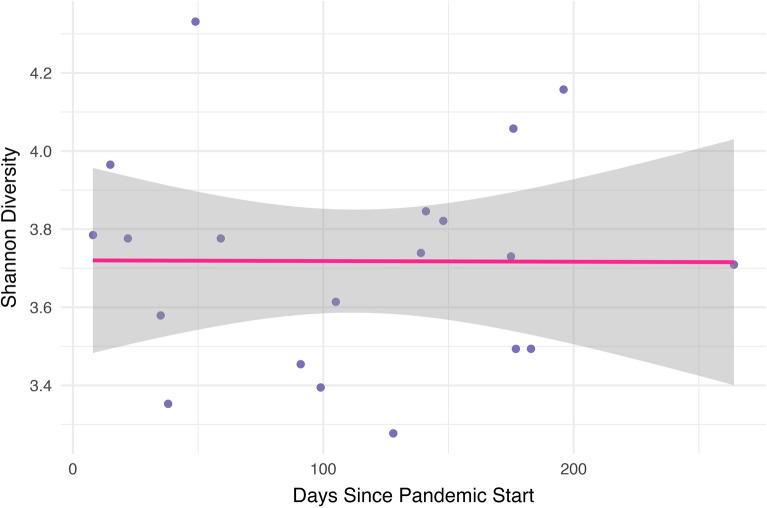
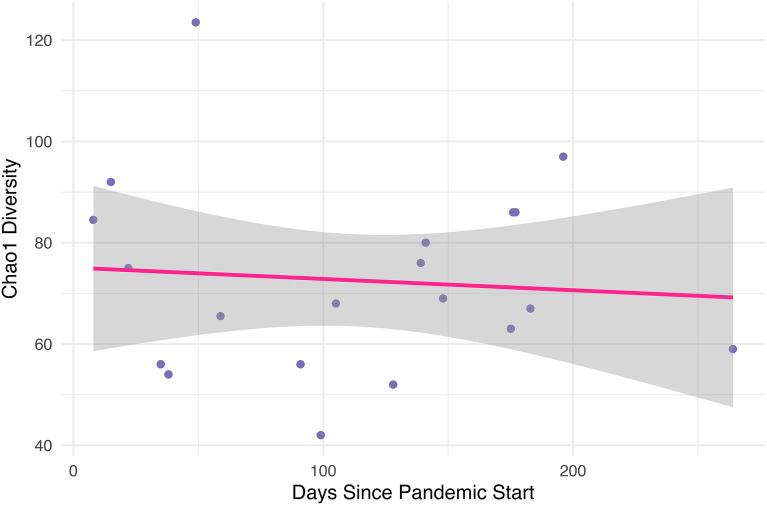
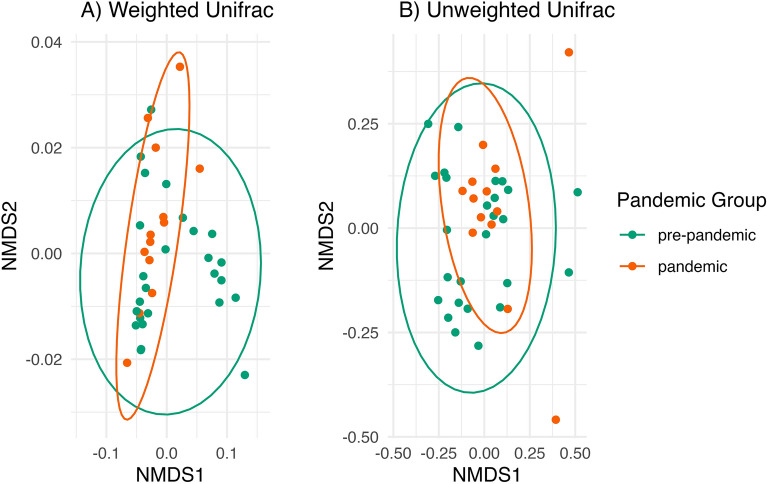
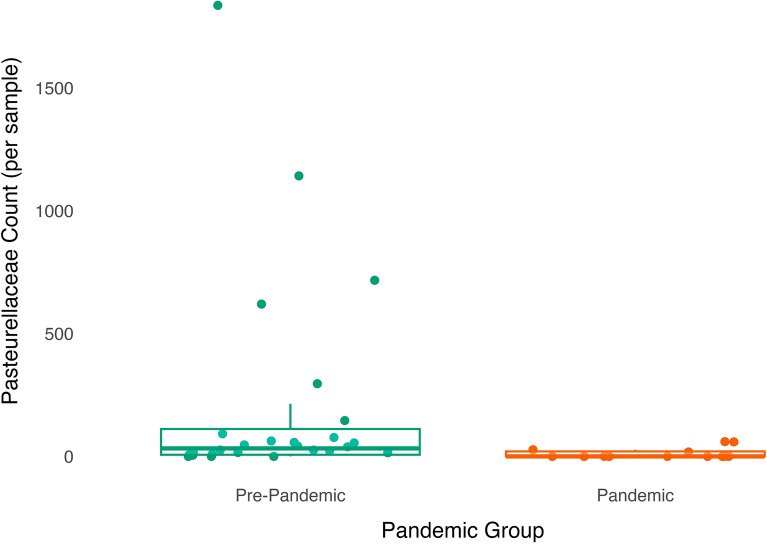
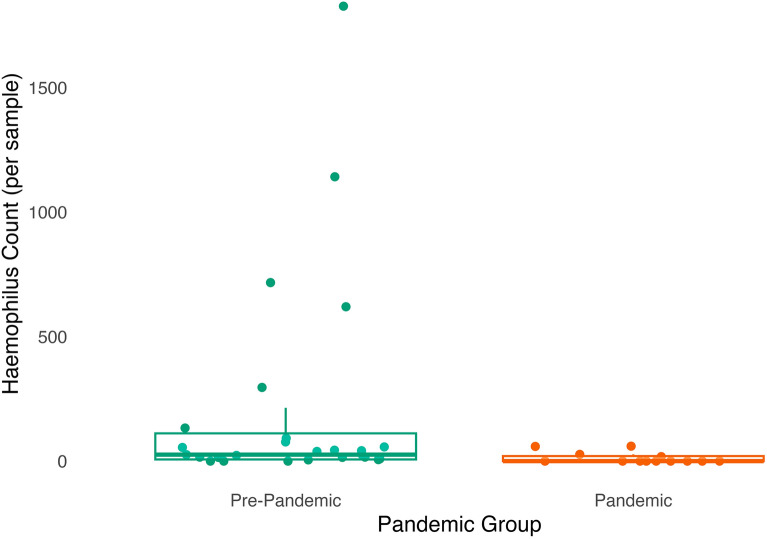
The COVID-19 pandemic and resulting public health directives led to many changes in families' social and material environments. Prior research suggests that these changes are likely to impact composition of the gut microbiome, particularly during early childhood when the gut microbiome is developing most rapidly. Importantly, disruption to the gut microbiome during this sensitive period can have potentially long-lasting impacts on health and development. In the current study, we compare gut microbiome composition among a socioeconomically and racially diverse group of 12-month old infants living in New York City who provided stool samples before the pandemic (N = 34) to a group who provided samples during the first 9-months of the pandemic (March-December 2020; N = 20). We found that infants sampled during the pandemic had lower alpha diversity of the microbiome, lower abundance of Pasteurellaceae and Haemophilus, and significantly different beta diversity based on unweighted Unifrac distance than infants sampled before the pandemic. Exploratory analyses suggest that gut microbiome changes due to the pandemic occurred relatively quickly after the start of the pandemic and were sustained. Our results provide evidence that pandemic-related environmental disruptions had an impact on community-level taxonomic diversity of the developing gut microbiome, as well as abundance of specific members of the gut bacterial community.


Conflict of interest statement

The authors declare no competing interests.

Figures

Figure 1
Figure 1
Timeline of data collection for this longitudinal study. Remote stool collection began in December 2018 when the first infants turned 12 months old. The COVID-19 pandemic began in March 2020, with New York State Executive Order 202.8 going into effect on March 22, 2020. Remote stool collection continued throughout the pandemic, and ended in December 2020 when the last infant in the study turned 12 months.
Figure 2
Figure 2
Chao1 diversity was significantly lower in the pandemic group. Infants sampled during the pandemic (N = 20; orange box plot and dots) had significantly lower alpha diversity, measured via the Chao1 index, than infants sampled before the pandemic (N = 34; green box plot and dots). Dots have been jittered along the x-axis to increase visibility of individual data points. Boxplot represents the median (line in the middle of the box), upper 25% quantile (top of the box), lower 25% quantile (bottom of the box), upper 25% quantile minus 1.5 times the interquartile range (upper whisker), and lower 25% quantile minus 1.5 times the interquartile range (lower whisker) Chao1 diversity values.
Figure 3
Figure 3
Shannon diversity by days since the start of the pandemic. Within the pandemic group, we found no significant correlation between Shannon diversity and days since the start of the pandemic.
Figure 4
Figure 4
Chao1 diversity by days since the start of the pandemic. Within the pandemic group, we found no significant correlation between Chao1 diversity and days since the start of the pandemic.
Figure 5
Figure 5
Beta diversity by pandemic group. (A) Pandemic group had significantly different gut microbial richness measured with Unweighted Unifrac distance, which can be seen in that the pre-pandemic samples (N = 24; green) are more spread out along the x-axis (NMDS1) than the pandemic samples (N = 13; orange). (B) Pandemic groups violate homogeneity of dispersion using weighted Unifrac distance: the pandemic samples are less dispersed (more tightly packed together) than the pre-pandemic samples. Each dot represents a participant; the closer the dots are to each other, the more similar their microbial communities. There are N = 13 pandemic samples and 24 pre-pandemic samples as beta diversity analyses were performed on the subsample with complete data on all covariates. Ellipses for each pandemic group are based on the 95% confidence level for a multivariate t-distribution.
Figure 6
Figure 6
Abundance of taxa from the Pasteurellacae family in the gut microbiome is lower among infants sampled during the pandemic than infants sampled pre-pandemic. Dots (green are pre-pandemic samples, orange are pandemic samples) have been jittered along the x-axis to increase visibility of individual data points. Boxplot represents the median (line in the middle of the box), upper 25% quantile (top of the box), lower 25% quantile (bottom of the box), upper 25% quantile minus 1.5 times the interquartile range (upper whisker), and lower 25% quantile minus 1.5 times the interquartile range (lower whisker) abundance values. N = 13 pandemic samples and 24 pre-pandemic samples as differential abundance analyses were performed on the subsample with complete data on all covariates.
Figure 7
Figure 7
Abundance of taxa from the Haemophilus genus is lower in the gut microbiome of infants sampled during compared to before the pandemic. Dots (green are pre-pandemic samples, orange are pandemic samples) have been jittered along the x-axis to increase visibility of individual data points. Boxplot represents the median (line in the middle of the box), upper 25% quantile (top of the box), lower 25% quantile (bottom of the box), upper 25% quantile minus 1.5 times the interquartile range (upper whisker), and lower 25% quantile minus 1.5 times the interquartile range (lower whisker) abundance values. N = 13 pandemic samples and 24 pre-pandemic samples as differential abundance analyses were performed on the subsample with complete data on all covariates.

References

    1. Chu KA, Schwartz C, Towner E, Kasparian NA, Callaghan B. Parenting under pressure: A mixed-methods investigation of the impact of COVID-19 on family life. J. Affect. Disord. Rep. 2021;5:100161. doi: 10.1016/j.jadr.2021.100161. - DOI - PMC - PubMed
    1. Romano-Keeler J, Zhang J, Sun J. COVID-19 and the neonatal microbiome: will the pandemic cost infants their microbes? Gut Microbes. 2021;13:1–7. doi: 10.1080/19490976.2021.1912562. - DOI - PMC - PubMed
    1. Callaghan BL, et al. Mind and gut: Associations between mood and gastrointestinal distress in children exposed to adversity. Dev. Psychopathol. 2020;32:309–328. doi: 10.1017/S0954579419000087. - DOI - PMC - PubMed
    1. Flannery JE, et al. Gut feelings begin in childhood: The gut metagenome correlates with early environment, caregiving, and behavior. MBio. 2020;11:10–128. doi: 10.1128/mBio.02780-19. - DOI - PMC - PubMed
    1. Bharwani A, et al. Structural & functional consequences of chronic psychosocial stress on the microbiome & host. Psychoneuroendocrinology. 2016;63:217–227. doi: 10.1016/j.psyneuen.2015.10.001. - DOI - PubMed

Publication types