. 2023 Aug;620(7975):863-872.
doi: 10.1038/s41586-023-06424-7. Epub 2023 Aug 16.

Transient naive reprogramming corrects hiPS cells functionally and epigenetically

Affiliations

Transient naive reprogramming corrects hiPS cells functionally and epigenetically

Sam Buckberry et al. Nature. 2023 Aug.

Abstract

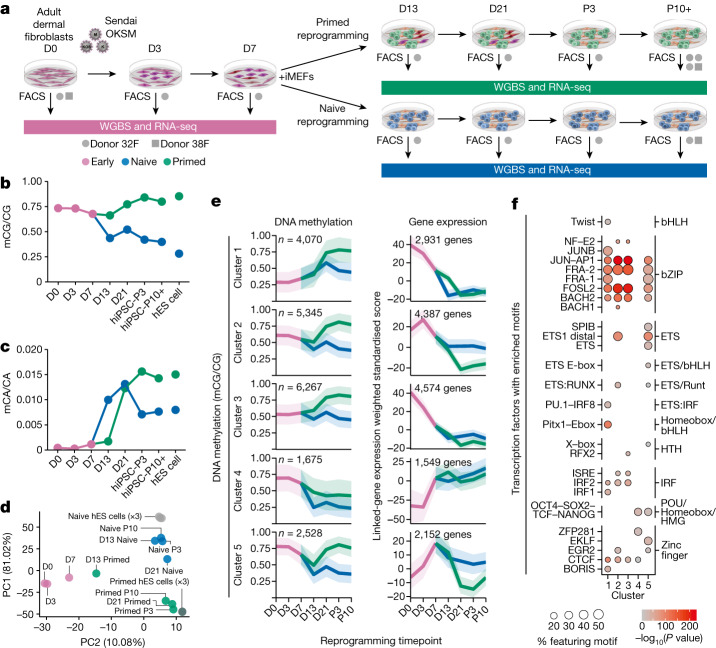
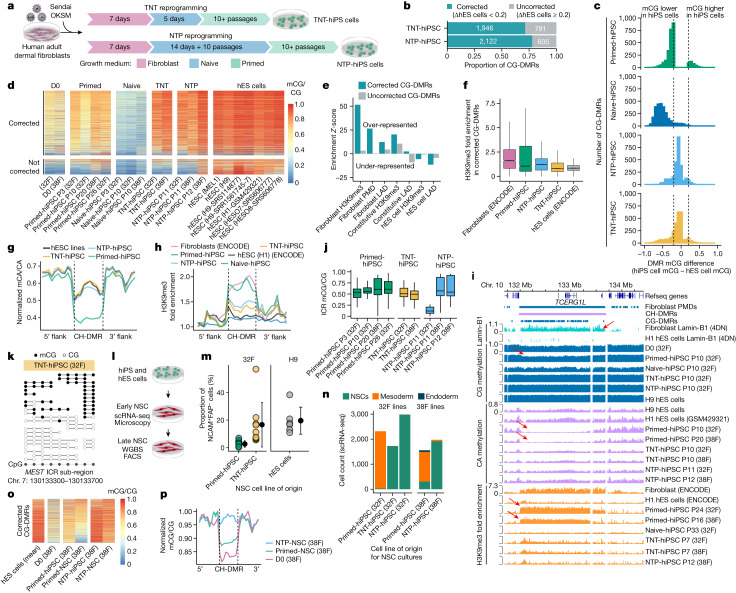
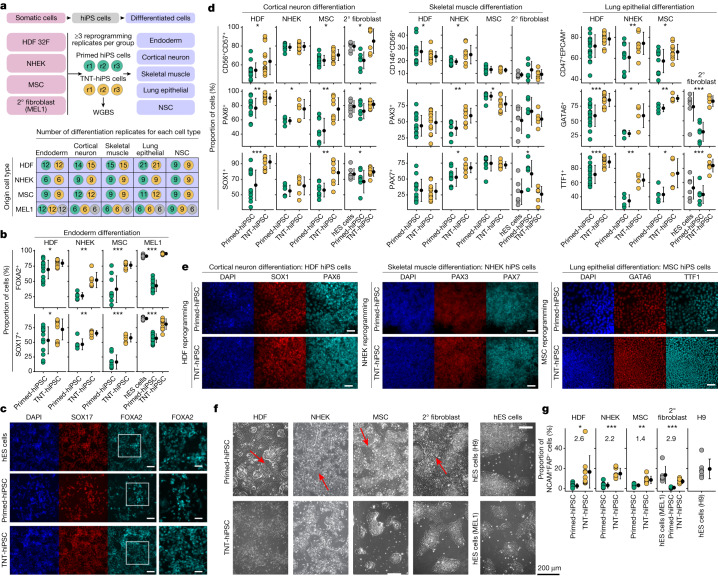
Cells undergo a major epigenome reconfiguration when reprogrammed to human induced pluripotent stem cells (hiPS cells). However, the epigenomes of hiPS cells and human embryonic stem (hES) cells differ significantly, which affects hiPS cell function1-8. These differences include epigenetic memory and aberrations that emerge during reprogramming, for which the mechanisms remain unknown. Here we characterized the persistence and emergence of these epigenetic differences by performing genome-wide DNA methylation profiling throughout primed and naive reprogramming of human somatic cells to hiPS cells. We found that reprogramming-induced epigenetic aberrations emerge midway through primed reprogramming, whereas DNA demethylation begins early in naive reprogramming. Using this knowledge, we developed a transient-naive-treatment (TNT) reprogramming strategy that emulates the embryonic epigenetic reset. We show that the epigenetic memory in hiPS cells is concentrated in cell of origin-dependent repressive chromatin marked by H3K9me3, lamin-B1 and aberrant CpH methylation. TNT reprogramming reconfigures these domains to a hES cell-like state and does not disrupt genomic imprinting. Using an isogenic system, we demonstrate that TNT reprogramming can correct the transposable element overexpression and differential gene expression seen in conventional hiPS cells, and that TNT-reprogrammed hiPS and hES cells show similar differentiation efficiencies. Moreover, TNT reprogramming enhances the differentiation of hiPS cells derived from multiple cell types. Thus, TNT reprogramming corrects epigenetic memory and aberrations, producing hiPS cells that are molecularly and functionally more similar to hES cells than conventional hiPS cells. We foresee TNT reprogramming becoming a new standard for biomedical and therapeutic applications and providing a novel system for studying epigenetic memory.


Conflict of interest statement

S.B., X.L., J. M. Polo and R.L. are co-inventors on a pending patent (PCT/AU2019/051296) filed by the University of Western Australia and Monash University related to this work. R.L. is a co-inventor on a patent (WO/2012/058634) concerning methods of characterizing the epigenetic signature of human induced pluripotent stem cells. Although unrelated to this manuscript, O.J.L.R. and J. M. Polo are co-inventors on a patent (WO/2017/106932) and are co-founders and shareholders of Mogrify, a cell therapy company. X.L. is a co-founder of iCamuno Biotherapeutics. The other authors declare no competing interests.

Figures

Fig. 1
Fig. 1. Distinct trajectories of DNA methylation change during human naive and primed reprogramming.
a, Experimental design for time-course profiling of epigenomic changes that occur as cells are reprogrammed from fibroblasts to naive-hiPS and primed-hiPS cells. iMEFs, irradiated mouse embryonic fibroblasts; FACS, fluorescence-activated cell sorting. D indicates day of experiment and P indicates passage number. b,c, Dynamics of global CG methylation (b) and CA methylation (c) during naive and primed reprogramming compared with primed and naive hES cells. DNA methylation levels were calculated as a coverage-weighted mean (Methods). d, Principal component analysis of CG DNA methylation levels at GeneHancer regulatory elements throughout reprogramming. e, c-Means fuzzy cluster analysis of CG DNA methylation levels in regulatory elements throughout primed and naive reprogramming. Gene-expression plots of genes identified through GeneHancer’s double-elite set of gene–enhancer validated pairs. The line is the nonparametric bootstrap mean and the ribbon shows the 99% confidence interval. f, Transcription factors (grouped by family) with significantly enriched motifs for DNA binding domains in regulatory elements for each cluster in e. Homer hypergeometric enrichment test; false discovery rate (FDR) < 0.01. Source Data
Fig. 2
Fig. 2. Aberrant CG DNA methylation is acquired after day 13 of primed reprogramming and is absent in naive-hiPS cells.
a, Number of CG-DMRs detected in primed-hiPS versus hES cells. Hypo-methylated CG-DMRs are those that are less methylated in primed-hiPS cells than in hES cells, and hyper-methylated CG-DMRs are those that are more methylated in primed-hiPS cells than in hES cells. b, Relative CG DNA methylation difference at CG-DMRs in primed-hiPS cells versus hES cells (x axis) and fibroblasts (y axis). Each point on the graph represents an individual CG-DMR; blue points represent hypo-methylated DMRs and orange points represent hyper-methylated DMRs. The plot is divided into segments using a cut-off of 0.2 difference in mCG/CG between cell types for classification purposes. Kernel density estimate plots (top and right of the main graph) show the distribution of CG-DMR methylation differences for hypo- and hyper-methylated DMRs. c,d, Time-course of mean CG methylation change across aberrant hyper-methylated CG-DMRs (c) and hypo-methylated memory CG-DMRs (d) relative to the progenitor fibroblast state (day 0). Each point represents mean CG DNA methylation change compared to day 0 for individual samples. The hiPS cell time point includes all passages. e, Methylation at maternal germline ICRs throughout naive and primed reprogramming. In box plots, the horizontal line is the median, the box represents the interquartile range (IQR) and whiskers show either 1.5 × IQR or the data range. n = 1 independent experiment per box plot. ICRs are defined in ref. . Source Data
Fig. 3
Fig. 3. Reprogramming through the naive state erases somatic cell memory and produces hiPS cells that closely resemble hES cells.
a, New reprogramming strategies for TNT-hiPS and NTP-hiPS cells. b, The proportion of CG-DMRs for primed-hiPS cells and hES cells corrected by TNT and NTP reprogramming to a difference of less than 0.2 mCG/CG. c, Differences in DNA methylation between hiPS and hES cells at CG-DMRs. Dashed lines indicate the threshold of 0.2 difference in CG-DMR methylation level. d, Methylation levels in corrected (top) and uncorrected (bottom) CG-DMRs. e, Enrichment permutation testing of corrected and uncorrected CG-DMRs in repressive chromatin. f, H3K9me3 enrichment in corrected CG-DMRs. Primed-hiPS: n = 2; TNT-hiPS: n = 2; NTP-hPSC, n = 3 independent experiments. In box plots, the horizontal line is the median, the box represents the interquartile range (IQR) and whiskers show either 1.5 × IQR or the data range. g, Aggregate profile of CA methylation in hypo-methylated CH-DMRs. Lines represent flank-normalized means. h, H3K9me3 enrichment in hypo-methylated CH-DMRs. Lines represent flank-normalized means. i, Genome track of a CH-DMR intersecting a PMD, fibroblast LAD and a CG-DMR cluster. Arrows indicate partial CG methylation, CA methylation depletion and H3K9me3 enrichment in a fibroblast LAD, as indicated. j, CG methylation in ICRs. The horizontal line is the median, the box represents the IQR and whiskers show either 1.5 × IQR or the data range. n = 1 independent experiment per box plot. k, WGBS reads at the MEST ICR. l, Schematic of NSC differentiation and profiling. m, The proportion of NCAM+FAP cells during differentiation into NSCs. Primed-hiPS: n = 9; TNT-hiPS: n = 9; H9-hES: n = 6 independent differentiation experiments. Data are mean ± s.d. n, Proportions of different cell types detected in early NSC cultures by single-cell RNA-seq (scRNA-seq). o, Methylation levels in CG-DMRs corrected by NTP reprogramming (as in Fig. 3d) in hiPS cells and derived NSC cultures. p, CG methylation (flank-normalized mCG/CG) in hypo-methylated CH-DMRs in NSCs and progenitor fibroblasts. Source Data
Fig. 4
Fig. 4. The isogenic differentiation and reprogramming system confirms that TNT reprogramming enhances epigenome resetting.
a, Experimental design for differentiating hES cells to fibroblast-like cells and then reprogramming them to hiPS cells using the primed, TNT and NTP methods. b, Principal component analysis of CG methylation at GeneHancer elements, mCA/CA of 50-kb genome windows, normalized ATAC–seq read counts in peaks, normalized global gene expression, normalized global transposable element (TE) expression and normalized H3K9me3 ChIP–seq read counts. Data were quantile-normalized counts per million (CPM). c, Differential-testing MA plots for gene expression (determined by RNA-seq), TE expression (RNA-seq), and chromatin accessibility (ATAC–seq) for hiPS cells versus hES cells. Red points indicate FDR <0.05. Numbers on plots enumerate the ‘up’ or ‘down’ significant-features counts for each comparison. d, Differential testing of hES cells versus hiPS cell types for CG-DMRs, gene expression, TE expression and ATAC–seq peaks. ‘hiPS cell higher’ indicates that the value is higher in hiPS cells than in hES cells, and ‘hiPS cell lower’ indicates that the value is lower in hiPS cells than in hES cells. e, Aggregate profile plot of CA methylation levels in hypo-methylated CH-DMRs. f, Permutation testing enrichment (z-scores) of differential elements. z-scores larger than 5 were reduced to 5 for visualization. REs, regulatory elements. g, Relative expression heatmap of HERV-H-int elements that are differentially expressed between hES cells and primed-hiPS cells (n = 167). h, Genome track of a CH-DMR region detected in hES cells versus primed-hiPS cells and associated epigenomic features. Red lines show fibroblast LAD, fibroblast PMD in the primed-hiPS cells and fold enrichment (FE) of H3K9me3 in primary fibroblasts, as indicated. i, Normalized ATAC–seq signal at the LARGE1 promoter. The red arrow highlights the absence of an ATAC–seq peak in primed-hiPS cells. j, Gene expression of LARGE1 in isogenic hES cells, hiPS cells and progenitor fibroblasts. Red arrows indicate repression in primed-hiPS cells and fibroblasts. Source Data
Fig. 5
Fig. 5. Multi-lineage reprogramming and differentiation confirms that TNT reprogramming enhances differentiation.
a, Experimental design for multi-lineage primed and TNT reprogramming and differentiation into five cell types. Top, the four somatic cell lines reprogrammed into primed-hiPS cells and TNT-hiPS cells with three independent reprogrammings (r1–r3) performed per group, and with each subsequently differentiated into five different cell types, with independent replication. Bottom, the number of independent differentiation replicates performed for origin cell types (rows) and differentiated cell types (columns). Coloured circles represent primed-hiPS cell (green), TNT-hiPS cell (yellow) and hES cell (grey). 2° fibroblasts, secondary fibroblasts. b, Endoderm differentiation quantification for hiPS cells derived from secondary fibroblasts, showing the proportion of cells positive for FOXA2 and SOX17 by immunofluorescence analysis. c, Representative images from immunofluorescence analysis of FOXA2 and SOX17 in endoderm differentiation of hiPS cells derived from secondary fibroblasts. The outlined region is enlarged on the right. Scale bars, 100 μm (main image), 50 μm (enlarged region). d, Quantification of multi-lineage cell differentiation in hiPS cell lines by FACS and immunofluorescence analyses using CD56, CD57 (FACS), PAX6 and SOX1 (immunofluorescence) for cortical neuron differentiation, CD146, CD56 (FACS), PAX3 and PAX7 (immunofluorescence) for skeletal muscle differentiation, and CD47, EPCAM (FACS), GATA6 and TTF1 (immunofluorescence) for lung epithelial differentiation. e, Representative images from immunofluorescence analysis of cell differentiation using SOX1 and PAX6 for cortical neurons, PAX3 and PAX7 for skeletal muscle, and GATA6 and TTF1 for lung epithelial cells. Scale bars, 50 μm. f, Phase-contrast images taken four days after passaging plated embryoid bodies during differentiation into NSCs. Large stretched-out fibroblast-like cells are evident during differentiation from primed-hiPS cells (red arrows). g, The percentage of NCAM+FAP cells (from FACS analysis) after plating of embryoid bodies during NSC differentiation. log2FC values are shown on the graph. d,g, Data are mean ± s.d; two-sided t-test for primed versus TNT; ***P < 0.0001, **P< 0.001, *P < 0.05. Details of replication are presented in Methods, ‘Statistics and reproducibility’. Source Data
Extended Data Fig. 1
Extended Data Fig. 1. Distinct trajectories of DNA methylation change throughout human naive and primed reprogramming.
a) Phase contrast images of reprogramming intermediates and hiPSCs throughout primed and naive reprogramming, n = 2 independent experiments. Scale bar: 100 µm. b) Gene expression profiling of marker genes for fibroblasts, Primed-hiPSCs, and Naive-hiPSCs throughout the time course of human reprogramming into both pluripotent states. c) Genome-wide proportion of CG dinucleotides in four categories of methylation levels: high, intermediate, low, and zero. d) Proportion of unmethylated, partially methylated, and fully methylated reads from WGBS libraries. e) Genome-wide levels of CH context DNA methylation (mCH/CH) for all dinucleotide contexts. f) Expression levels of genes encoding key enzymes in the cytosine DNA methylation (DNMTs) and demethylation (TETs) pathways. g) Regulatory element cluster gene examples from Fig. 1e where C-means fuzzy clustering of CG DNA methylation levels in GeneHancer regulatory elements was performed throughout primed and naive reprogramming. h) Genome track of CG DNA methylation levels and gene expression of a cluster 1 element (horizontal bar) encompassing the TWIST1 gene. i) Number of enhancers and promoters that change DNA methylation level > 0.2 between day 0 and day 7 of reprogramming, before cells are cultured in primed or naive media. Motif enrichment analysis shows enhancers that undergo CG demethylation before day 7 are enriched for OKSM factors and AP1 motifs. Enhancers with increased CG methylation between day 0 and day 7 are enriched for HAND1/JUNB motifs. j) Cell lines used to test for CG context differentially methylated regions (DMRs) between Primed-hiPSCs and hESCs. Background column indicates genetic background identifier for the cell line. k) Heatmap representation of CG methylation levels in the CG-DMRs. l) Mean CG DNA methylation changes across hypo-methylated memory CG-DMRs and aberrant hyper-methylated CG DMRs relative to the progenitor fibroblast state (day 0). Each datapoint represents mean CG DNA methylation change compared to d0 for individual samples. m) Genome track showing CG methylation levels for examples of each of the six CG-DMR classes indicated in Fig 1b. n) CG methylation at imprint control regions (ICRs) for paternal germline ICRs and secondary ICRs. Boxplots: median and IQR, whiskers = 1.5 × IQR. n = 1 independent experiment per boxplot. ICRs defined in. Source Data
Extended Data Fig. 2
Extended Data Fig. 2. Reprogramming through the naive state erases somatic cell memory and produces hiPSCs that closely resemble hESCs.
a) Immunostaining of pluripotency markers NANOG and TRA160 for fibroblasts, hESC and different hiPSC lines, n = 2 independent experiments. Scale bar: 100 µm. b) Summary plot of copy number variation (CNV) analysis performed using Illumina 650k arrays. Left grid plot indicates the samples and chromosomes where CNVs were detected. Right plots show B allele frequency (BAF) and log R ratio (LRR) for samples where a CNV was detected, with each datapoint representing variant sites. c) Kernel density plots of DNA methylation difference in CG-DMRs for individual cell lines and replicates relative to the mean methylation of all hESC lines. d) Scatter plot of relative CG DNA methylation difference in CG-DMRs for Primed-hiPSCs, TNT-hiPSCs, and NtP-hiPSCs compared to primed hESC lines (x-axis) and progenitor fibroblasts (y-axis). Each CG-DMRs is represented by an individual point with the methylation values representing the average of all samples in that group. Blue points: hypo-methylated CG-DMRs. Orange points: hyper-methylated CG-DMRs. Dashed lines represent the 0.2 (i.e. 20%) methylation level difference used as a minimum threshold for differential DNA methylation. Kernel density estimate plots (top and right) show the distribution of CG-DMR methylation difference for hypo- and hyper-methylated CG-DMRs. e) Overlap of corrected CG-DMRs for TNT-hiPSCs and NtP-hiPSCs. f) Proportion of CG-DMRs that are corrected by NtP and TNT reprogramming for each category specified in Fig. 2b. g) Number of CG-DMRs corrected by SCNT reprogramming. Raw data are from Ma et al. (2014) for (g-i). h) Scatter plot of relative CG DNA methylation difference in CG-DMRs for Primed-hiPSCs (left) and SCNT-iPSCs (right) compared to primed hESCs (x-axis) and fibroblasts (y-axis) as in (d). i) Histograms showing the difference in DNA methylation level at CG-DMRs for Primed-hiPSCs and SCNT-iPSCs. Vertical dashed lines indicate the 0.2 (i.e. 20%) methylation level difference used as the minimum threshold for differential DNA methylation. Source Data
Extended Data Fig. 3
Extended Data Fig. 3. Reprogramming through the naive state erases somatic cell memory and produces hiPSCs that closely resemble hESCs.
a) Enrichment z-scores determined from permutation testing of enrichment of genomic regions for corrected and uncorrected CG-DMRs. This is an expanded set of regions to those shown in Fig. 3e. b) Proportion of CG-DMRs corrected with respect to whether their genomic location overlaps with the larger CH-DMRs or not. c) Distribution of the difference in CG methylation between hESCs and hiPSCs at CG-DMRs that do or do not intersect CH-DMRs. d) Heatmap of normalised CA methylation levels in CH-DMRs. e) Left panel: aggregate profile plot of CA methylation levels in hyper-methylated CH-DMRs. Right panel: H3K9me3 enrichment in the same CH-DMRs. f) Heatmap representation of CG methylation levels in the CG-DMRs showing Primed-Naive-Primed cells (PNP-hiPSCs) in the context of Primed-hiPSCs, Primed-to-Naive cells (PtN-hiPSCs), and hESCs. g) Aggregate profile plot of CA methylation levels in hypo-methylated CH-DMRs. h) CG methylation levels at maternal germline imprint control regions (ICRs). Boxplots: median and IQR, whiskers = 1.5 × IQR. n = 1 independent experiment per boxplot. i) Estimation of cell diversity after reprogramming fibroblasts by conventional Primed and TNT methods using lentivirus-mediated transduction of a sequence randomly integrated into the genome of primary adult fibroblasts, followed by reprogramming using either the Primed or TNT approach. Genomic DNA was subsequently isolated from the Primed- or TNT-hiPSCs and the locations of the lentivirus insertions in the genome mapped by nanopore sequencing. n = 4 independent reprogramming experiments per group, error bars show mean ±SD. Source Data
Extended Data Fig. 4
Extended Data Fig. 4. Comparison of CG and CH DMRs across studies.
a) Upset plot shows number of CG-DMRs detected for this study and how they overlap with CG-DMRs detected from previously published data processed using identical methods. b) Difference in DNA methylation level between hiPSCs and hESCs at CG-DMRs identified between Primed-hiPSCs and hESCs. Vertical dashed lines indicate the threshold of 20% minimum difference in CG DNA methylation level at CG-DMRs. c) Enrichment z-score determined from permutation testing of enrichment of CG-DMRs in repressive chromatin domains and of d) CH-DMRs in published studies. e) Heatmap of CA methylation levels in CH-DMRs in this study and previously published studies showing Primed-hiPSCs from all studies clustering separately to hESCs. f) Genome track of a CH-DMR region that intersects a PMD, fibroblast lamina associated domain (LAD), and clusters of CG-DMRs in each study. g) Principal component analysis of CG methylation levels in CG-DMRs for all studies combined. Top left plot shows the proportion of variance explained by each principal component. Scatter plots with coloured points show principal component separation of hESCs, Primed-hiPSCs, and TNT-hiPSCs. Ellipses around points indicate 95% confidence interval for a multivariate t-distribution. These data indicate that principal component 3 (PC3) in the bottom left plot clearly separates Primed-hiPSCs and hESCs for all studies, and shows that TNT-hiPSCs are more similar to hESCs by this measure. h) Plots of eigenvalues for each principal component for Primed-hiPSCs, TNT-hiPSCs, and hESCs, and i) data split by study/lab. Red bars indicate P < 0.05 for one-way ANOVA, with FDR reported above red bars. Source Data
Extended Data Fig. 5
Extended Data Fig. 5. Genomic imprinting, X chromosome DNA methylation and neural stem cell differentiation of hiPSCs reprogrammed through the naive state.
a) CG methylation in imprint control regions (ICRs) for fibroblasts and hiPSCs reprogrammed from these fibroblasts. Right grid shows which hiPSC groups had significantly different (t-test FDR < 0.05) CG methylation levels compared to fibroblasts. The data indicate that TNT-hiPSCs do not show an increase in loss of imprinting over Primed-hiPSCs, in contrast to NtP-hiPSCs. ICRs as defined previously. b) Proportion of methylated, unmethylated, and partially methylated WGBS reads in different classes of ICRs. c) Correlation matrix heatmap showing Pearson correlation levels of samples, calculated from CG-DNA methylation levels in 5 kb bins of the X-chromosome. d) Heatmaps of promoter DNA methylation levels split by CG island intersecting promoters (upper) and those promoters not intersecting CG islands (lower). e) Bright field microscopy images of early NSC cultures (3-7 days after plating embryoid bodies) generated from the different hiPSC lines. Large stretched-out fibroblast-like cells are evident during differentiation from Primed–hiPSCs, exemplified by the red arrow. Scale bar: 200 µm. f) UMAP plots from scRNA-seq analysis of early NSC cultures coloured by treatment group (reprogramming method, upper) and cell type classification (lower). Accompanies Fig. 3n. Source Data
Extended Data Fig. 6
Extended Data Fig. 6. Isogenic differentiation and reprogramming system confirms transient-naive-treatment reprogramming enhances epigenome resetting.
a) Phase contrast images showing the generation of fibroblast cells from MEL1 hESCs, where these cells were TRA160 negative and CD90 (Thy1) positive as shown by FACS analysis. Scale bar: 100 µm. b) Immunostaining of pluripotency markers NANOG and TRA160 for the MEL1 hESCs and the different Primed-hiPSC, TNT-hiPSC, and NtP-hiPSC lines derived from the MEL1-derived fibroblast-like cells, n = 2 independent experiments. Scale bar: 100 µm. c) Hierarchical clustering of 5 kb genome bin mCG/CG values for human tissues, cultured fibroblasts, and fibroblasts differentiated from hESCs. Somatic tissue WGBS data from Schultz et al. (2015). d) Upset plot showing the number of intersecting CG-DMRs detected between the hESC and hiPSC lines. e) Heatmap of CG DNA methylation levels in all lines in CG-DMRs detected between isogenic hESCs and Primed-hiPSCs, where r represents the replicate number. f) Histograms of the difference in CG DNA methylation level at CG-DMRs for Primed-hiPSCs, TNT-hiPSCs, and NtP-hiPSCs. Vertical dashed lines indicate the threshold of 0.2 (i.e. 20%) difference in CG DNA methylation level at CG-DMRs. g) Scatter plot of the relative CG DNA methylation difference in CG-DMRs for hiPSCs compared to hESCs (x-axis) and hiPSCs compared to fibroblasts (y-axis). Individual CG-DMRs are represented by individual points. h) Upset plot showing intersecting CG-DMRs detected for isogenic secondary fibroblast Primed-hiPSCs compared with CG-DMRs for primary fibroblast Primed-hiPSCs from this study and samples from previously published studies. i) Aggregate profile plot of CA methylation levels in hyper-methylated CH-DMRs. Source Data
Extended Data Fig. 7
Extended Data Fig. 7. Isogenic differentiation and reprogramming system confirms transient-naive-treatment reprogramming corrects transcriptional profiles of hiPSCs.
a) MA plots showing differentially expressed genes between hESCs and each class of hiPSC (Primed, TNT, NtP). Red points represent significantly differentially expressed genes (log2FC > 1, FDR < 0.05, log2CPM > 1). Plots indicate that TNT-hiPSCs and NtP-hiPSCs are more transcriptionally similar to hESCs than Primed-hiPSCs. b) Barplots (left) show the number of CG-DMRs that intersect promoters, for CG-DMRs detected in hiPSCs compared to hESCs. Colours indicate the proportion of genes linked to promoters that show significant differential expression (FDR < 0.05, log2FC > 1). Scatter plots show the relationship between promoter DNA methylation differences between hiPSCs and hESCs (x-axis) and gene expression differences (y-axis). Individual points indicate DMR-gene pairs, with point colours indicating if the gene was differentially expressed. c) Heatmap showing clustered standardised gene expression values for differentially expressed genes with fibroblast-associated gene ontology terms. d) Gene expression levels for early mesoderm lineage genes. Grey points represent individual samples, n = 2 independent experiments per group, error bars show mean and range. e) Gene expression heatmap of fibroblast-specific genes with retained expression in Primed-hiPSCs. Source Data
Extended Data Fig. 8
Extended Data Fig. 8. Isogenic differentiation and reprogramming system confirms TNT-hiPSCs maintain imprinting and feature corrected transposable element expression.
a) MA plots and b) heatmap representation of differential ATAC-seq peaks between hESCs and hiPSCs, for each class of hiPSC (Primed, TNT, NtP). c) Transcription factors (TFs) with significantly enriched motifs in differential ATAC-seq peaks. d) CG-DNA methylation levels in ICRs for isogenic hESCs and all derived and reprogrammed lines. Grid with red squares on the left indicates if differential methylation between hESC and hiPSC was detected using the two-sample t-test with p < 0.05. ICRs defined in. e) Gene expression heatmap and clustering of imprinted genes for isogenic hESCs, hiPSCs, and fibroblasts. Gene expression values are log2 CPM normalised and z-score scaled. f) Scatter plots of the relationship between DNA methylation change at imprint control regions (ICRs, y-axis) and imprinted gene expression difference for hiPSCs compared to hESCs. Each point represents an ICR and the linked imprinted gene. Yellow box highlights the data points potentially indicative of loss of imprinting (LOI), represented by loss of CG methylation and transcriptional gain. Red points indicate genes that are differentially expressed (log2FC > 1, FDR < 0.05, log2CPM > 1). g) MA plots showing differentially expressed transposable elements (TEs) between hESCs and each class of hiPSC (Primed, TNT, NtP). Red points represent significantly differentially expressed TEs (log2FC > 1, FDR < 0.05, log2CPM > 1), indicating that TNT-hiPSCs are more transcriptionally similar to hESCs than Primed-hiPSCs for TEs. h) Gene expression fold change (y-axis) relative to the distance (x-axis) from a differentially expressed TE. Individual points represent genes, with red points indicating significant differential expression as defined above. Blue line is a loess smoothed curve of fold change values over distance. i) Boxplots with data points show expression level of HERVH-int elements differentially expressed between hESCs and Primed-hiPSCs. boxplots: median and IQR, whiskers = 1.5 × IQR. n = 1 independent experiment per boxplot. n = 1 independent experiment per boxplot. j) Browser screenshot of the HERVH-int_dup2429 locus with CG methylation and normalised ATAC-seq read counts for hESCs and hiPSCs. k) Differential expression heatmap of relative TE expression in HUES2 and HUES3 hESCs and Primed-hiPSCs derived from secondary fibroblasts in matched isogenic systems. Raw data are from and were re-analysed using the same methods as in this study. l) Differential expression heatmap of relative TE expression in hESCs, Primed-hiPSCs, and SCNT-PSCs. Raw data are from Ma et al. (2014) and were re-analysed using the same methods as in this study. Source Data
Extended Data Fig. 9
Extended Data Fig. 9. Evaluation of TNT-hiPSCs using previously published criteria for hiPSC assessment, and TNT and Primed reprogramming of adult dermal fibroblasts, mesenchymal stem cells, and keratinocytes with DNA methylation profiling by WGBS.
a) Genome track of the MYH14/KCNC3 CH-DMR. b) Results from PluriTest showing pluripotency and novelty scores for the isogenic fibroblasts, hiPSCs, and hESCs. c) Boxplots showing CG methylation levels in LTR7 regions. Boxplots: median and IQR, whiskers = 1.5 × IQR. n = 2 independent experiments per boxplot. d) Expression of genes previously defined for classifying hiPSC differentiation capacity, n = 2 independent experiments per group, error bars show mean and range. e) Boxplots of CG methylation in gene regions previously described as being able to segregate hESC and hiPSC lines regardless of the somatic cell source or differentiation state. Boxplots: median and IQR, whiskers = 1.5 × IQR. n = 2 independent experiments per boxplot. f) Heatmap of CG methylation levels in CG-DMRs detected for each origin cell type (HDF: primary human dermal fibroblasts; MSC: mesenchymal stem cells; NHEK: keratinocytes), with hierarchical clustering. g) Profile plots showing CA methylation levels in CH-DMRs where there was a significant difference detected between hiPSCs and hESCs. Upper row shows line plots for each reprogramming replicate, lower row shows replicate mean. h) CG-DNA methylation levels in ICRs. Grid with red squares on the right indicates if differential methylation between Primed and TNT-hiPSCs was detected using the two-sample t-test with p < 0.05. ICRs defined previously. Source Data
Extended Data Fig. 10
Extended Data Fig. 10. Differentiation of hiPSCs.
a) Representative immunofluorescence analysis images of cell differentiation: SOX1 and PAX6 for cortical neuron differentiation; GATA6 and TTF1 for lung epithelial differentiation; PAX3 and PAX7 for skeletal muscle differentiation. Scale bar: 50 μm. b) Representative flow cytometric profile of cell differentiation: CXCR4/SOX17 for endoderm differentiation; CD56/CD57 for cortical neuron differentiation; CD47/EPCAM for lung epithelial differentiation; and CD56/CD146 for skeletal muscle differentiation. c) Representative immunofluorescence analysis images of cell differentiation: SOX17 and FOXA2 for endoderm differentiation; SOX1 and PAX6 for cortical neuron differentiation; GATA6 and TTF1 for lung epithelial differentiation; PAX3 and PAX7 for skeletal muscle differentiation. Scale bar: 50 μm. d) Representative flow cytometric profile of cell differentiation: CXCR4/SOX17 for endoderm differentiation; CD56/CD57 for cortical neuron differentiation; CD47/EPCAM for lung epithelial differentiation; and CD56/CD146 for skeletal muscle differentiation. Replicate details of the differentiation experiments can be found in the ‘Statistic and reproducibility’ section in Methods.

References

    1. Kim K, et al. Epigenetic memory in induced pluripotent stem cells. Nature. 2010;467:285–290. doi: 10.1038/nature09342. - DOI - PMC - PubMed
    1. Polo JM, et al. Cell type of origin influences the molecular and functional properties of mouse induced pluripotent stem cells. Nat. Biotechnol. 2010;28:848–855. doi: 10.1038/nbt.1667. - DOI - PMC - PubMed
    1. Kim K, et al. Donor cell type can influence the epigenome and differentiation potential of human induced pluripotent stem cells. Nat. Biotechnol. 2011;29:1117–1119. doi: 10.1038/nbt.2052. - DOI - PMC - PubMed
    1. Lister R, et al. Hotspots of aberrant epigenomic reprogramming in human induced pluripotent stem cells. Nature. 2011;471:68–73. doi: 10.1038/nature09798. - DOI - PMC - PubMed
    1. Ohi Y, et al. Incomplete DNA methylation underlies a transcriptional memory of somatic cells in human iPS cells. Nat. Cell Biol. 2011;13:541–549. doi: 10.1038/ncb2239. - DOI - PMC - PubMed

Publication types