. 2023 Sep;621(7977):138-145.
doi: 10.1038/s41586-023-06430-9. Epub 2023 Aug 16.

Xiphoid nucleus of the midline thalamus controls cold-induced food seeking

Affiliations

Xiphoid nucleus of the midline thalamus controls cold-induced food seeking

Neeraj K Lal et al. Nature. 2023 Sep.

Abstract

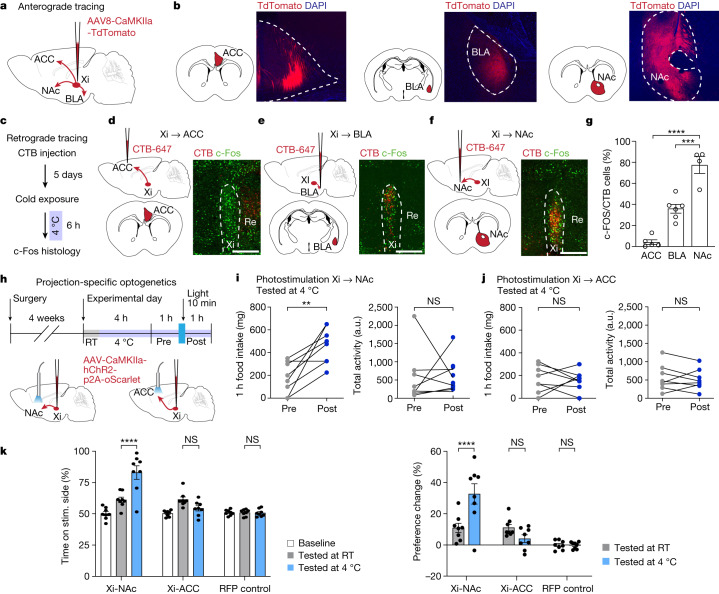
Maintaining body temperature is calorically expensive for endothermic animals1. Mammals eat more in the cold to compensate for energy expenditure2, but the neural mechanism underlying this coupling is not well understood. Through behavioural and metabolic analyses, we found that mice dynamically switch between energy-conservation and food-seeking states in the cold, the latter of which are primarily driven by energy expenditure rather than the sensation of cold. To identify the neural mechanisms underlying cold-induced food seeking, we used whole-brain c-Fos mapping and found that the xiphoid (Xi), a small nucleus in the midline thalamus, was selectively activated by prolonged cold associated with elevated energy expenditure but not with acute cold exposure. In vivo calcium imaging showed that Xi activity correlates with food-seeking episodes under cold conditions. Using activity-dependent viral strategies, we found that optogenetic and chemogenetic stimulation of cold-activated Xi neurons selectively recapitulated food seeking under cold conditions whereas their inhibition suppressed it. Mechanistically, Xi encodes a context-dependent valence switch that promotes food-seeking behaviours under cold but not warm conditions. Furthermore, these behaviours are mediated by a Xi-to-nucleus accumbens projection. Our results establish Xi as a key region in the control of cold-induced feeding, which is an important mechanism in the maintenance of energy homeostasis in endothermic animals.


Conflict of interest statement

The authors declare no competing interests.

Figures

Fig. 1
Fig. 1. Identification of the behavioural and circuit basis of cold-induced feeding.
a, Ninety-hour progression of energy expenditure (EE) and food intake (n = 24 mice). Energy expenditure is represented in green and food intake in black; lines and shading denote mean and s.e.m., respectively, of each group. b, Enlarged view of a during the switch from 23 to 4 °C. c, Scatter plot representing the relationship between energy expenditure and feeding over an 11 h period post temperature switch (during the light cycle, n = 24 mice). Each dot represents average energy expenditure and food intake across all mice at each hour. Arrowheads indicate the key transition period (at 5–6 h) after onset of cold conditions. df, Behavioural analysis of animals undergoing CIEC using a HMM. We defined a three-state HMM: (1) energy conservion; (2) exploration with feeding; and (3) exploration without feeding. We generated the initial estimated transition matrix by assuming equal probabilities for all transitions because we did not have a priori information. d, Representative behavioural events assessed for a male C57BL/6J mouse after being under cold conditions for 5 h. e, Representation of the HMM of CIEC-associated feeding (n = 3 mice). f, Percentage of time spent in each HMM state. g, Enlarged view from a 10 min session of e, showing HMM state assignment. h, Schematics of whole-brain clearing and volumetric three-dimensional imaging used to identify brain regions activated during CIEC. i, c-Fos mapping results for the thalamus. Each dot represents c-Fos+ cell count in each distinct region based on Allen Brain Atlas registration; dot size represents the difference in signal density between the two conditions. Structures activated under thermoneutral temperature are shaded in orange and those activated under cold conditions in blue.
Fig. 2
Fig. 2. Xi activation is associated with CIEC-induced feeding.
a, Schematic showing different cold-exposure paradigms used to label c-Fos expression. b, c-Fos+ neurons (green) in the vMT for each condition shown in a. Yellow-bordered boxes show enlarged images of the Xi region. Scale bars, 200 μm. CM, central medial nucleus; IAM, intrantereomedial nucleus; Re, nucleus reuniens. c, Quantification of c-Fos+ cells under each condition (n = 14 sections from four mice for each condition). Data are mean ± s.e.m. ****P < 0.0001; NS, non-significant using ordinary one-way analysis of variance (ANOVA) with Dunnett’s multiple comparison test. d, Schematic of fibre photometry setup for recording from the Xi. e, Representative image of GCaMP6m-labelled Xi neurons. Scale bar, 500 μm. f,g, Fibre photometry signal of AAV-GCaMP6m-expressing vMT/Xi neurons under cold (f) and thermoneutral (g) conditions, shown as the average of 18 events from four different mice. Solid line represents the average, and shaded area the s.e.m.; red dashed line represents the start of feeding. Insets show an example of a single trace. h,i, Bar graphs of the area under the curve (AUC) dF/F (−20 to 10 s) (h) and peak dF/F percentage (i) for fibre photometry data in f and g, respectively. j, Fibre photometry signal aligned to state 1–2 transition (red dashed line) based on HMM, averaged from 11 events from three different mice; solid line represents average and shaded area is s.e.m. Inset shows an example of a single trace. k,l, Bar graphs of AUC (−10 to 10 s) (k) and peak dF/F (l) quantified from j and Extended Data Fig. 4. Data are mean ± s.e.m. ***P = 0.004 for AUC (h), ****P < 0. 0001 for peak dF/F (i), **P = 0.0017 for AUC (k) and **P = 0.0024 for peak dF/F (l) using two-tailed unpaired t-test. a.u., arbitrary units.
Fig. 3
Fig. 3. Xi neurons modulate CIEC-induced feeding.
a, Schematic showing injection site for AAV-eSARE-ER-Cre-ER and AAV-DIO-hM3Dq or RFP control in the Xi. b, Schematics of vCAPTURE activity-dependent labelling strategy used to express hM3Dq DREADD in CIEC-activated Xi neurons. c, Schematics showing procedures for activity-dependent capture of CIEC versus non-CIEC neurons in the Xi. For vCAPTURE of XiCIEC neurons, tamoxifen was given to mice 5 h after exposure to cold conditions (4 °C). RT, room temperature. d, Representative histology from non-CIEC (30 °C, top) and CIEC (4 °C, bottom) mice used for c-Fos double labelling. Left: vCAPTURE-mediated hM3Dq labelling in the vMT/Xi region; middle: CIEC-activated c-Fos labelling; right: overlay of vCAPTURE and c-Fos double labelling. Scale bars, 500 μm e,f, Quantification of c-Fos double labelling with vCAPTURE neurons in the Xi (16 sections from n = 4 mice). Captured-Gq total numbers (e) and overlap with 4 °C c-Fos (f). Data are mean ± s.e.m. ****P < 0.0001 using two-tailed unpaired t-test. g, Bar graph showing food-intake levels following activation of XiCIEC versus Xinon-CIEC neurons compared with RFP controls (n = 5 mice per group). Data are mean ± s.e.m. *P = 0.0397 and NS = 0.7374 using ordinary one-way ANOVA with Dunnett’s correction for multiple comparisons. h,i, Schematics of vCAPTURE strategy (h) and procedure (i) used to test loss-of-function experiment with DREADD-Gi(hM4Di). Note that mice in this experiment were briefly food restricted (indicated by grey bars) before injection of CNO, to elevate baseline feeding. YFP, yellow fluorescent protein. j, Bar graph showing food-intake levels following inhibition of XiCIEC neurons (n = 4 mice for RFP and n = 4 for Gi). Data are mean ± s.e.m. ***P = 0.0003 using two-tailed unpaired t-test. 4-TM, 4-hydroxytamoxifen.
Fig. 4
Fig. 4. XiCIEC activity represents a context-specific valence.
a, Schematic of viral injection, fibre placement, and  representative histology images. Scale bar, 500 μm. b, Schematic showing vCAPTURE optogenetic experimental procedures. Stim., stimulation. c,d, Difference in food intake under cold conditions for ChR2 mice (n = 9 mice, n = 18 times) (c) and for RFP control mice (n = 7 mice, n = 13 times) (d). e,f, Difference in physical activity under cold conditions for ChR2 mice (n = 9 mice, n = 18 times) (e) and for RFP control mice (n = 7 mice, n = 9 times) (f). Data are mean ± s.e.m. ****P < 0.0001 (c), NS = 0.6953 (d), NS = 0.6287 (e) and NS = 0.7252 (f) using two-tailed paired t-test. g, Total numbers of transitions from state 1 (energy-saving state) to state 2 (exploration with feeding) in ChR2 mice (n = 7 mice). h, State transition from state 1 to state 3 (exploration without feeding). i, Total time spent in different states (n = 7 mice). Data are mean ± s.e.m. ***P = 0.0005 (g), NS = 0.8779 (h), ***P = 0.0006 (i, left), and **P = 0.0046 (i, right) using two-tailed paired t-test. jm, RTPP test. j,k, Representative heatmaps of a ChR2 mouse (j) and RFP control (k). l, Quantification of percentage of time spent on the stimulated side. Data are mean ± s.e.m. ****P < 0.0001 for ChR2 baseline versus ChR2 4 °C and ChR2 RT versus ChR2 4 °C; NS = 0.4589 for ChR2 baseline versus ChR2 RT; NS = 0.7083, 0.9985 and 0.9648 for RFP baseline versus RT, 4 °C and RFP RT versus 4 °C, respectively, using ordinary two-way ANOVA with Tukey’s multiple comparison test (n = 11 for ChR2 and n = 6 for RFP control). m, Percentage change in preference between time spent in stimulation chamber, normalized to laser-off basal level (n = 11 for ChR2 and n = 6 for RFP control). Data are mean ± s.e.m. ****P < 0.0001 for ChR2 RT versus ChR2 4 °C, NS = 0.6887 for RFP RT versus RFP 4 °C using ordinary two-way ANOVA with Tukey’s multiple comparison test.
Fig. 5
Fig. 5. Xi-to-NAc projection mediates CIEC-associated food seeking.
a,b, Schematic for anterograde tdTomato labelling (a). Mice were injected with AAV-CaMKIIa-tdTomato at the Xi and axonal fibres observed in the ACC, BLA and NAc (b) (n = 5 mice). cf, Schematic (c) and representative overlay images between retrograde CTB and c-Fos signals at the Xi: ACC-Xi (d), BLA-Xi (e) and Xi-NAc (f). Scale bars, 200 μm. g, Quantification of CTB/c-Fos overlap. n = 5 for ACC, n = 6 for BLA and n = 4 for NAc. Data are mean ± s.e.m. ****P < 0.0001 for ACC versus NAc and ***P = 0.0002 for BLA versus NAc using ordinary one-way ANOVA with Tukey’s multiple comparison test. h. Schematic of projection-specific optogenetics experiments. i,j, Quantification of change in food intake and physical activity following stimulation of Xi-NAc (i) and Xi-ACC (j) projection during CIEC (n = 8 mice). Data are mean ± s.e.m. **P = 0.0052 for food intake, NS = 0.9163 for physical activity for Xi-NAc (i); NS = 0.8037 for food intake and NS = 0.5893 for physical activity for Xi-ACC using a two-tailed paired t-test (j). k,l, Projection-specific RTPP test. RFP control was injected in the Xi and stimulated at the Xi to control for all projections (n = 8 mice). k, Percentage of time spent on laser stimulation side. Data are mean ± s.e.m. ****P < 0.0001 for Xi-NAc RT versus Xi-NAc 4 °C, NS = 0.3027 for Xi-ACC RT versus Xi-ACC 4 °C, NS > 0.99 for RFP RT versus RFP 4 °C (n = 8 mice per group). l, Percentage change in preference following stimulation, normalized to baseline place preference for the same animal. Data are mean ± s.e.m. ***P = 0.0003 for Xi-NAc RT versus Xi-NAc 4 °C, NS = 0.6413 for Xi-ACC versus Xi-ACC 4 °C and NS > 0.99 for RFP RT versus RFP 4 °C using ordinary two-way ANOVA with Tukey’s multiple comparison test (n = 8 mice per group).
Extended Data Fig. 1
Extended Data Fig. 1. Metabolic changes during CIEC.
ab, Bar graphs showing average food intake (n = 24 mice) (a) and energy expenditure (n = 24 mice) (b) for data presented in Fig. 1a–c. c. Schematic depicting the long-term cold exposure protocol. 5 days (115 h) after being at RT (23 °C), the temperature was switched to 4 °C. white: light phase, grey: dark phase. Data are mean ± SEM. ****P < 0.0001 using two tailed paired t-test. d–e, Quantification of food intake (n = 24 mice) (d) and energy expenditure (n = 24 mice) (e) during light and dark phases before and after the temperature switch. For calculating the average food intake and energy expenditure, values from either 4 days or 4 nights were used for both RT and 4 °C (excluding the day of temperature switch). Data are mean ± SEM. ****P < 0.0001 using a two tailed paired t-test. f, Blood glucose levels of WT mice at 2 h and 4 h after exposure to cold (timepoints are from the same animals) (n = 8 mice). Data are mean ± SEM. **P = 0.001 for comparison between 0 hr and 2 h 4 °C, **P = 0.0028 for 0 h vs 4 h 4C, using a one-way ANOVA with Dunnett’s multiple comparison test.
Extended Data Fig. 2
Extended Data Fig. 2. Representation of Hidden Markov model (HMM) of CIEC paradigm in wild-type mice.
a, Using 15 different labels of actions taken by mice in the CIEC paradigm, a HMM estimated the emission matrix with three states (energy conserving (state 1), exploration with food-seeking and consumption (state 2), and exploration without food-seeking (state 3)). (n = 3 mice). b, Corresponding transition matrix probabilities between each state. c, Transition matrix of different actions taken by the mouse during the CIEC state.
Extended Data Fig. 3
Extended Data Fig. 3. Whole-brain screening of mice in non-CIEC 30 °C or CIEC 4 °C state.
a–g, Brains were harvested from mice undergoing CIEC (6 h at cold 4 °C) or non-CIEC (6 h at thermoneutral 30 °C). n = 4 animals per group. Whole-brain imaging and cFos mapping data for the entire brain in a and individual regions of the cerebral cortex in b, cerebral nuclei c, hypothalamus d, midbrain e, hindbrain f, and cerebellum g. Each dot represents an annotated brain region based on the Allen Brain Atlas. The size of the dots represents the mean differences between warm and cold conditions in each region. Also see supplementary table 1 for all regions. See also Supplementary Table 1.
Extended Data Fig. 4
Extended Data Fig. 4. Activity for Xi neurons during cold sensation vs. CIEC and HMM state transitions.
a, cfos quantification of Re region from main Fig. 2b. (n = 4 mice for each condition). Data are mean ± SEM. ns, non-significant using Ordinary one-way ANOVA with Dunnet’s multiple comparison test. b, representative images of MnPO (at Bregma 0.14) for same experiment as shown in main Fig. 2a–c. c, Representative Xi images from mice after 7 days of cold exposure (n = 4 for RT and cold). d, Representative Xi c-Fos images from female mice after 5 h of cold exposure. (n = 2 for RT, n = 3 for cold). Scale bar: 200 μm. e, Average calcium signal from Xi neurons while the ambient temperature ramped down from 23 °C to 4 °C. (averaged from n = 3 mice). f–g, Xi calcium signal for mice undergoing CIEC or a CIEC+ state (4 °C without food for 3 hrs to generate exacerbated cold-induced energy compensation), dotted red line indicates a single feeding bout. (n = 4 mice). Solid line is average and shaded area is SEM. h, Quantification of AUC delta F/F and peak delta F/F. Data are mean ± SEM. ****P < 0.0001, **P = 0.01 using two tailed unpaired t-test. (n = 4 mice) i, Averaged calcium signal from Xi neurons from mouse undergoing CIEC, averaged from 11 events from 3 different mice. Solid line is average and shaded area is SEM. The red dotted line is the state transition time point calculated using HMM. j–k, Fiber photometry signal of AAV-GCaMP6m expressing vMT/Xi neurons after overnight fasting during refeeding at room temperature (j) or at 30 °C (k), shown as the average of 35 events from 5 different mice for (j) and 31 events from 5 different mice for (k). Solid line is average and shaded area is SEM. l, Bar graph showing the area under the curve (AUC) dF/F (−20 s to 10 s) for j,k and main Fig. 2f, g. Data are mean ± SEM. ****P < 0.0001, ns = 0.8572 for comparison between 30 °C feeding and fasting-refeeding at 30 °C, ns = 0.1678 for comparison between 30 °C feeding and fasting-refeeding at 23 °C using a one-way ANOVA with Dunnett’s multiple comparison test.
Extended Data Fig. 5
Extended Data Fig. 5. Hormonal and metabolic profiling of mice undergoing CIEC vs mice exposed to thermoneutral conditions.
a–b, Quantification of circulating leptin levels in mice after being in cold (a) or at 30 °C (thermoneutral) (b) for given amount of time (n = 4 mice). c–f, Quantification of plasma glycerol (c and d) and free fatty acids (e and f) for mice in cold or or at 30 °C (thermoneutral) (n = 4 mice). Data are mean ± SEM. *P = 0.0143 for FFA in cold using a one-way ANOVA with Dunnett’s multiple comparison test.
Extended Data Fig. 6
Extended Data Fig. 6. Reactivation of cold- vCAPTURE DREADD Xi neurons at room temperature.
a, Schematic and representative histology section from vCAPTURE DREADD Gi mouse. Scale bar: 500 μm. b, Food intake for cold-vCAPTURED Xi Gq activated at 23 °C (n = 5 for RFP and Gq). c, Food intake data for cold-vCAPTURED Xi Gi at 23 °C (n = 4 for RFP and n = 8 for Gi). Data are mean ± SEM. ns > 0.99 for Gq, ns = 0.9163 for Gi food intake at 23 °C using two tailed unpaired t-test.
Extended Data Fig. 7
Extended Data Fig. 7. Constitutive optogenetic activation of Xi neurons during CIEC.
a, Schematic and representative histology section from a mouse injected with constitutive (hSyn-ChR2) at the Xi. Scale bar: 500 μm. b, Experimental design for testing the effect of bulk activation of Xi and surrounding neurons on CIEC-associated feeding. c–e, Food intake pre- and post-stimulation (n = 8 mice, N = 16 times) (c) and d–e physical activity (measured as total distance traveled) pre- and post-stimulation (d) (n = 8 mice) and individual traces of physical movement of a single animal (e). Data are mean ± SEM. ****P < 0.0001 and *P = 0.0184 using two-tailed paired t-test. f, Food intake and physical activity of animals expressing constitutive ChR2 in the Xi at RT (n = 8 animals) Data are mean ± SEM. ****P < 0.0001, **P = 0.0096 using two-tailed paired t-test.
Extended Data Fig. 8
Extended Data Fig. 8. vCAPTURE Xi-CIEC optogenetics, open field test, and HMM state transition.
a, Schematic of the open field test. b–d, Quantification of time spent outside (b) or time spent inside (c) (or the ratio thereof (d) following activation of vCAPTUREd XiCIEC neurons in ChR2 or RFP control mice (n = 11 for ChR2 and n = 6 for RFP). Data are mean ± SEM. ns = 0.6087 for (b) and (c), ns = 0.5380 for (d) using two tailed unpaired t-test. e–f, Bar graph showing the difference in food intake at thermoneutral temperature pre- and post-laser stimulation for ChR2 mice in e (n = 11) and RFP mice in f (n = 11). Data are mean ± SEM. ns = 0.1501 for e and ns = 0.4650 for f using two tailed paired t-test. g–h, Food intake (g) and physical activity (h) for vCAPTURED XiCIEC mice stimulated at room temperature (n = 11 mice). Data are mean ± SEM. ns = 0.1530 for g and ns = 0.7614 for h using two tailed paired t-test. i, Continuous state probability calculated for ChR2 mouse, pre-stimulation (white background) or post-stimulation (blue background) while undergoing CIEC (n = 7 mice).
Extended Data Fig. 9
Extended Data Fig. 9. XivGLUT2 neurons mediate CIEC-associated behavior.
a, Schematic and representative histology showing injection of a viral AAV-DIO-ChR2 and optogenetic implant at the Xi (solid white line indicates fiber track) in vGLUT2 animals. Scale bar: 500 μm. b–c, Food intake in cold pre- and post-stimulation for vGLUT2-ChR2 mice (b) (n = 8 mice) and for vGLUT2-RFP control mice (c) (n = 8 mice). d-e, Food intake for vGLUT2-ChR2 mice (d) and vGLUT2-RFP mice (e) pre- and post-stimulation under thermoneutral conditions. f, Schematic and histology of vGAT2 animals. Scale bar: 500 μm. g–j, Food intake in cold pre- and post-stimulation (g–h), and under thermoneutral conditions (i-j). Data are mean ± SEM for b-j. ***P = 0.009 for b, ns = 0.7849 for c, ns = 0.4869 for d, ns = 0.8018 for e, ns = 0.6682 for g, ns = 0.8383 for h, ns = 0.5490 for i, ns = 0.47 for j by two tailed paired t-test. k, Schematic of fiber photometry setup for recording from vGLUT2-Xi injected with Dio-GCamp6m at the Xi in vGLUT2 animals. l, Fiber photometry signal of AAV-Dio-GCaMP6m expressing in vGLUT2-Xi neurons in the cold, shown as the average of 15 events from 4 different mice. Solid line is average and shaded area is SEM.
Extended Data Fig. 10
Extended Data Fig. 10. Xi-NAc but not Xi-BLA regulate CIEC-associated feeding.
a, Schematic of viral AAV-ChR2 injection at the Xi and optogenetic implant above the BLA in WT animals. b, Food intake and physical activity in cold pre- and post-laser stimulation for Xi-BLA mice (n = 8 mice). Data are mean ± SEM, ns = non-significant using two tailed paired t-test. c, Schematic of AAV-ChR2 injection at the Xi and optogenetic implant above both the BLA and NAc in the same animal. d–e, Timeline (d) and food intake data (e) for the experiment in which the BLA was stimulated first and then the NAc. Food intake is plotted for pre-stimulation, post-stim for the BLA, and post-stim for the NAc. f–g, Timeline (f) and food intake data (g) for experiment in which the NAc was stimulated before the BLA. Data are mean ± SEM. **P = 0.0063, ns = 0.8083 for e, **P = 0.0028, ns = 0.7924 for g using a one-way ANOVA with Dunnett’s multiple comparison test.

Update of

References

    1. Macari M, Dauncey MJ, Ingram DL. Changes in food intake in response to alterations in the ambient temperature: modifications by previous thermal and nutritional experience. Pflugers Arch. 1983;396:231–237. doi: 10.1007/BF00587860. - DOI - PubMed
    1. Brobeck JR. Food intake as a mechanism of temperature regulation. Yale J. Biol. Med. 1948;20:545–552. - PMC - PubMed
    1. Blaxter, K. Energy Metabolism in Animals and Man (Cambridge Univ. Press, 1989).
    1. Yanovski JA, et al. A prospective study of holiday weight gain. N. Engl. J. Med. 2000;342:861–867. doi: 10.1056/NEJM200003233421206. - DOI - PMC - PubMed
    1. Zorbas C, et al. The relationship between feasting periods and weight gain: a systematic scoping review. Curr. Obes. Rep. 2020;9:39–62. doi: 10.1007/s13679-020-00370-5. - DOI - PubMed

Publication types