. 2023 Aug;620(7975):839-848.
doi: 10.1038/s41586-023-06426-5. Epub 2023 Aug 16.

Nuclear genetic control of mtDNA copy number and heteroplasmy in humans

Affiliations

Nuclear genetic control of mtDNA copy number and heteroplasmy in humans

Rahul Gupta et al. Nature. 2023 Aug.

Erratum in

Abstract

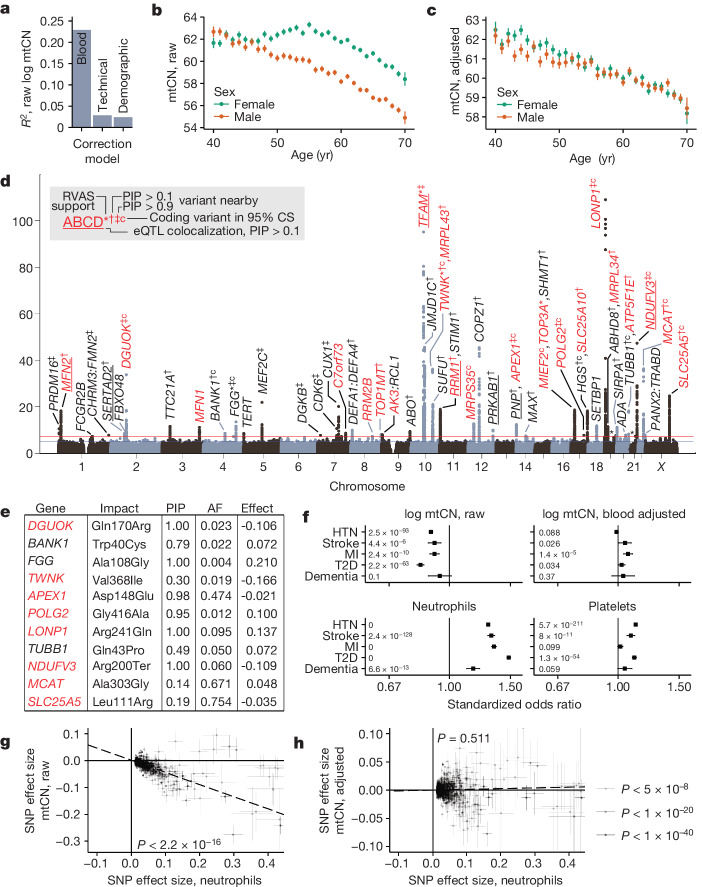
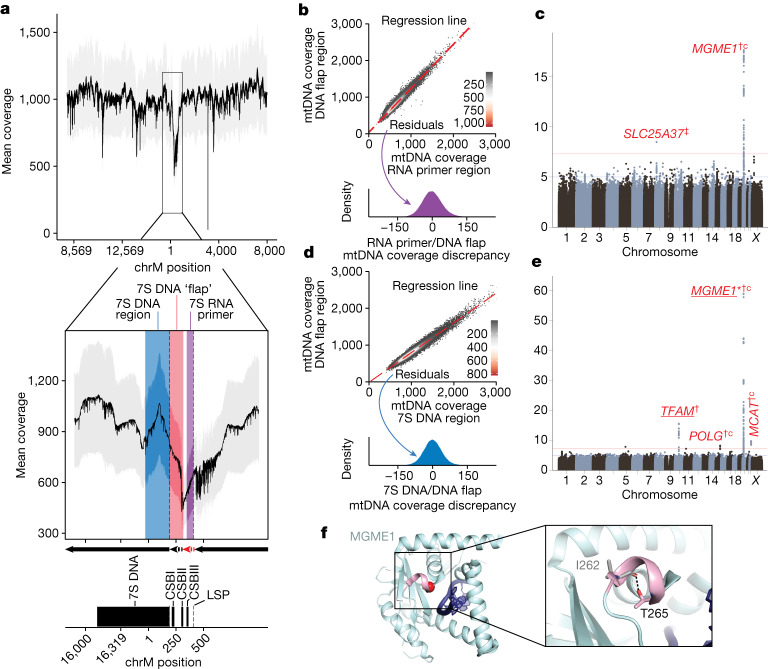
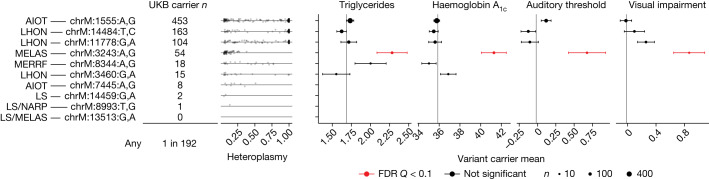
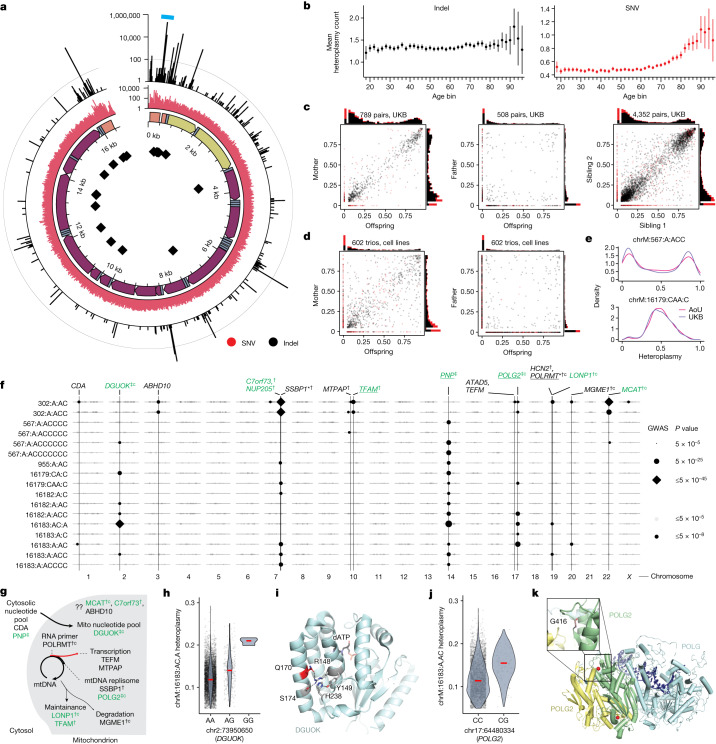
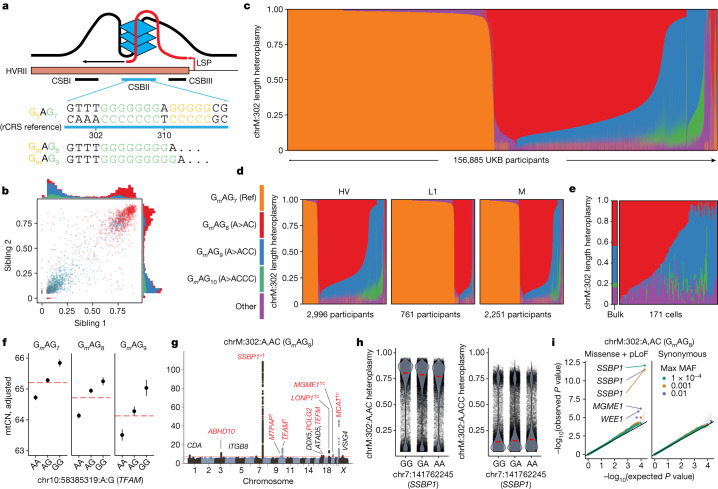
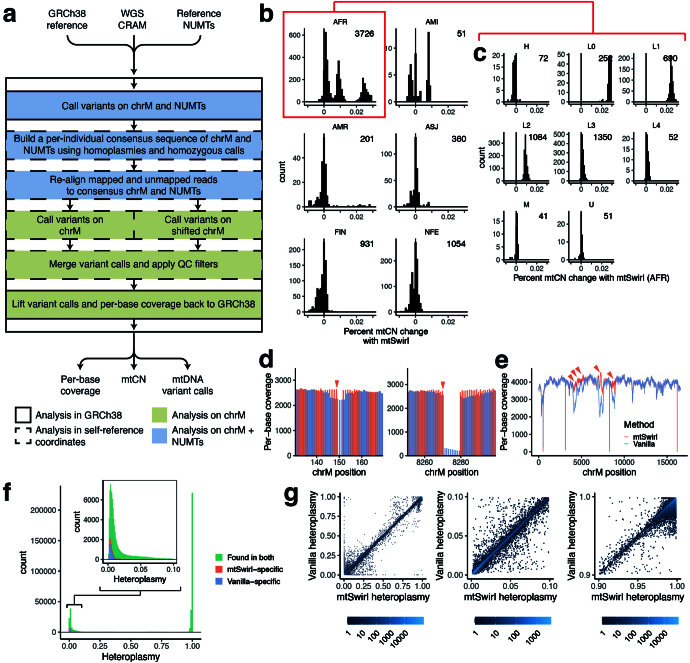
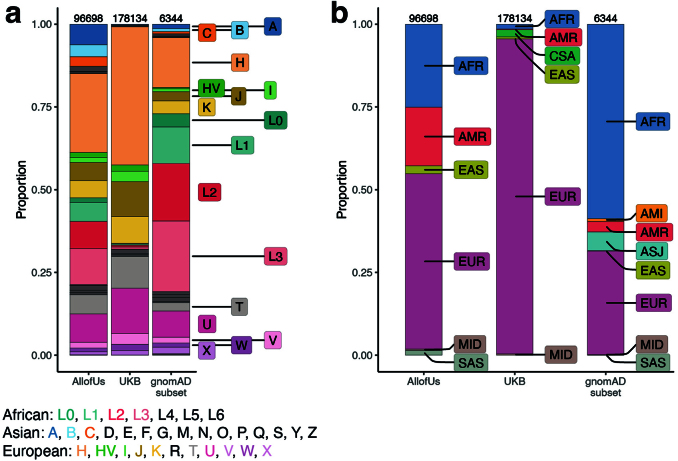
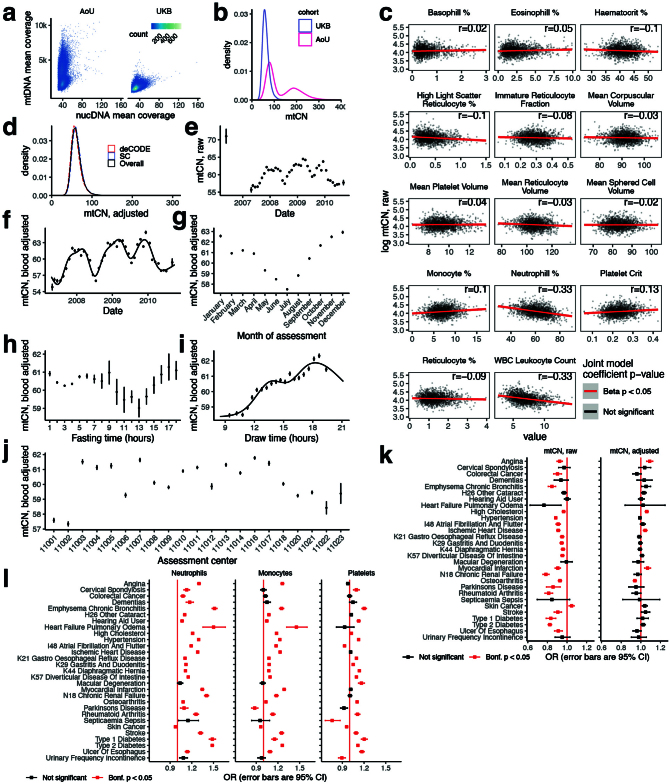
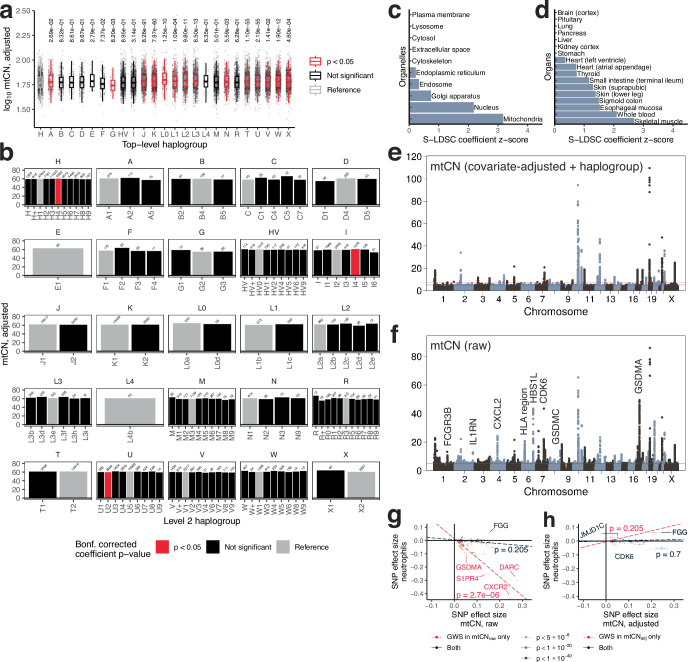
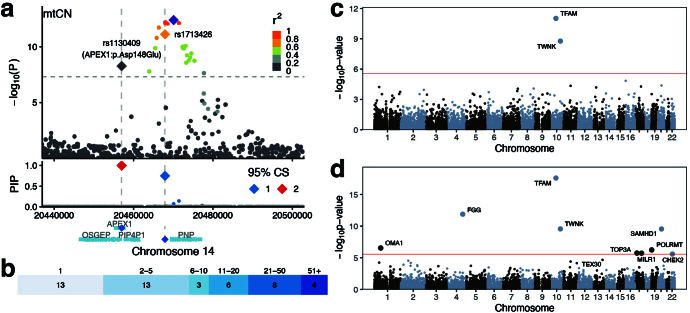
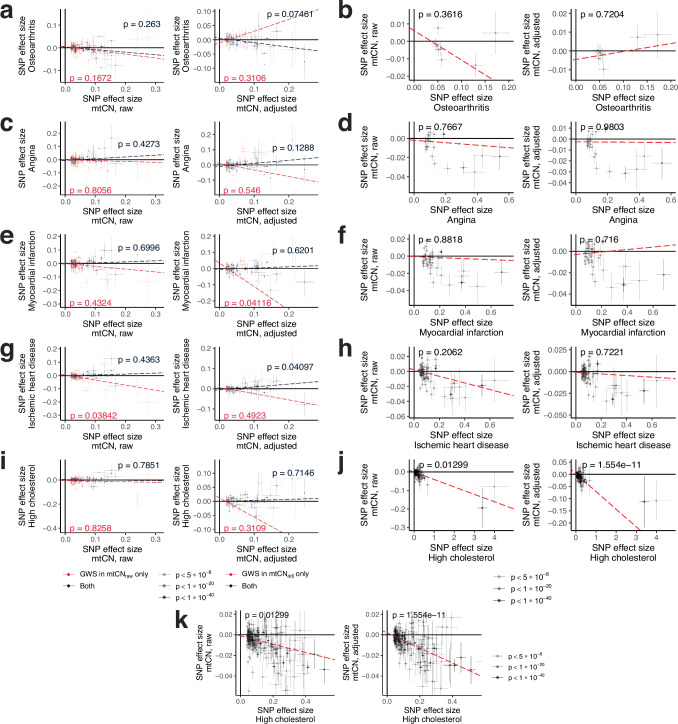
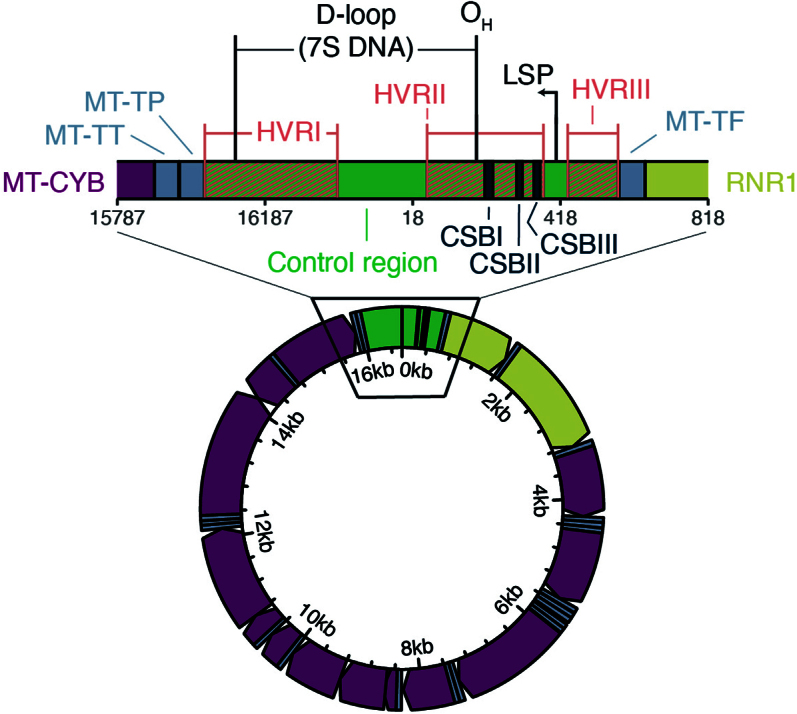
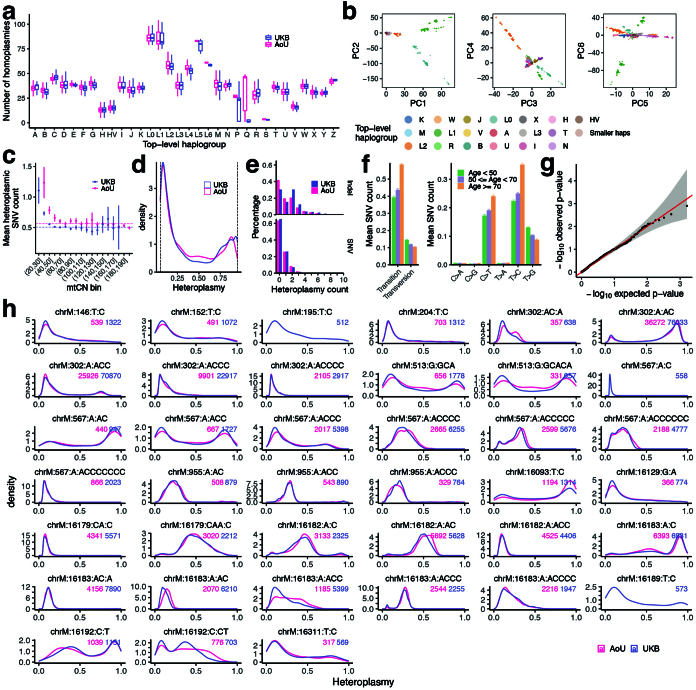
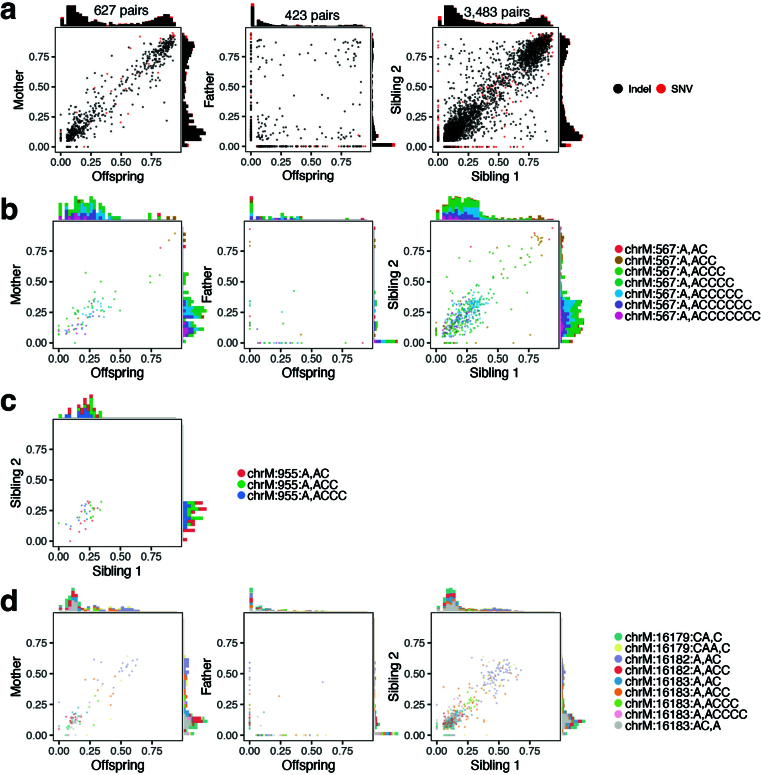
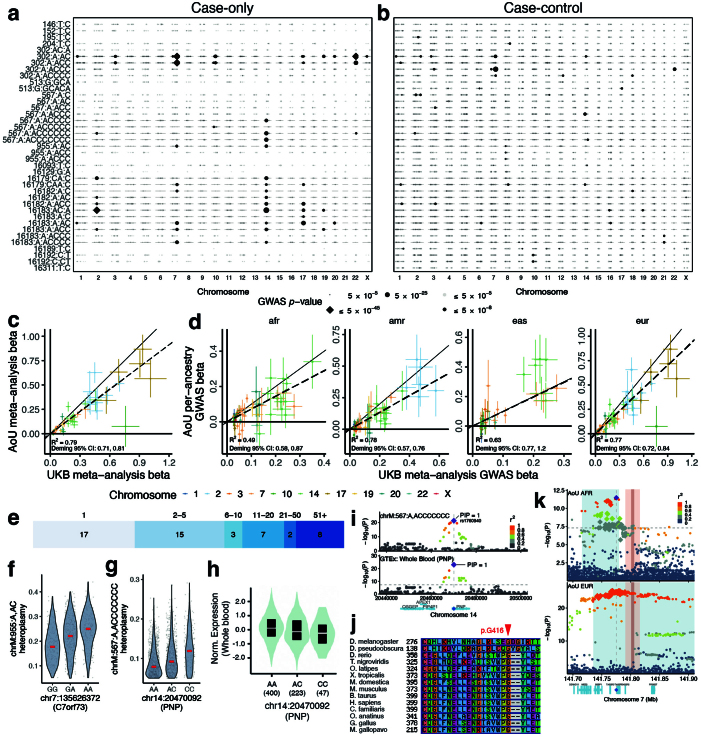
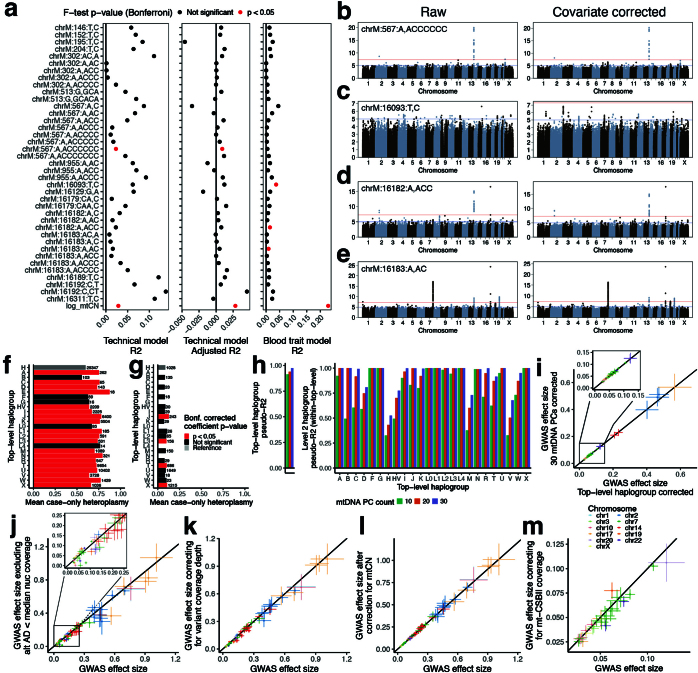
Mitochondrial DNA (mtDNA) is a maternally inherited, high-copy-number genome required for oxidative phosphorylation1. Heteroplasmy refers to the presence of a mixture of mtDNA alleles in an individual and has been associated with disease and ageing. Mechanisms underlying common variation in human heteroplasmy, and the influence of the nuclear genome on this variation, remain insufficiently explored. Here we quantify mtDNA copy number (mtCN) and heteroplasmy using blood-derived whole-genome sequences from 274,832 individuals and perform genome-wide association studies to identify associated nuclear loci. Following blood cell composition correction, we find that mtCN declines linearly with age and is associated with variants at 92 nuclear loci. We observe that nearly everyone harbours heteroplasmic mtDNA variants obeying two principles: (1) heteroplasmic single nucleotide variants tend to arise somatically and accumulate sharply after the age of 70 years, whereas (2) heteroplasmic indels are maternally inherited as mixtures with relative levels associated with 42 nuclear loci involved in mtDNA replication, maintenance and novel pathways. These loci may act by conferring a replicative advantage to certain mtDNA alleles. As an illustrative example, we identify a length variant carried by more than 50% of humans at position chrM:302 within a G-quadruplex previously proposed to mediate mtDNA transcription/replication switching2,3. We find that this variant exerts cis-acting genetic control over mtDNA abundance and is itself associated in-trans with nuclear loci encoding machinery for this regulatory switch. Our study suggests that common variation in the nuclear genome can shape variation in mtCN and heteroplasmy dynamics across the human population.


Conflict of interest statement

V.K.M. is a paid advisor to 5am Ventures. B.M.N. is a member of the scientific advisory board at Deep Genomics and Neumora and a consultant of the scientific advisory board for Camp4 Therapeutics. K.J.K. is a consultant for Vor Biopharma. The remaining authors declare no competing interests.

Figures

Fig. 1
Fig. 1. Genetic and phenotypic determinants of mtCN in UKB.
a, Variance explained in mtCN by correction models. b,c, Mean mtCNraw (b) and mtCNadj (c) as a function of age and genetic sex. For b and c, mtCN is copies per diploid nuclear genome, error bars are mean ± 1 s.e.m., and total n = 178,129 and 164,798, respectively. d, GWAS Manhattan plot from UKB cross-ancestry meta-analysis. Labelled genes were obtained using fine-mapping, rare variant evidence or nearest gene. Red genes encode mitochondrial proteins or are implicated in mtDNA disease; *gene at GWS for the Cauchy P value from RVAS; CS variants proximal to the gene with PIP > 0.1; CS with PIP > 0.9; ‘c’, coding variant in the CS; underline, eQTL colocalization PIP > 0.1. Asterisks above peaks on chr 19 and 21 correspond to GP6 and RUNX1, respectively. e, Variants in the 95% CS with PIP > 0.1 causing a protein-altering change. f, Standardized odds ratios for log mtCNraw, log mtCNadj and major blood composition phenotypes in predicting risk of selected common diseases in UKB. Inset numbers are two-sided raw P values with Bonferroni P value cut-off = 0.0025; error bars are 95% confidence intervals (95% CIs) around odds ratios (ORs); sample sizes are in Supplementary Table 8. HTN, hypertension; MI, myocardial infarction; T2D, type 2 diabetes. g,h, Correlations between effect sizes for lead SNPs detected at GWS for neutrophil count between neutrophil count and mtCNraw (P = 4.4 × 10−73) (g) and mtCNadj (P = 0.511) (h). Error bars represent 1 s.e., dotted line is weighted least squares regression line, inset corresponds to regression P value. AF, allele frequency.
Fig. 2
Fig. 2. Nuclear genetic control of relative mtDNA coverage in the NCR.
a, Mean UKB mtDNA per-base coverage. Dropdown highlights coverage depression in the mtDNA NCR. Arrows refer to mtDNA replication products: red dashed arrow, RNA primer; black dashed arrow, transient DNA ‘flap’; black solid arrow, replicated mtDNA. Grey ribbon is ±1 s.d. CSB, conserved sequence box. b, Two-dimensional (2D) histogram showing mtDNA coverage in the DNA flap region versus RNA primer region. Red line is linear fit, from which the residual is used as a ‘coverage discrepancy’. The distribution of these residuals is shown in the lower panel. c, GWAS Manhattan plot of the discrepancy of mtDNA coverage in the DNA flap region versus RNA primer region (see b). d, 2D histogram showing mtDNA coverage in the DNA flap region versus 7S DNA region. As in b, red line is linear fit, and the residual is shown as a density in the lower panel. e, GWAS Manhattan plot of the discrepancy of mtDNA coverage in the DNA flap region versus 7S DNA region (see d). Red genes are mitochondria-relevant; *gene with Cauchy P value at GWS from RVAS; CS variants proximal to the gene with PIP > 0.1; proximal CS variants with PIP > 0.9; ‘c’, missense variant identified in the CS; underline, eQTL colocalization with PIP > 0.1. f, Structure of MGME1 (5ZYV from RSCB under CC0 license; 10.2210/pdb5zyv/pdb) with bound single-stranded DNA in dark blue, the 310 helix in pink and the T265 alpha carbon as a red sphere. Inset shows the hydrogen bond between T265 and I262.
Fig. 3
Fig. 3. Carrier frequencies and intermediate phenotypes for pathogenic mtDNA mutations assessed in UKB.
Carrier frequencies for ten pathogenic mutations in UKB, with heteroplasmy distributions plotted as jittered points and annotations corresponding to canonically associated disease(s). Panels show mean triglyceride levels, haemoglobin A1c, auditory threshold (by means of speech-recognition threshold test) and visual impairment (logMAR, by means of vision test) among mtDNA variant carriers. Point size corresponds to number of carriers with available phenotype data (n); only points with more than 10 measurements are shown. Vertical lines represent trait means among individuals not carrying any of the ten variants. Error bars, ±1 s.e.m. AIOT, aminoglycoside-induced ototoxicity; LHON, Leber’s hereditary optic neuropathy; MERRF, myoclonic epilepsy with ragged red fibres; LS, Leigh syndrome; NARP, neuropathy, ataxia, retinitis pigmentosa; FDR, false discovery rate.
Fig. 4
Fig. 4. Pervasive nuclear genetic control over common mtDNA heteroplasmies.
a, Quality control (QC)-passing mtDNA heteroplasmies in UKB and AoU. From the inside: mtDNA positions of poly-C tracts; genomic annotations (orange, HVR; yellow, rRNA genes; blue, tRNA genes; purple, coding genes); heteroplasmic SNV counts (red); heteroplasmic indel counts (black). The teal arc region is the focus of Fig. 5. Line in outermost track, 100 indels. b, Mean heteroplasmy count per individual across age groups in AoU. Error bars are 1 s.e.m.; total n = 95,328. c, Heteroplasmy transmission in mother versus offspring (left), father versus offspring (middle) and sibling versus sibling (right) for UKB heteroplasmic variants. d, Heteroplasmy transmission in 1000G cell lines in mother versus offspring (left) and father versus offspring (right) pairs. e, Selected heteroplasmy distributions among carriers. For panels ad, red, SNV; black, indels. f, GWAS lead SNPs from common heteroplasmies with any signals at GWS. Point size corresponds to lead SNP two-sided P value; dark points are at GWS. Vertical lines, SNPs identified for multiple mtDNA variants or near genes of interest. Green, genes also nominated for mtCN; *has Cauchy P value at GWS from RVAS; CS variants with PIP > 0.1; CS variants with PIP > 0.9; ‘c’, coding variant in CS; underline, eQTL colocalization with PIP > 0.1. g, Role of genes identified by heteroplasmy GWAS in mtDNA dynamics. h, chrM:16183:AC,A heteroplasmy versus DGUOK lead SNP genotype. i, Structure of DGUOK (2OCP from RSCB under CC0 license; 10.2210/pdb2ocp/pdb) with Q170 in red, nearby residues participating in hydrogen bonds or stacking interaction in pink, and dATP as black sticks. j, chrM:16183:A,AC heteroplasmy versus POLG2 lead SNP genotype. k, Structure of polymerase gamma (4ZTU from RSCB under CC0 license; 10.2210/pdb4ZTU/pdb) with POLG in light blue and POLG2 subunits in green/yellow. Bound DNA is in dark blue; POLG2 residue G416 is shown as red spheres. In panels h and j, red lines, median.
Fig. 5
Fig. 5. Length heteroplasmies at chrM:302 are inherited maternally as mixtures, co-exist in single cells and are under the influence of variation in the nuclear genome.
a, Scheme of chrM:302 region with associated G-quadruplex and length heteroplasmy (GmAGn) nomenclature. b, Sibling–sibling transmission of chrM:302 length heteroplasmies. ce, chrM:302 length heteroplasmy composition across UKB (c), within select UKB mtDNA haplogroups (d) and across 171 single cells in whole blood (e). For ce, each vertical bar corresponds to a single individual (c,d) or cell (e). For be, colours correspond to the legend next to panel d. f, Mean mtCNadj as a function of major chrM:302 allele (red line) and TFAM allele (black dot). Error bars, mean ± 1 s.e.m.; mtCN, copies per diploid nuclear genome; total n = 121,816. g, Case-only mtDNA heteroplasmy GWAS Manhattan plot for chrM:302:A,AC. Red genes are mitochondria-related; *gene with RVAS Cauchy P value at GWS; CS variants proximal to the gene with PIP > 0.1; ‘c’, missense variant identified in the CS; underline, eQTL colocalization with PIP > 0.1. h, chrM:302 heteroplasmy as a function of highest PIP SNP genotype in SSBP1 locus. Red line, median. i, Quantile–quantile plots of gene-based SKAT-O P values from RVAS for chrM:302:A,AC. Colours represent max MAF of included variants, black line is null expectation, error band is 95% CI under the null. Ref, reference.
Extended Data Fig. 1
Extended Data Fig. 1. Copy number and heteroplasmy estimation improvements using mtSwirl pipeline.
a. Overview of mtSwirl pipeline workflow. Colors represent genomic region analyzed (blue = chrM and NUMTs; yellow = chrM only); border style represents coordinate system (solid = GRCh38; dashed = self-reference coordinates). All output is in GRCh38. b. Percent change in mtCN estimated using ”vanilla” pipeline versus mtSwirl as a function of inferred nuclear ancestry. c. Percent change in mtCN among AFR individuals as a function of mtDNA haplogroup. d. Example of per-base coverage improvement with mtSwirl near a homoplasmic indel, likely due to use of mtDNA self-reference sequence. Arrows highlight homoplasmic indels. e. Example per-base coverage improvement likely due to reduced mis-mapping to nucDNA. Arrows highlight coverage improvements. f. Variant calls found using both pipelines (green), only in mtSwirl (red), and only in “vanilla” (blue). Inset corresponds to zoomed view of low heteroplasmy variants. g. 2D histogram showing relationship between heteroplasmy estimates using mtSwirl with ”vanilla”. Left panel corresponds to overall heteroplasmy space; middle is zoomed to low heteroplasmy variants; right is zoomed to high heteroplasmy variants.
Extended Data Fig. 2
Extended Data Fig. 2. Composition of cohorts used in this study.
a. Top-level haplogroups represented in each analyzed cohort. Labeled haplogroups comprise > 1.5% of the samples in at least one cohort. Haplogroups are mapped to broad ancestral categories as indicated by the text below the plot with colors corresponding to the colors of the labeled haplogroups. b. Inferred nuclear genetic ancestry groups in each analyzed cohort. Ancestry group assignment was completed within each cohort. The NFE and FIN groups in gnomAD were combined under “EUR” for the purposes of this comparison. In both panels, numbers at the top of each bar indicate the number of samples with generated mtDNA callsets passing QC with completed genetic ancestry assignment.
Extended Data Fig. 3
Extended Data Fig. 3. mtCN shows substantial correlations with technical and biological covariates.
a. Bivariate mean coverage distributions across nucDNA and mtDNA in AoU and UKB. b. Distributions of mtCN per diploid nuclear genome across AoU and UKB. c. Correlations between log mtCN and blood cell traits in UKB. Line corresponds to ordinary least squares fit; line color corresponds to the raw coefficient p-value of a joint model regressing log mtCNraw on all blood cell phenotypes. Inset is Pearson correlation coefficient. d. Distribution of mtCNadj in UKB. Color corresponds to sequencing center; black is the combined density. e. Mean mtCNraw versus assessment date, binned into months. Total N = 196,372. Pilot month samples are removed from subsequent analyses. f. Mean blood-corrected mtCN as a function of assessment date; line is a natural spline with knots positioned seasonally; total N = 179,626. g. Mean blood-corrected mtCN as a function of assessment month; total N = 179,626. h. Mean blood-corrected mtCN as a function of self-reported fasting time; total N = 179,623. i. Mean blood-corrected mtCN as a function of draw time; line corresponds to natural spline with 5 knots; total N = 179,601. j. Mean blood-corrected mtCN as a function of assessment center; total N = 179,626. k. OR of raw and corrected mtCN in predicting 29 common diseases in UKB. l. OR of top blood cell composition traits in predicting any of 29 common diseases in UKB. For e-j error bars correspond to mean +/− 1 s.e.m.. For k-l error bars correspond to 95% CI around the OR, and sample sizes for each comparison can be found in Supplementary Table 8. All tests are two-sided.
Extended Data Fig. 4
Extended Data Fig. 4. The genetic architecture of mtDNA copy number is influenced by blood cell traits but not haplogroup.
a. log10 mtCNadj per diploid nuclear genome as a function of major top-level haplogroup. Points have been downsampled to at most 1,000 per haplogroup. Color and inset represents two-sided raw regression coefficient p-value from a joint linear model regressing log mtCN onto top-level haplogroup. b. Mean mtCNadj as a function of “level 2” haplogroup. Colors correspond to two-sided coefficient p-values for a joint model regressing log mtCN onto level 2 haplogroups within each top-level haplogroup, corrected for multiple testing using the Bonferroni approach across 25 top-level haplogroups. c. Enrichment of genome-wide signal near genes annotated to localize to each organelle and d. near genes highly expressed in each tissue. e. GWAS Manhattan plot of mtCNadj additionally corrected for top-level haplogroup. f. GWAS Manhattan plot of mtCNraw. Labels indicate genes proximal to a non-exhaustive set of selected loci with substantially less-significant p-values in the corrected analysis. g. Correlation between effect sizes for lead SNPs at GWS detected for raw mtCN between mtCNraw and neutrophil count. h. Correlation between effect sizes for lead SNPs at GWS detected for mtCNadj between mtCNadj and neutrophil count. In panels g-h, error bars represent effect size +/− 1 s.e., dotted line corresponds to inverse variance weighted least squared regression line; inset corresponds to regression p-value. Regression fits were performed separately for loci genome-wide significant for both mtCNraw and mtCNadj (black) and for loci specific to each (red).
Extended Data Fig. 5
Extended Data Fig. 5. Fine-mapping and RVAS of UKB mtCNadj.
a. Upper panel shows UKB mtCNadj GWAS meta-analysis p-values at the chromosome 14 locus, visualized in GRCh38. Middle panel shows variants in the two 95% credible sets identified at this locus, with large diamonds corresponding to the highest PIP variants in each credible set. Bottom panel shows protein-coding gene annotations at this locus. Variant overlapping APEX1 is a missense variant in APEX1. b. Distribution of sizes of credible sets identified via fine-mapping for mtCNadj. Numbers atop shaded region correspond to size of CS; numbers within shaded region corresponds to the count of credible sets of that size. RVAS gene-based Manhattan plot showing SKAT-O p-values using missense + LoF variation restricted to variants with MAF c. < 0.0001 and d. < 0.01. Red line is genome-wide significant at 0.05/number of genes tested.
Extended Data Fig. 6
Extended Data Fig. 6. Bidirectional Mendelian randomization within UKB between mtCN and associated disease traits.
Correlation between effect sizes for lead SNPs detected for raw (left) and adjusted (right) mtCN between the respective mtCN phenotype and a. Osteoarthritis, c. Angina, e. Myocardial infarction, g. Ischemic heart disease, i. High cholesterol. Correlation between effect sizes for lead SNPs detected for b. Osteoarthritis, d. Angina, f. Myocardial infarction, h. Ischemic heart disease, j. High cholesterol and raw (left) and adjusted (right) mtCN. A zoomed-in version of j is shown in panel k. In all panels, points are GWAS effect sizes, error bars represent effect sizes +/− 1 s.e., dotted line corresponds to inverse variance weighted least squared regression line; inset corresponds to regression p-value. Regression fits were performed separately for loci genome-wide significant for both mtCNraw and mtCNadj (black) and for loci specific to each (red) for the analysis of mtCN effect on disease traits. Overall GWAS sample sizes are: Osteoarthritis – 420,473, Angina – 420,473, Myocardial infarction – 397,117, Ischemic heart disease – 419,724, High cholesterol – 420,473, mtCN raw – 163,372, mtCN adjusted – 163,372.
Extended Data Fig. 7
Extended Data Fig. 7. Organization of the mtDNA non-coding region.
Colors indicate annotation type. Yellow, rRNA gene; steel, tRNA gene; purple, coding genes; green, non-coding region (also referred to as the control region); midnight, conserved sequence boxes (CSB); salmon stripe pattern, hyper-variable regions (HVR). The mtDNA D-loop refers to the region within the non-coding region often showing triple-stranded DNA due to the persistence of the 7S DNA. Annotations are oriented with the rCRS reference genome.
Extended Data Fig. 8
Extended Data Fig. 8. Overview of mtDNA variation across >250,000 individuals.
a. Box-and-whisker plots of homoplasmies per mtDNA haplogroup. Colors correspond to biobank. Outliers are suppressed to prevent visualizing AoU individual-level data. Total N = 95,343 (AoU) and 156,822 (UKB). b. Projection of UKB samples into mtDNA PC space computed using homoplasmies (MAF > 0.001). c. Mean heteroplasmic SNV count as a function of mtCN in UKB and AoU. Dotted lines correspond to mean number of heteroplasmic SNVs per person for individuals with mtCN > 50. Plot is truncated at mtCN < 200 for viewability. Error bars correspond to +/− 1 s.e.m. Total N = 79,873 (AoU) and 199,832 (UKB). d. Heteroplasmy distributions restricted to between 0.05 and 0.95 across UKB and AoU. e. Histogram of heteroplasmy counts per person for indels (top) and SNVs (bottom). f. Mean SNV count identified per-person in AoU as a function of variant type and age group. Error bars are +/− 1 s.e.m. g. Quantile-quantile plot of p-values from logistic regression tests predicting case/control status of 29 common diseases in UKB using each of 39 common case-only heteroplasmies (see panel h). Black line is null expectation, ribbon is 95% CI around null expectation. h. Case-only heteroplasmy distributions of 39 variants detected in >500 UKB samples.
Extended Data Fig. 9
Extended Data Fig. 9. Transmission patterns of mtDNA heteroplasmic variants used for nuclear genetic analysis.
a. Heteroplasmy correlations for 39 common heteroplasmies (see Extended Data Fig. 8h). Inset text corresponds to the number of familial pairs included in the analysis. b. Heteroplasmy correlations for all tested variants at position 567. c. Heteroplasmy correlations for all tested variants at position 955. d. Heteroplasmy correlations for all tested variants at positions 16179–16183. For panels a, b, and d, individual plots correspond to mother-offspring (left), father-offspring (middle), and sibling-sibling pairs (right). For panel c, the single plot corresponds to sibling-sibling pairs. For all panels, corresponding legend is on the right.
Extended Data Fig. 10
Extended Data Fig. 10. The full landscape of nuclear genetic associations to common mtDNA heteroplasmies.
a. Lead SNP p-values across all 39 tested case-only mtDNA heteroplasmies in the style of Fig. 4f. b. Lead SNP p-values across all 39 tested mtDNA heteroplasmies when coded as case-control phenotypes. c. Replication of lead SNP-variant pairs tested in both the UKB meta-analysis and AoU meta-analysis for case-only heteroplasmy. d. Replication of lead SNP-variant pairs tested in the UKB meta-analysis with each AoU continental ancestry group. For c-d, error bars correspond to effect size +/− 1 s.e.; colors correspond to nuclear chromosome; overall GWAS sample sizes can be found in Supplementary Table 1. e. The distribution of 95% credible set sizes from all heteroplasmy GWAS. Numbers atop shaded region correspond to size of CS; numbers within shaded region corresponds to the count of credible sets of that size. f. chrM:955:A,AC heteroplasmy as a function of lead SNP genotype near C7orf73. g. chrM:567:A,ACCCCCCC heteroplasmy as a function of highest PIP SNP genotype in PNP. h. Whole blood PNP expression as a function of the same highest PIP SNP genotype in GTEx. i. Colocalization between chrM:16183:AC,A at the PNP locus and PNP eQTL in whole blood, shown in GRCh38. j. Multiple sequence alignment across vertebrates of best bidirectional hits for POLG2 (BLASTP E<1e-3) displayed with ClustalW colors with effect of putative causal variant labeled. k. GWAS results in AoU for AFR and EUR in the vicinity of SSBP1 for chrM:302:A,AC, shown in GRCh38. Large points correspond to 95% CS from UKB meta-analysis, blue ribbon is region with LD R2 > 0.8 to lead SNP, dark red ribbon is a reference NUMT, light red ribbon is a 20kb window around the reference NUMT.
Extended Data Fig. 11
Extended Data Fig. 11. mtDNA heteroplasmy estimates and genetic associations are robust to potential confounders.
a. R2 and adjusted R2 for technical covariate model and R2 for blood trait model for common mtDNA heteroplasmies and log mtCNraw. Color corresponds to model F-test p-value < 0.05 (df = N-14 for blood, N-67 for technical; N in Supplementary Table 1) after Bonferroni correction. Sensitivity analyses for the GWASs of b. chrM:567:A,ACCCCCCC before and after technical covariate correction, c. chrM:16093:T,C before and after blood trait correction d. chrM:16182:A,ACC before and after blood trait correction e. chrM:16183:A,AC before and after blood trait correction. Mean case-only heteroplasmy as a function of top-level haplogroup for f. chrM:302:A,AC and g. chrM:16179:CA,C. Bar color corresponds to two-sided coefficient p-value for the regression of heteroplasmy onto top-level haplogroup, Bonferroni corrected for 39 tested heteroplasmies. h. McFadden’s pseudo-R2 for a multinomial model of top-level haplogroup versus mtDNA PCs (left) and ”level 2” haplogroup versus mtDNA PCs within each top-level haplogroup. i. GWAS lead SNP effect size estimate correlation when correcting for 30 mtDNA PCs vs correcting for only top-level haplogroup for selected variants showing high haplogroup heterogeneity (302:A,AC; 302:A,ACC; 302:A,ACCCC; 567:A,ACCCCCC; 955:A,ACC; 16179:CA,C; 16183:A,C). GWAS lead SNP effect size estimate correlation between case-only GWASs at baseline and j. GWASs after removing heteroplasmy calls supported by allele depth < median nuclear coverage, k. GWASs after correcting for variant coverage depth, l. GWASs after correcting for mtCN, m. length heteroplasmy GWASs after correcting for CSBII median coverage. For panels i-m, colors correspond to nuclear chromosome, points correspond to GWAS effect sizes for lead SNPs from baseline case-only GWASs with top-level haplogroup covariates, error bars represent effect sizes +/− 1 s.e., main GWAS sample sizes (x-axis) are found in Supplementary Table 1 (EUR), and sensitivity analysis GWAS sample sizes (y-axis) can be found in Supplementary Table 9.

Update of

Comment in

References

    1. Anderson S, et al. Sequence and organization of the human mitochondrial genome. Nature. 1981;290:338–346. doi: 10.1038/290457a0. - DOI - PubMed
    1. Wanrooij PH, Uhler JP, Simonsson T, Falkenberg M, Gustafsson CM. G-quadruplex structures in RNA stimulate mitochondrial transcription termination and primer formation. Proc. Natl Acad. Sci. USA. 2010;107:16072–16077. doi: 10.1073/pnas.1006026107. - DOI - PMC - PubMed
    1. Agaronyan K, Morozov YI, Anikin M, Temiakov D. Replication-transcription switch in human mitochondria. Science. 2015;347:548–551. doi: 10.1126/science.aaa0986. - DOI - PMC - PubMed
    1. Rath, S. et al. MitoCarta3.0: an updated mitochondrial proteome now with sub-organelle localization and pathway annotations. Nucleic Acids Res.10.1093/nar/gkaa1011 (2020). - PMC - PubMed
    1. Holt IJ, Harding AE, Morgan-Hughes JA. Deletions of muscle mitochondrial DNA in patients with mitochondrial myopathies. Nature. 1988;331:717–719. doi: 10.1038/331717a0. - DOI - PubMed

Substances