. 2023 Sep;621(7980):813-820.
doi: 10.1038/s41586-023-06287-y. Epub 2023 Aug 16.

Endothelial AHR activity prevents lung barrier disruption in viral infection

Affiliations

Endothelial AHR activity prevents lung barrier disruption in viral infection

Jack Major et al. Nature. 2023 Sep.

Abstract

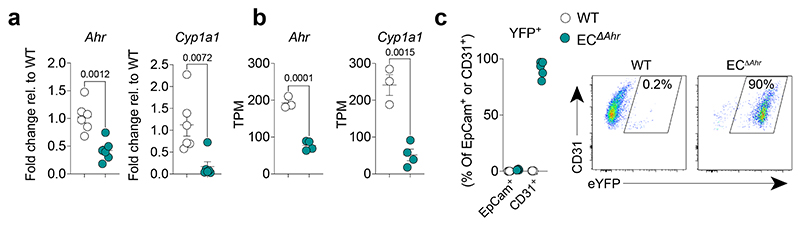
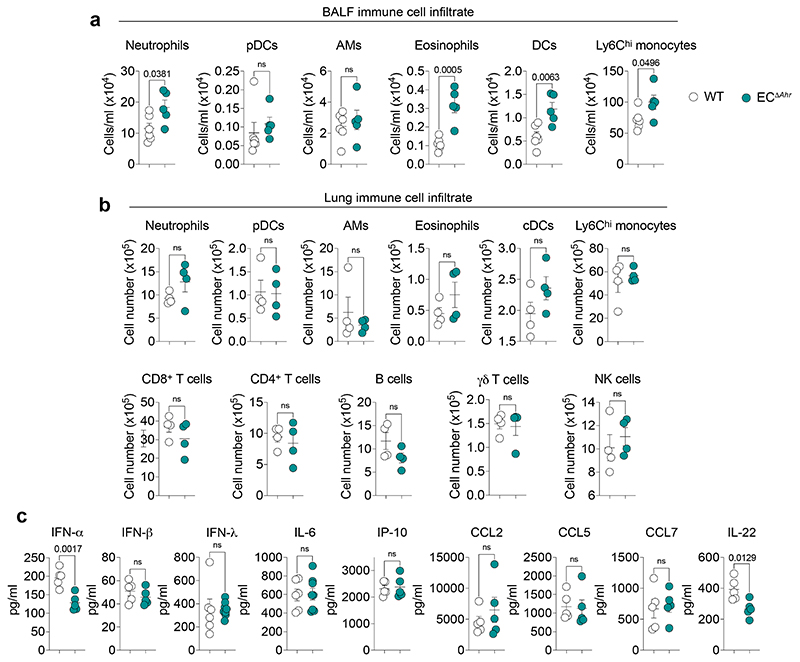
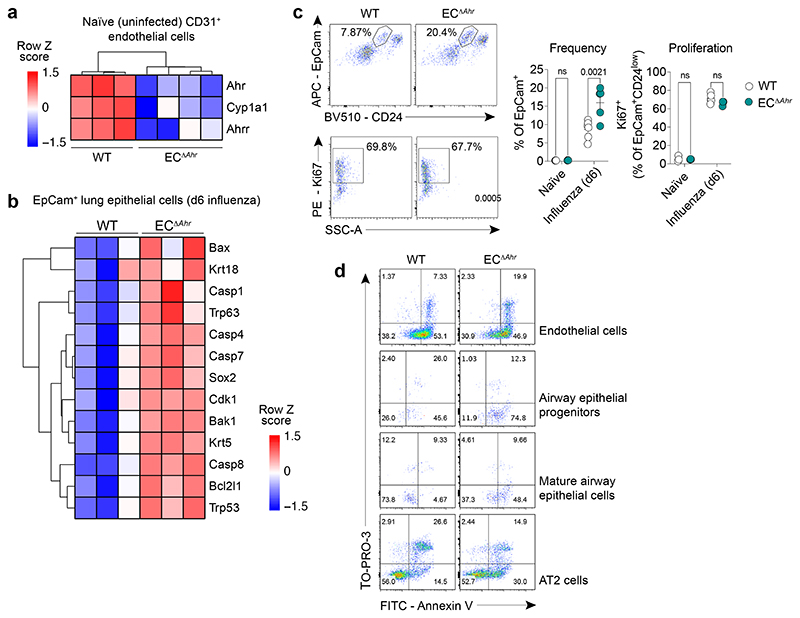
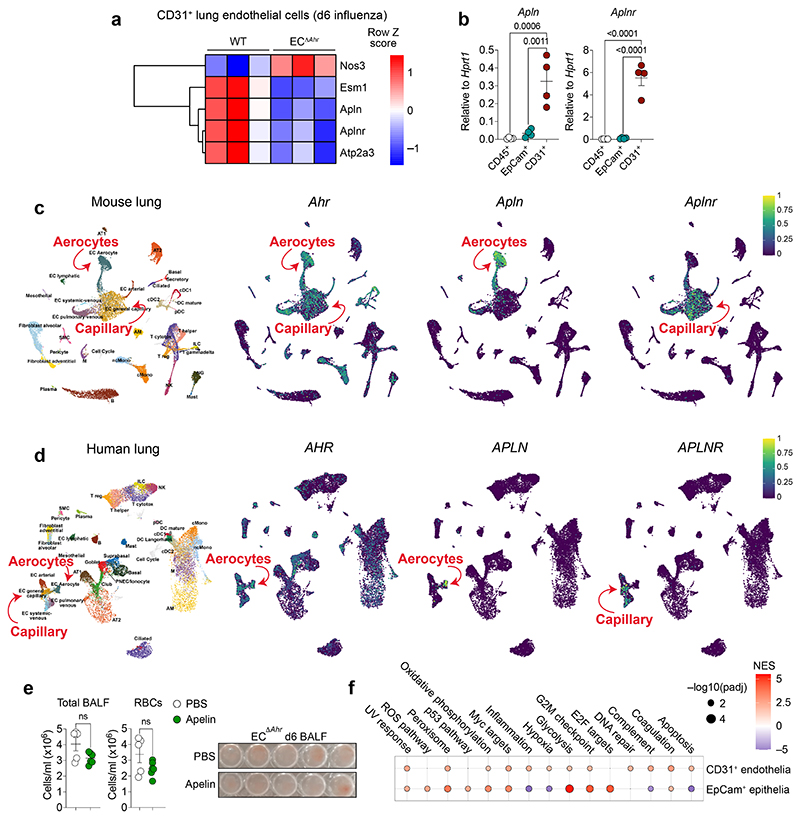
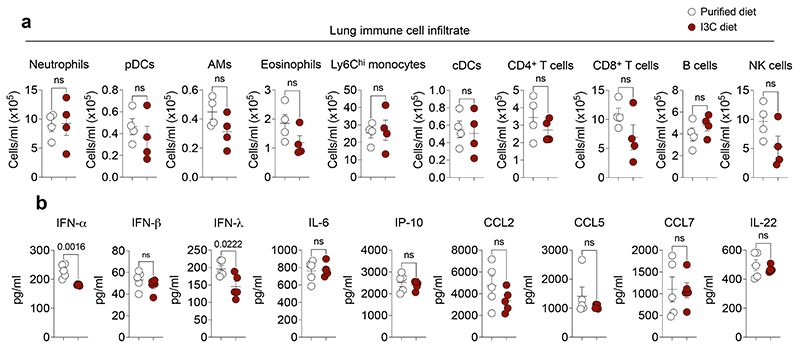
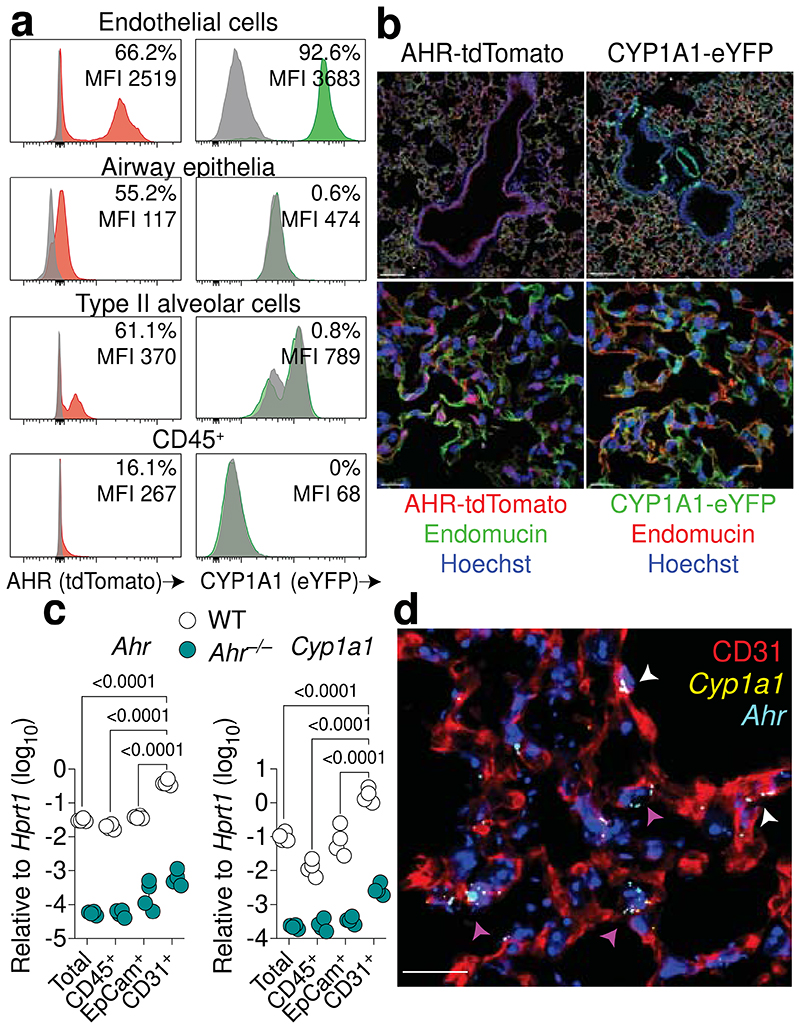
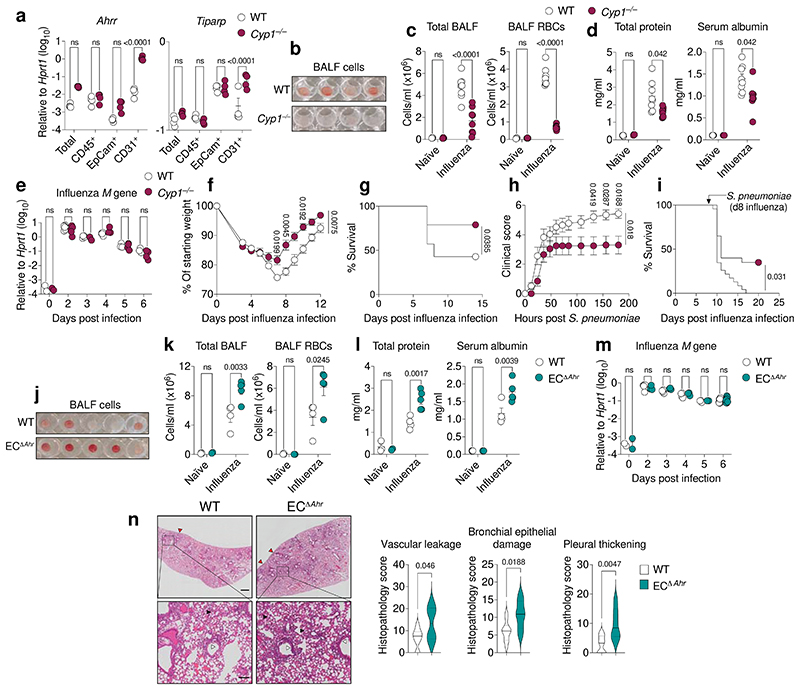
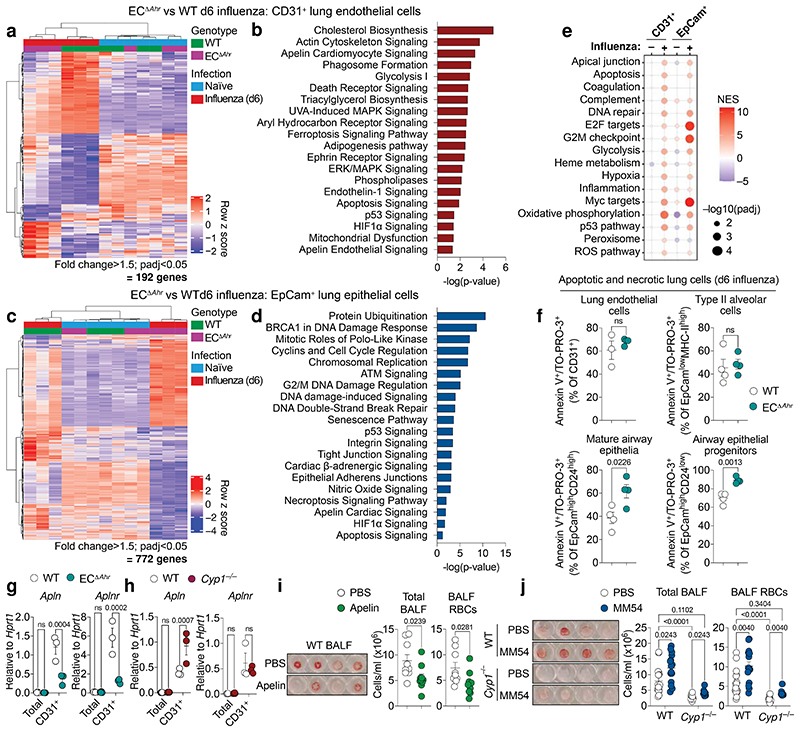
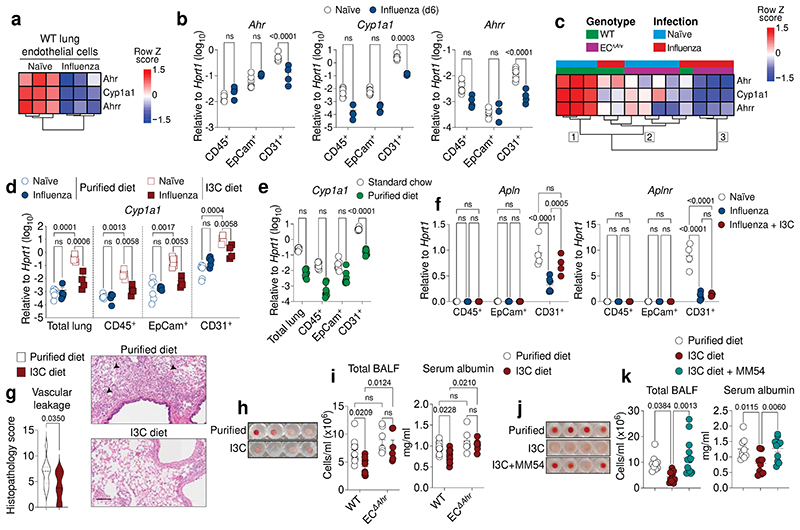
Disruption of the lung endothelial-epithelial cell barrier following respiratory virus infection causes cell and fluid accumulation in the air spaces and compromises vital gas exchange function1. Endothelial dysfunction can exacerbate tissue damage2,3, yet it is unclear whether the lung endothelium promotes host resistance against viral pathogens. Here we show that the environmental sensor aryl hydrocarbon receptor (AHR) is highly active in lung endothelial cells and protects against influenza-induced lung vascular leakage. Loss of AHR in endothelia exacerbates lung damage and promotes the infiltration of red blood cells and leukocytes into alveolar air spaces. Moreover, barrier protection is compromised and host susceptibility to secondary bacterial infections is increased when endothelial AHR is missing. AHR engages tissue-protective transcriptional networks in endothelia, including the vasoactive apelin-APJ peptide system4, to prevent a dysplastic and apoptotic response in airway epithelial cells. Finally, we show that protective AHR signalling in lung endothelial cells is dampened by the infection itself. Maintenance of protective AHR function requires a diet enriched in naturally occurring AHR ligands, which activate disease tolerance pathways in lung endothelia to prevent tissue damage. Our findings demonstrate the importance of endothelial function in lung barrier immunity. We identify a gut-lung axis that affects lung damage following encounters with viral pathogens, linking dietary composition and intake to host fitness and inter-individual variations in disease outcome.


Figures

Extended Data Fig. 1
Extended Data Fig. 1. Gating strategies for lung cell populations.
a-c, Gating strategy for lung endothelial cell and epithelial cell populations (a), RBCs and immune cells in the BALF day 6 post influenza virus infection (b), and lung lymphoid immune cell populations (c) analysed by flow cytometry.
Extended Data Fig. 2
Extended Data Fig. 2. The AHR landscape in mouse and human lung endothelia.
a, Immunofluorescence staining of steady-state AHR-tdTomato and Cyp1a1-eYFP lung sections stained with the vascular endothelial marker endomucin or lymphatic marker LYVE-1, and Hoechst (blue). Scale bars, 100 μm (left panels), 20 μm (middle panels), 5 μm (right panels). Data are representative of three independent experiments with similar results. b, Representative histogram plots of AHR-tdTomato and Cyp1a1-eYFP expression in steady-state lung endothelial cells (CD31+PDPN) and lymphatic endothelia (CD31+PDPN+) relative to B6 WT controls (grey). Mean fluorescence intensity (MFI). c Frequency of lymphatic and vascular endothelial cells measured by flow cytometry. d, RNA-FISH analysis of WT steady-state lung. RNA probes for Ahr (cyan) and Cyp1a1 (yellow) and stained with E-Cadherin for epithelia. White arrowheads indicate Ahr expression in airway epithelial cells. Scale bar, 20 μm. Data are representative of four independent experiments with similar results. e, f, Expression of indicated genes in uniform manifold approximation and projection (UMAP) plots of mouse (e) and human (f) lung scRNA-seq datasets obtained from lungendothelialcellatlas.com. g, Primary human lung microvasculature endothelial cell (HMVEC-L) cultures were treated with AHR agonist FICZ or antagonist CH-223191 for 24 hours and indicated gene expression was determined by qPCR (n = 6 biological replicates). Statistical analysis was performed using one-way ANOVA with Tukey’s post-test. Data are shown as mean±SEM. Data are shown as mean±SEM. ns, not significant.
Extended Data Fig. 3
Extended Data Fig. 3. Dampened pulmonary inflammation in CYP1-deficient mice.
a, b, Lung immune cell numbers were determined in the BALF on day 6 post infection (a) or in whole lung on indicated days post infection (b) in WT (n = 4) and Cyp1–/– (n = 5) mice by flow cytometry. c, d, BALF cytokine concentration in influenza virus infected WT and Cyp1–/– mice was determined on indicated days for IFN (n = 3) (c) or day 6 for remaining cytokines (d) post infection (n = 5). e, Histopathological analysis of WT (n = 4) and Cyp1–/– (n = 3) H&E lung sections on day 6 post infection. Black arrowheads indicate areas of perivascular, peribronchiolar, and intra-alveolar inflammatory cell infiltration. Scale bars, 500 μm (upper panels) and 100 μm (lower panels). All Data are representative of three to four independent experiments. Statistical analysis was performed using unpaired two-tailed Student’s t test (a, d), two-way ANOVA with Sidak’s post-test (b, c), or two-tailed Mann–Whitney U test (e) and significant P values are indicated on the graphs. Data are shown as mean±SEM. ns, not significant.
Extended Data Fig. 4
Extended Data Fig. 4. CYP1 deficiency confers protection against respiratory pathogens.
a, b, Lung damage was assessed in the BALF of X31 influenza virus infected WT (n = 8) and Cyp1a1/Cyp1b1 double-knockouts (Cyp1a2+/-) (n = 9) (a) or Cal09 H1N1 influenza virus infected WT (n = 6) and Cyp1–/– (n = 5) mice (b) by measurement of total cells, Ter119+ RBCs, total protein, and serum albumin concentrations on day 6 post infection. (c) Weight loss of influenza (X31) and Streptococcus pneumoniae coinfected WT (n = 23) and Cyp1–/– (n = 23) mice. All Data are representative of two independent experiments or pooled from three experiments (c). Statistical analysis was performed using unpaired two-tailed Student’s t test (a, b) or two-way ANOVA with Sidak’s post-test (c) and significant P values are indicated on the graphs. Data are shown as mean±SEM.
Extended Data Fig. 5
Extended Data Fig. 5. Endothelial-specific AHR deletion.
a, Endothelial-specific AHR deletion was determined by measuring expression of Ahr and AHR-target gene Cyp1a1 in isolated lung CD31+ endothelial cells in Cdh5Cre-ERT2Rosa26-LSL-YFP; Ahrflox/flox mice (ECΔAhr) and WT control (Cdh5Cre-Rosa26-LSL-YFP; Ahrflox/flox) mice by qPCR (n = 8) (a) or transcripts per million (TPM) from bulk RNA-seq analysis (n = 3) (b). c, YFP-expressing lung endothelial cells as a measurement of Cre induction was determined in CD31+ lung endothelial cells by flow cytometry in ECΔAhr mice (n = 5). All Data are representative of two independent experiments. Statistical analysis was performed using unpaired two-tailed Student’s t test and significant P values are indicated on the graphs. Data are shown as mean±SEM.
Extended Data Fig. 6
Extended Data Fig. 6. AHR deletion in endothelial cells does not drastically alter influenza-induced pulmonary inflammation.
a, b Immune cell numbers were determined in the BALF of WT (n = 6) and ECΔAhr (n = 5) mice (a) and whole lung (n = 4) (b) of on day 6 post infection by flow cytometry. c, BALF cytokine concentration in WT and ECΔAhr mice was determined on day 2 (IFN) or day 6 (remaining cytokines) post infection (IL-6 and IFN-λ: WT n = 6, ECΔAhr n = 8; remaining cytokines n = 4). All Data are representative of two to three independent experiments. Statistical analysis was performed using unpaired two-tailed Student’s t test and significant P values are indicated on the graphs. Data are shown as mean±SEM. ns, not significant.
Extended Data Fig. 7
Extended Data Fig. 7. AHR signalling in endothelia prevents airway epithelial apoptosis and dysplastic repair.
a, b, Heatmaps of indicated genes from bulk RNA sequencing data comparing naïve WT and ECΔAhr CD31+ lung endothelial cells (a) and EpCam+ lung epithelial cells on day 6 post infection (b) (fold change > 1.5, padj < 0.05). c, Frequency (% of total EpCam+) and proliferation (Ki67+) of distal airway stem cells (EpCamhighCD24lowMHC-II) in the lungs of WT and ECΔAhr mice was measured by flow cytometry in naïve (n = 3) mice and on day 6 post influenza infection (WT n = 6; ECΔAhr n = 5). d, Frequency of apoptotic (Annexin-V+) and necrotic (TO-PRO-3+) lung endothelial cells (CD31+), progenitor airway epithelial cells (EpCamhighCD24lowMHC-II), mature airway epithelial cells (EpCamhighCD24highMHC-II), and type II alveolar epithelial cells (EpCamlowMHC-II+) was assessed by flow cytometry in WT and ECΔAhr mice on day 6 post influenza infection (n = 4). All Data are representative of two independent experiments. Statistical analysis was performed using one-sided Wald test with Benjamini–Hochberg correction (a, b) or two-way ANOVA with Sidak’s post-test (c) and significant P values are indicated on the graphs. Data are shown as mean±SEM. ns, not significant.
Extended Data Fig. 8
Extended Data Fig. 8. AHR-dependent regulation of the apelin signalling pathway in lung endothelia.
a, Heatmap of indicated genes from RNA sequencing data comparing CD31+ lung endothelial cells on day 6 post infection (fold change > 1.5, padj < 0.05). b, Expression of indicated genes in isolated CD45+ immune cell, EpCam+ epithelial cell, and CD31+ endothelial cell was determined by qPCR in naïve WT mice (n = 4). c, d, Expression of indicated genes in UMAP plots of mouse (c) and human (d) lung scRNA-seq datasets obtained from lungendothelialcellatlas.com. e, Lung vascular leakage was assessed in PBS (n = 5) and apelin (n = 6) treated ECΔAhr mice by quantification of total cells Ter119+ RBCs in the BALF on day 6 post infection. f, Dot plot of hallmark pathways enriched or downregulated in MM54-treated WT mice (relative to PBS-treated controls) by GSEA. Comparisons are between MM54-treated and untreated from influenza infected mice, for endothelia and epithelia (two pairwise comparisons total). Dot size relates to statistical significance. All Data are representative of at least two independent experiments. Statistical analysis was performed using one-sided Wald test with Benjamini–Hochberg correction (a) or followed by Tukey’s post-test (b), or unpaired two-tailed Student’s t test (e). NES were generated with GSEA using a two-sided Kolmogorov Smirnov statistic with Hallmark genesets on genelists ranked by the Wald t statistic from DESeq2 (f) and significant P values are indicated on the graphs. Data are shown as mean±SEM. ns, not significant.
Extended Data Fig. 9
Extended Data Fig. 9. Dietary AHR ligands do not disrupt pulmonary inflammation.
a, Immune cell numbers were determined in the whole lung of WT mice fed purified or I3C-enriched diet on day 6 post infection by flow cytometry (n = 4). b, BALF IFN (day 2) and cytokine (day 6) concentrations in WT mice fed purified or I3C-enriched diet (n = 5). Statistical analysis was performed using unpaired two-tailed Student’s t test and significant P values are indicated on the graphs. Data are shown as mean±SEM. ns, not significant.
Fig. 1
Fig. 1. The endothelium is a site of heightened AHR activity in the lung.
a, Representative histogram plots of AHR-tdTomato and Cyp1a1-eYFP expression in steady-state lung endothelial cells (CD31+), airway epithelial cells (EpCamhighCD24+MHC-II), type II alveolar epithelial cells (EpCamlowMHC-II+) and immune cells (CD45+) relative to B6 WT controls (grey). Mean fluorescence intensity (MFI). b, Overview (upper panels) and maximum intensity projections (lower panels) of Cyp1a1-eYFP and AHR-tdTomato expression in lung sections stained with the endothelial marker endomucin (in green on left panels, red on right panels) and Hoechst (blue). Scale bars, 100 μm (upper panels) and 15 μm (lower panels). c, Expression of Ahr and target gene Cyp1a1 in total lung cells, isolated CD31+ endothelial cells, EpCam+ epithelial cells, and CD45+ immune cell populations from WT and Ahr–/– mice was determined by qPCR. n = 4. d, RNA-FISH analysis of WT steady-state lung. RNA probes for Ahr (cyan) and Cyp1a1 (yellow) and stained with CD31 for endothelia. Arrowheads indicate Ahr/Cyp1a1 expression in alveolar capillary endothelia (purple) or large blood vessels (white). Scale bar, 20 μm. For c, data are shown as mean±SEM. Each dot represents an individual mouse. Data are representative of at least two independent experiments with similar results (a-c) or four times with similar results (d). Statistical analysis was performed using two-way ANOVA followed by Sidak’s post-test (c) and significant P values are indicated on the graphs.
Fig. 2
Fig. 2. AHR signalling in endothelia prevents lung vascular leakage upon viral infection.
a, Expression of indicated AHR target genes in FACS-isolated lung cell populations was determined by qPCR (n = 4). b-d, j-l, Lung damage was assessed in the bronchoalveolar lavage fluid (BALF) of naïve (n = 3) and influenza virus infected WT and Cyp1–/– mice (n = 8 for each genotype) (b-d), or WT (n = 4) and ECΔAhr (n = 5) mice (j-l) by photograph of centrifuged BALF (b, j), quantification of total cells and Ter119+ RBC counts (c, k), and total protein and serum albumin concentrations (d, l). (e, m) Influenza virus Matrix gene mRNA expression in total lung RNA from naïve and infected WT, Cyp1–/– mice (e) and ECΔAhr mice (m) was measured by qPCR at indicated days post infection (n = 3–9 for each day). f, g, Weight loss (f) and survival (g) of influenza virus infected WT (n = 14) and Cyp1–/– mice (n = 19). h, i, Clinical scores (h) and survival (i) of influenza and Streptococcus pneumoniae coinfected WT (n = 23) and Cyp1–/– (n = 20) mice. n, Histopathological analysis of hematoxylin and eosin (H&E) lung sections on day 6 after infection (WT n = 10, ECΔAhr n = 6). Black arrowheads indicate signs of lung vascular leakage, red arrowheads indicate areas of pleural thickening, and white arrowheads indicate areas of bronchial epithelial damage. Scale bars, 500 μm (upper panels) and 100 μm (lower panels). All Data are representative of two to four independent experiments with similar results or pooled from three experiments (f-i). Statistical analysis was performed using two-way ANOVA with Sidak’s post-test (a, c-f, h, k-m), log-rank (Mantel-Cox) test (g, i), or two-tailed Mann–Whitney U test (n) and significant P values are indicated on the graphs. Data are shown as mean±SEM. ns, not significant.
Fig. 3
Fig. 3. Endothelial-AHR mediates lung protection via apelin signalling and prevents a dysplastic apoptotic response in airway epithelia.
a, c, Heatmaps showing differentially expressed genes in lung endothelia (a) or epithelia (c) comparing influenza infected WT and ECΔAhr mice. b, d, Selected canonical pathways differentially regulated between infected WT and ECΔAhr lung endothelial cells (b) and epithelial cells (d) using ingenuity pathway analysis (IPA) (padj < 0.05, fold change > 1.5). (e) Dot plot of hallmark pathways in ECΔAhr mice (relative to WT) using GSEA (four pairwise comparisons total). Dot size relates to statistical significance. (f) Frequency of apoptotic (Annexin-V+) and necrotic (TO-PRO-3+) lung endothelia (CD31+), progenitor airway epithelial cells (EpCamhighCD24lowMHC-II), mature airway epithelia (EpCamhighCD24highMHC-II), and type II alveolar epithelial cells (EpCamlowMHC-II+) was assessed by flow cytometry in influenza infected WT and ECΔAhr mice (n = 4). g, h, Apln and Aplnr expression was determined in total lung and lung endothelial cells isolated from influenza infected WT, ECΔAhr (g) and Cyp1–/– (h) (n = 3). i, j, Lung vascular leakage was determined in PBS (n = 9) or apelin (n = 10) treated WT mice (i) and PBS or MM54-treated WT (PBS n = 16; MM54 n = 15) and Cyp1–/– (PBS n = 11; MM54 n = 10) mice (j) by quantification of total cell and RBCs. All Data are representative of two to three independent experiments with similar results or pooled from three experiments (j). Statistical analysis was performed using a one-sided Wald test with Benjamini–Hochberg correction (a-d), normalised enrichment scores (NES) were generated with GSEA using a two-sided Kolmogorov Smirnov statistic with Hallmark genesets on genelists ranked by the Wald t statistic from DESeq2 (e) unpaired two-tailed Student’s t test (f, i), or two-way ANOVA with Sidak’s post-test (g, h, j) and significant P values are indicated on the graphs. Data are shown as mean±SEM. ns, not significant.
Fig. 4
Fig. 4. Loss of protective lung AHR signalling upon influenza virus infection is regulated by dietary intake.
a, c, Heatmap of indicated genes from bulk RNA-seq data comparing lung endothelial cells from naïve and influenza infected WT (a) or WT and ECΔAhr mice (c). Numbers indicate the three main dendogram clusters (c). b, d-f, Expression of indicated genes in total lung, CD31+ endothelial, EpCam+ epithelial, and CD45+ immune cell populations determined by qPCR in naïve (n = 7) and influenza infected (n = 4) WT mice (b), WT naïve (n = 7) and infected (n = 4–5) mice fed purified or I3C diet (d), WT naïve mice fed purified diet (n = 8) or standard chow (n = 7) (e), in naïve (n = 4) or infected (n = 6) mice fed purified diet or infected mice fed I3C diet (n = 4) (f). g, Histopathological analysis of H&E lung sections from influenza infected WT mice fed purified or I3C-enriched diet (n = 10). Black arrowheads indicate signs of vascular leakage. Scale bar, 100 μm. h-k, Lung damage assessed in the BALF of influenza infected WT (n = 10) and ECΔAhr (n = 6) mice fed purified or I3C diet (h, i) and WT mice fed purified diet (n = 9), I3C diet (n = 11) or I3C diet with MM54 treatment (n = 14) (j, k) by photograph of total BALF cells (h, j) and quantification of total cells and serum albumin concentrations in BALF (i, k). All Data are representative of at least two independent experiments with similar results or pooled from two experiments (i, k). Statistical analysis was performed using one-sided Wald test with Benjamini–Hochberg correction (a, c), one-way ANOVA with Dunnett’s post-test (k), two-way ANOVA with Sidak’s post-test (b, d-f, i), or two-tailed Mann–Whitney U test (g) and significant P values are indicated on the graphs. Data are shown as mean±SEM. ns, not significant.

References

    1. Matthay MA, et al. Acute respiratory distress syndrome. Nat Rev Dis Primer. 2018;5 - PMC - PubMed
    1. Bonaventura A, et al. Endothelial dysfunction and immunothrombosis as key pathogenic mechanisms in COVID-19. Nat Rev Immunol. 2021 doi: 10.1038/s41577-021-00536-9. - DOI - PMC - PubMed
    1. Teijaro JR, et al. Endothelial cells are central orchestrators of cytokine amplification during influenza virus infection. Cell. 2011;146:980–991. - PMC - PubMed
    1. Kleinz MJ, Skepper JN, Davenport AP. Immunocytochemical localisation of the apelin receptor, APJ, to human cardiomyocytes, vascular smooth muscle and endothelial cells. Regul Pept. 2005;126:233–240. - PubMed
    1. Krausgruber T, et al. Structural cells are key regulators of organ-specific immune responses. Nature. 2020;583:296–302. - PMC - PubMed

Publication types

MeSH terms

LinkOut - more resources