. 2023 Sep;621(7977):162-170.
doi: 10.1038/s41586-023-06431-8. Epub 2023 Aug 16.

Mapping the T cell repertoire to a complex gut bacterial community

Affiliations

Mapping the T cell repertoire to a complex gut bacterial community

Kazuki Nagashima et al. Nature. 2023 Sep.

Abstract

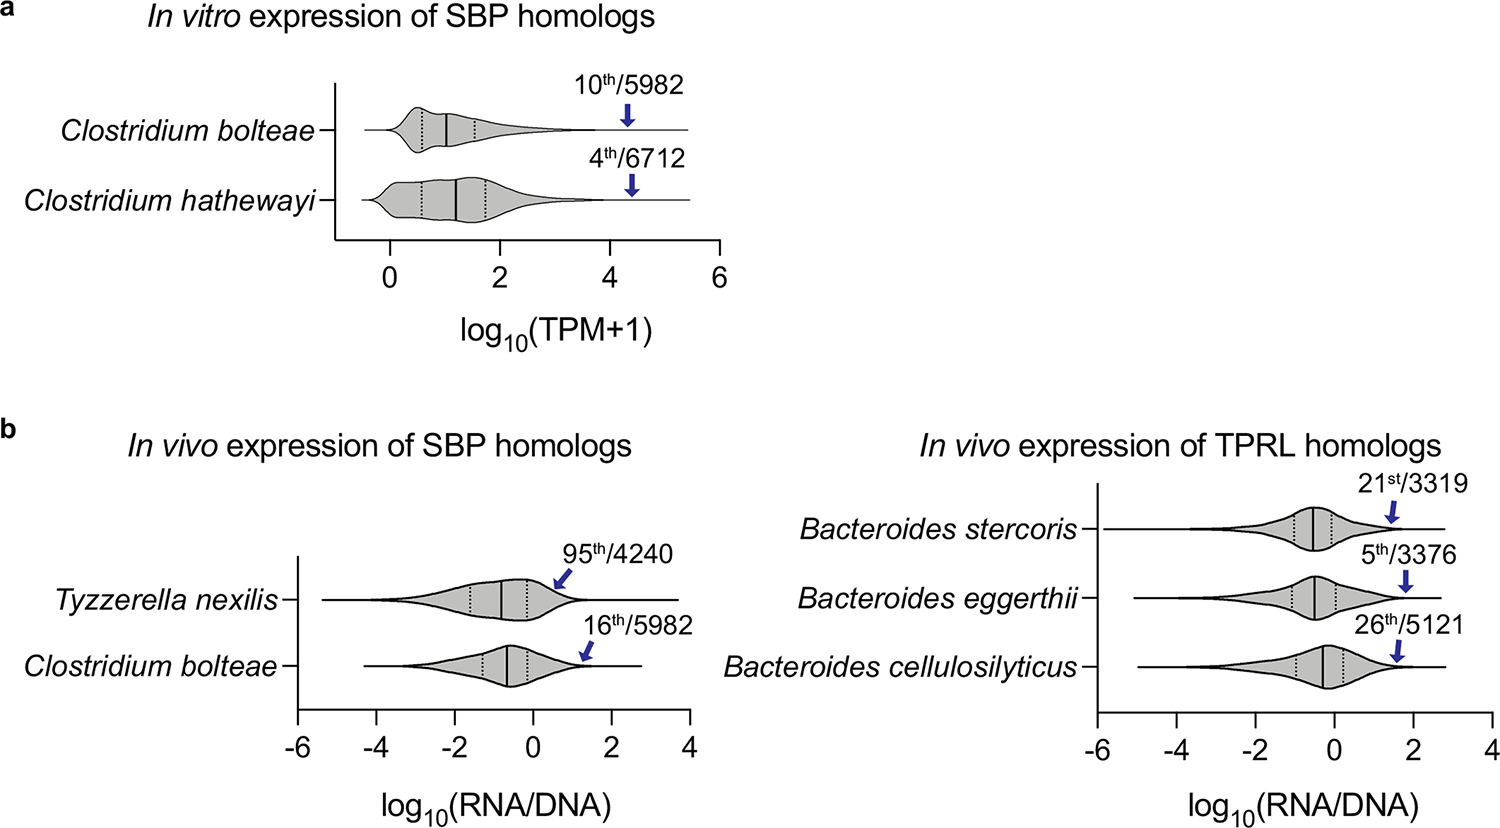
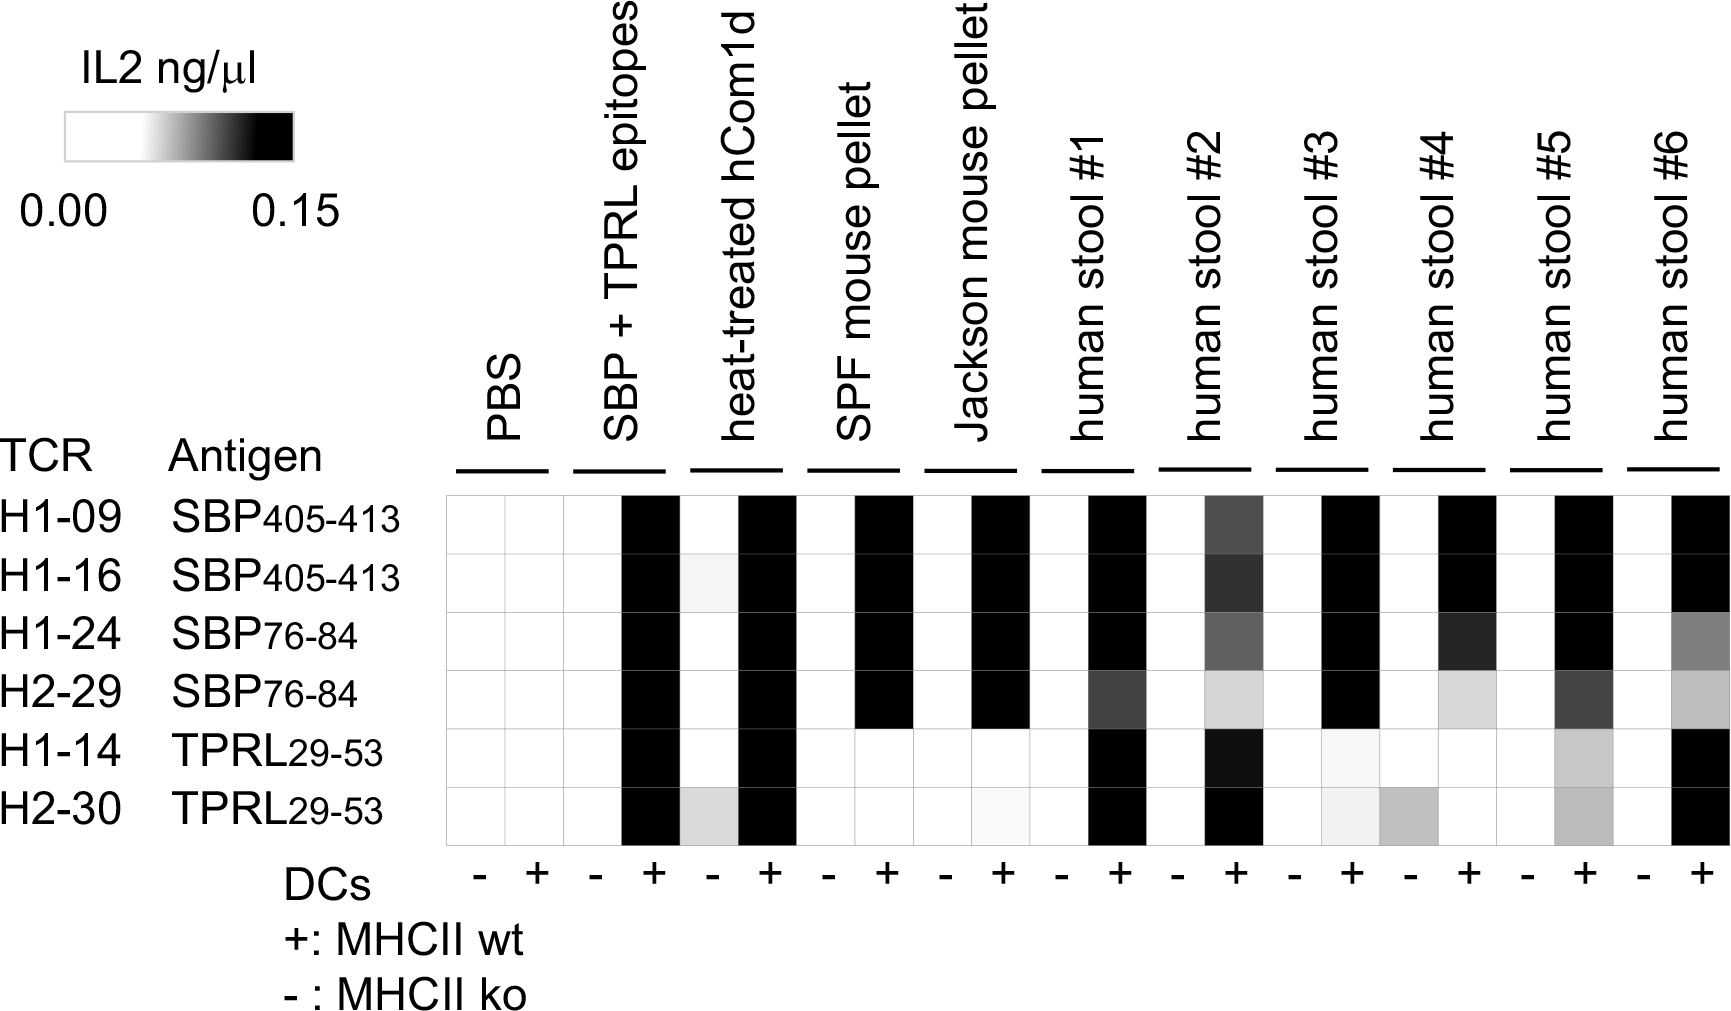
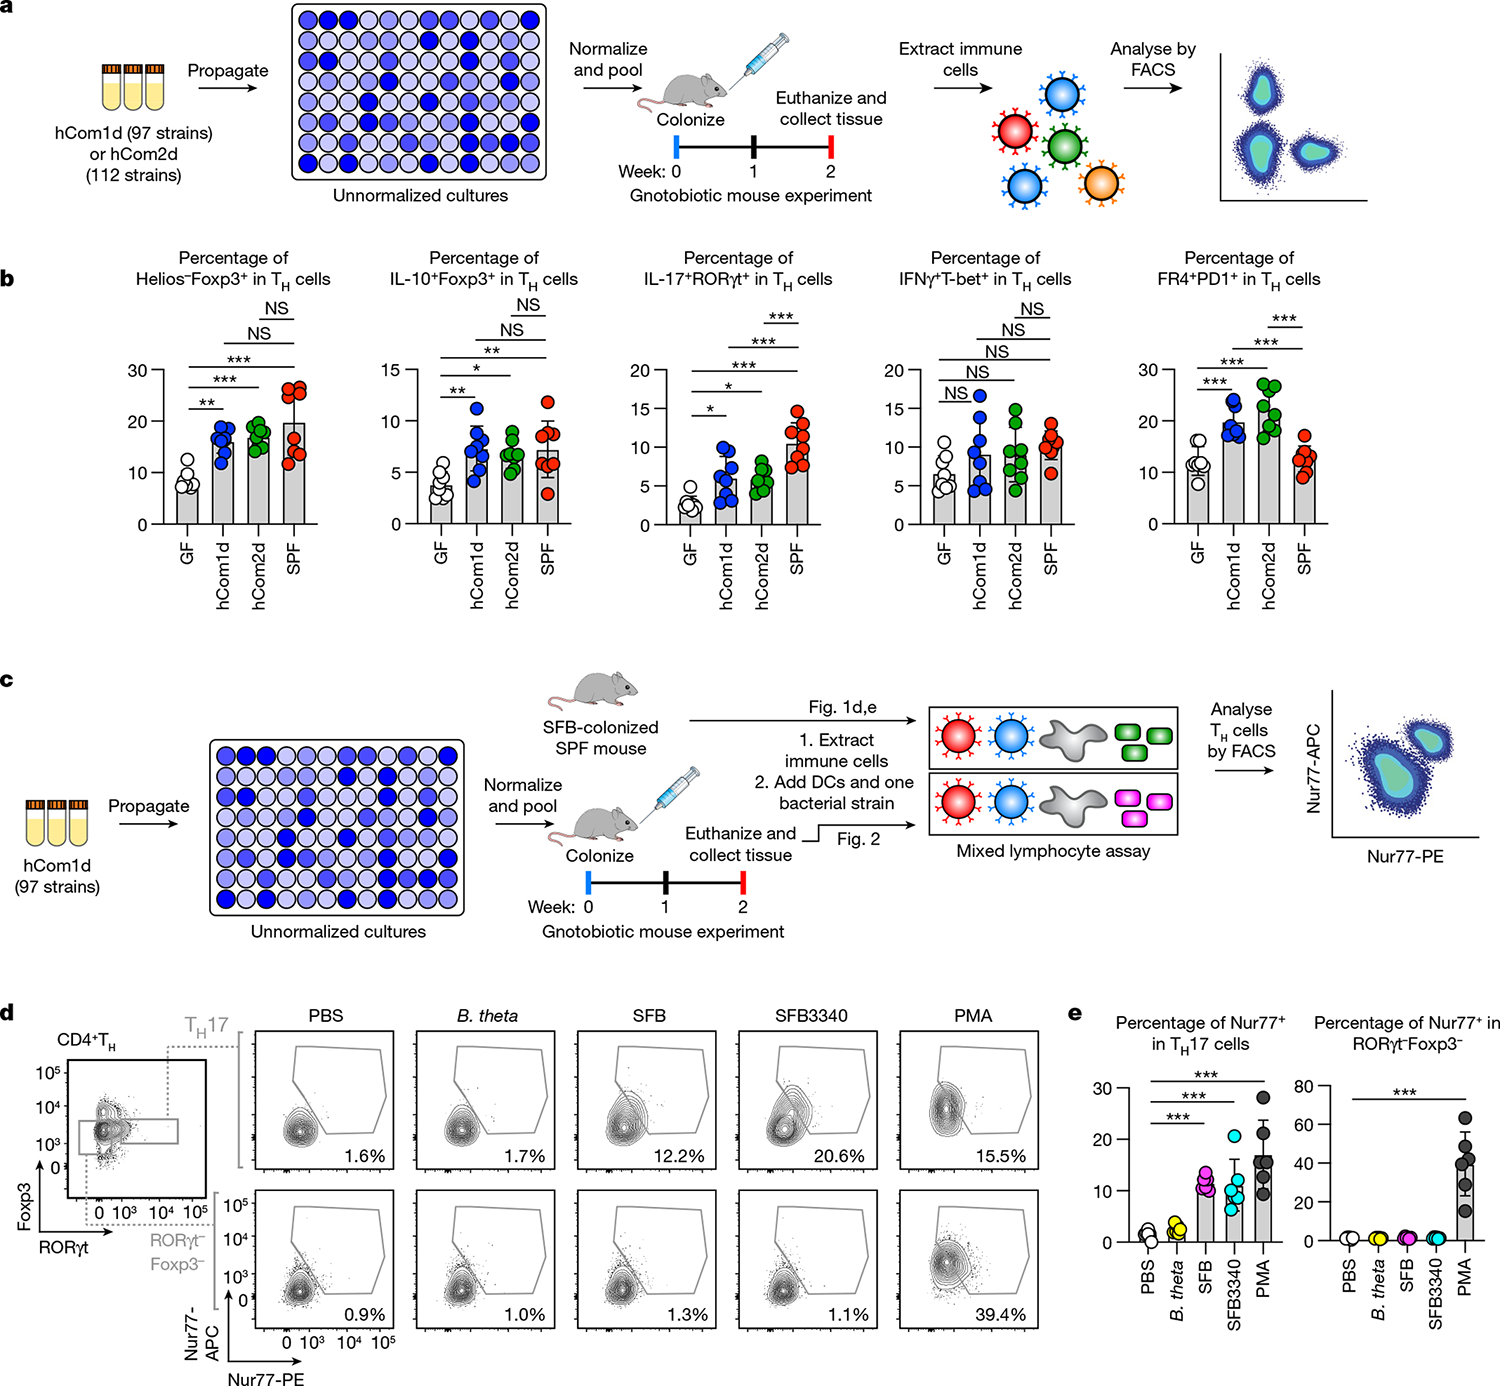
Certain bacterial strains from the microbiome induce a potent, antigen-specific T cell response1-5. However, the specificity of microbiome-induced T cells has not been explored at the strain level across the gut community. Here, we colonize germ-free mice with complex defined communities (roughly 100 bacterial strains) and profile T cell responses to each strain. The pattern of responses suggests that many T cells in the gut repertoire recognize several bacterial strains from the community. We constructed T cell hybridomas from 92 T cell receptor (TCR) clonotypes; by screening every strain in the community against each hybridoma, we find that nearly all the bacteria-specific TCRs show a one-to-many TCR-to-strain relationship, including 13 abundant TCR clonotypes that each recognize 18 Firmicutes. By screening three pooled bacterial genomic libraries, we discover that these 13 clonotypes share a single target: a conserved substrate-binding protein from an ATP-binding cassette transport system. Peripheral regulatory T cells and T helper 17 cells specific for an epitope from this protein are abundant in community-colonized and specific pathogen-free mice. Our work reveals that T cell recognition of commensals is focused on widely conserved, highly expressed cell-surface antigens, opening the door to new therapeutic strategies in which colonist-specific immune responses are rationally altered or redirected.


Figures

Extended Data Fig. 1 |
Extended Data Fig. 1 |. T cell profiling for hCom1d- and hCom2d-colonized mice.
a,b, hCom1d or hCom2d were used to colonize germ-free C57BL/6 mice by oral gavage. Mice were housed for two weeks before sacrifice. Intestinal immune cells were extracted, stimulated by PMA/ionomycin and analyzed by flow cytometry. Th cell subtypes, as a percentage of the total Th cell pool, were analyzed in the large intestine (a) or in the small intestine (b). See Supplementary Fig. 1b for the gating strategy. Statistical significance was assessed using a one-way ANOVA (NS > 0.05; **p < 0.01; ***p < 0.001). Data shown are mean ± standard deviations. n = 8, 8, 4 mice per group from 2 independent experiments (a). n = 4 mice per group from one experiment (b).
Extended Data Fig. 2 |
Extended Data Fig. 2 |. Introduction of a gut bacterial community to germ-free mice by horizontal transfer.
a, Metagenomic analysis of germ-free mice colonized with hCom2d by oral gavage or cohousing (horizontal transfer, HT). Faecal samples were collected 2 weeks after colonization and subjected to metagenomic sequencing; the resulting data were analyzed by NinjaMap to measure the composition of each community. The average of 4 mice per group is displayed above. Each dot is an individual strain; the collection of dots in a column represents the community at a single time point. Strains are coloured according to their rank-order abundance in the oral gavage sample. Relative abundances in the oral gavage and HT samples are highly correlated, indicating that coprophagy (horizontal transfer) results in a similar community architecture to that of oral gavage. b, Intestinal T cells from mice colonized with hCom2d by oral gavage and HT show similar phenotypes. Mice were sacrificed after two weeks of colonization. Immune cells were isolated from the large intestine, stimulated by PMA/ionomycin and analyzed by flow cytometry. See Supplementary Fig. 1b for the gating strategy. Statistical significance was assessed using a two-sided t-test (NS > 0.05). Data shown are mean ± standard deviations. n = 6 mice per group from one experiment.
Extended Data Fig. 3 |
Extended Data Fig. 3 |. The mixed lymphocyte assay detects TCR activation while preserving T cell phenotype.
a-c, We colonized germ-free mice with hCom1d, waited two weeks, and then sacrificed the mice. Immune cells from the colon were co-cultured for 4 h with three non-community bacterial strains (Bacillus cereus, Bacillus subtilis, or Staphylococcus epidermidis) or two strains from hCom1d (Tyzzerella nexilis and Clostridium bolteae). For antigen presentation, we used either MHCII+ wild-type DCs, MHCII-deficient DCs or a no DC control. pTreg (Helios− Foxp3+) cells and Th17 (RORgt+ Foxp3−) cells were analyzed by flow cytometry. a, Co-culture with strains and wild-type DCs doesn’t affect the number of pTreg cells and Th17 cells. b,c, Nur77 expression is upregulated when T cells were cocultured with strains in hCom1d and wild-type DCs in pTreg cells (b) and in Th17 cells (c). p-values were calculated by comparison to PBS treatment as a negative control using a one-way ANOVA (NS > 0.05; **p < 0.01; ***p < 0.001). Data shown are mean ± standard deviations. n = 4 mice per group from one experiment.
Extended Data Fig. 4 |
Extended Data Fig. 4 |. Analysis of scRNA-seq data by unbiased clustering.
a, Uniform manifold approximation and projection (UMAP) plot of all the cells. The data is generated by merging three groups: hCom1d-colonized, hCom2d-colonized, and germ-free mice. Cells were clustered into 25 groups using the FindClusters function of the Seurat R package. bd, Gene expression profiling a of cell clusters. To investigate the identity of each cell cluster, expression levels of cell subset markers were visualized by dot plots (b), feature plots (c) and violin plots (d) using Seurat.
Extended Data Fig. 5 |
Extended Data Fig. 5 |. scRNA-seq analysis of immune modulation by synthetic community colonization.
a, Left panel: Uniform manifold approximation and projection (UMAP) plot. These data represent three merged samples: hCom1d-colonized, hCom2d-colonized and germ-free mice. Right panel: Frequency of TCR clonotypes on the UMAP plot. Expanded TCRs (red) represent clonotypes observed in more than five cells, multiple (orange) are clonotypes found in 2–5 cells, and single (light blue) were seen in only one cell. Most of the expanded TCR clonotypes have an expression profile consistent with effector T cells, whereas naïve T cells are rich in unique (that is, non- expanded) TCR clonotypes. b, UMAP plot of intestinal immune cell clusters in each colonization condition. Immune cells were isolated from the large and small intestine from three groups of mice: hCom1d-colonized, hCom2d-colonized, and germ-free. c, Analysis of the frequency of T cell subsets in each group. The percentage of each T cell subset on the UMAP plot was calculated by the Seurat R package; fold changes compared to GF mice are shown. Colonization of germ-free mice with hCom1d and hCom2d increased pTreg, Th17, Fr4 Th and other effector T cells in the large intestine, and Th17 and other effector T cells in the small intestine. d, Analysis of expanded TCR clonotypes in each sample. Each dot represents one TCR clonotype found in multiple T cells (red, shared between effector T cells and pTreg cells; grey, effector T cell; black, pTreg). e, Differentially expressed genes in T cell subsets upon colonization with hCom1d and hCom2d. The FindMarkers function of Seurat was used to find differentially expressed genes. The two-sided non-parametric Wilcoxon rank sum test was used to calculate the adjusted p-value. White bars show mean values. Each dot represents one cell. ***p < 0.001. f, Criteria used to select TCR clonotypes for making hybridoma cells. Red genes: Upregulated by hCom1d and hCom2d colonization. Black genes: T cell subset markers.
Extended Data Fig. 6 |
Extended Data Fig. 6 |. Reactivity of TCR hybridomas against reported commensal epitopes.
a, The list of previously reported commensal epitopes tested in this experiment. Epitopes were pooled into sets of 6–7 for testing the ability to stimulate TCR hybridomas. b, Previously reported commensal epitopes were co-cultured with TCR hybridomas and dendritic cells. The SFB-specific 7B8 TCR transgenic T cells, a positive control, showed a response to Pool1, which includes the SFB antigen SFB3340. The 92 TCR hybridomas generated in this work were not responsive to any of the previously reported commensal epitopes.
Extended Data Fig. 7 |
Extended Data Fig. 7 |. Metagenomic analysis for hCom1d and hCom2d strains in the colonization of the mouse intestine.
a,b, Each dot is an individual strain; the collection of dots in a column represents the community at a single time point in mice colonized by hCom1d (a) or hCom2d (b). Strains are colored according to their rank-order relative abundance. Strain names colored red harbor the conserved substrate-binding protein (SBP). Germ-free mice were colonized with synthetic communities, and fecal pellets were collected two weeks after community colonization. The results are an average of 5 mice.
Extended Data Fig. 8 |
Extended Data Fig. 8 |. Identification of the minimal antigen epitopes of SBP using a truncated peptide library.
a,b, Prediction of signal sequences and subcellular localization of SBP. SignalP-5.0 (a) and PRED-LIPO (b) predict that the SBP has a lipoprotein signal peptide. c, BLAST search for the antigenic epitopes of SBP in strains from hCom1d and hCom2d. 19 strains were found to harbor homologs of the SBP. d, To search for the minimal antigenic epitope in SBP, a library of truncated peptides was synthesized. 13 Firmicutes-reactive TCR hybridomas were mixed and co-cultured with truncated peptides and dendritic cells. The degree of TCR stimulation was estimated by assaying the concentration of IL-2 in the culture supernatant by ELISA. Truncated peptides containing the 9-mer YDAFAINMV stimulated the mixed TCR hybridomas.
Extended Data Fig. 9 |
Extended Data Fig. 9 |. Discovery of an N-terminal epitope from SBP.
a, Identification of the N-terminal epitope SBP76–84. N-terminal SBP peptides from strains from hCom1d and hCom2d were synthesized and co-cultured with the T cell hybridomas. Truncated peptides were also tested to identify the minimal epitope. 7 of the 13 TCRs were responsive to the synthetic peptides. The remaining 6 were stimulated by C-terminal peptide SBP405–413 as shown in Fig. 4f. There is a strong correlation between the reactivity of TCRs and the sequences of TCR CD3 regions. b, The T cell response to SBP is conserved in different murine settings. We colonized: (1) germ-free C57BL/6 mice with hCom2d by co-housing (horizontal transfer recipient), (2) germ-free C57BL/6 mice with a human fecal community (humanized), (3) germ-free C57BL/6 mice with oral gavage of hCom2d under a condition of a high-fat diet (HFD), and (4) germ-free Swiss Webster mice (SW) with oral gavage of hCom2d. After two weeks, intestinal immune cells were isolated and cocultured with a mix of SBP76–84 and SBP405–413, or PBS as a negative control, using dendritic cells for antigen presentation. Nur77 expression in pTreg or Th17 cells was analyzed by FACS to monitor TCR stimulation (see Supplementary Fig. 1a, c for the gating strategy). SBP-specific T cells were detected in pTreg and Th17 from HT recipient, humanized, and HFD groups, while T cells from SW mice failed to respond to SBP76–84 and SBP405–413. c, We hypothesized that T cells from SW mice recognize a distinct epitope in SBP because of the difference in MHC haplotype between C57BL/6 and SW mice. To test this hypothesis, we co-cultured immune cells from hCom2d-colonized SW mice with a mixture of peptides that tile the whole SBP. We detected SBP-specific pTreg and Th17 cells in hCom2-colonized SW mice. This suggests that SBP-specific T cell induction is preserved across different genetic backgrounds of mice, but—as expected—the epitope recognized is distinct because of the difference in MHC haplotype. p-values were calculated using a two-sided t-test by comparison to PBS treatment as a negative control. *p = 0.05. **p = 0.01. ***p = 0.005. NS > 0.05. Data shown are mean ± standard deviations. n = 8, 8, 14, 8 mice per group from 2 independent experiments (b). n = 15 mice per group from one experiment (c).
Extended Data Fig. 10 |
Extended Data Fig. 10 |. Identification of TPRL as an antigen from Bacteroides species.
a, To search for the antigenic epitope in TPRL from Bacteroides eggerthii, a library of truncated peptides was synthesized. 4 Bacteroides-reactive TCR hybridomas were mixed and co-cultured with truncated peptides and dendritic cells. The degree of TCR stimulation was estimated by assaying the concentration of IL-2 in the culture supernatant by ELISA. TPRL29–53 (Peptide 3, SDYFTVTPQVLEAVGGKVPATINGK) stimulated the mixed TCR hybridomas. b, We found that TCR H2–11, H2–30, and H1–14 are reactive to Peptide 3 from TPRL by coculturing each Bacteroides-reactive TCR hybridoma with Peptides 2 and 3. c, Results of a BLAST search using the antigenic epitope TPRL29–53 as a query; the results shown are from strains in hCom1d and hCom2d. d, Predicted crystal structure of the TPRL from AlphaFold2. The TPRL29–53 epitope, shown in red, lies within a beta-sheet in the N-terminal domain. e, Induction of TPRL-specific T cells in vivo. Germ-free C57BL/6 mice were colonized with hCom2d. After two weeks, intestinal T cells were isolated and cocultured with TPRL29–53 and dendritic cells. Nur77 expression in T cell subsets was analyzed by FACS to monitor TCR stimulation (see Extended Data Fig. 1a, c for the gating strategy). In hCom1d and hCom2d-colonized mice, Th17 and pTreg cells showed an antigen-specific response to SBP. p-values were calculated using a two-sided t-test by comparison to PBS treatment as a negative control. *p < 0.05. Data shown are mean ± standard deviations. n = 5, 8 mice per group from one experiment.
Extended Data Fig. 11 |
Extended Data Fig. 11 |. T cell targets are highly expressed in vitro and in vivo.
a, The SBP is highly expressed in in vitro transcriptomic data from two species in our community: Clostridium bolteae and Clostridium hathewayi. In C. bolteae, it is the 10th most highly expressed gene out of 5,982, and in C. hathewayi, it is the 4th most highly expressed gene out of 6,712. The expression level was normalized to transcripts per million (TPM). b, The SBP and TPRL are highly expressed in vivo. Reads were recruited from 378 metatranscriptomic samples and mapped to the whole genomes of select SBP and TPRL-encoding strains in our community (Tyzzerella nexilis DSM 1787 and Clostridium bolteae DSM 15670 (SBP); Bacteroides stercoris ATCC 43183, Bacteroides eggerthii DSM 20697, and Bacteroides cellulosilyticus DSM 14838 (TPRL)). To account for gene copy number variation, we measured expression as the ratio between RNA and DNA level from paired metagenomic and metatranscriptomic samples. In all cases, we found that the protein is very highly expressed in vivo.
Extended Data Fig. 12 |
Extended Data Fig. 12 |. SBP and TPRL are present in human stool samples.
We tested whether SBP and TPRL exist at a detectable level in human stool samples. We cocultured SBP-or TPRL-reactive TCR hybridomas with: (1) PBS as a negative control, (2) a mix of SBP and TPRL epitopes as a positive control, (3) heat-treated hCom1d, (4) heat-treated SPF mouse fecal pellets, 5) heat-treated mouse fecal pellets from Jackson, (5) 6 human fecal communities. For antigen presentation, we used MHCII+ wild-type DCs, or MHCII-deficient DCs as a negative control. IL-2 concentration was measured as a readout for TCR stimulation. We found that 6/6 human fecal communities restimulate the SBP405–413 and SBP76–84-specific hybridomas and 5/6 restimulate the TPRL29–53-specific hybridomas. These data suggest that the SBP and TPRL are expressed by human gut isolates under native conditions.
Fig. 1 |
Fig. 1 |. A model system for studying immune modulation by the gut microbiome.
a, Schematic of the experiment. Frozen stocks of 97 strains (hCom1d) or 112 strains (hCom2d) were used to inoculate cultures that were grown for 48 h, diluted to similar optical densities and pooled. The mixed culture was used to colonize germ-free C57BL/6 mice by oral gavage. Mice were housed for 2 weeks before euthanasia. Immune cells from the large intestine were extracted, stimulated by PMA–ionomycin and analysed by flow cytometry. b, TH cell subtypes, as a percentage of the total TH cell pool, were broadly similar among hCom1d-colonized, hCom2d-colonized and SPF mice and distinct from germ-free mice. n = 8 mice per group (see Supplementary Fig. 1 for the gating strategy). GF, germ free; NS, not significant. c, Schematic of the mixed lymphocyte assay. SFB-colonized SPF mice (data in Fig. 1d,e) or hCom1d-colonized mice (data in Fig. 2) were euthanized; immune cells from the intestine were extracted and cocultured with a heat-treated bacterial strain and dendritic cells. After 4 h, cells were fixed, stained with two antibodies specific for Nur77 and analysed by flow cytometry. DCs, dendritic cells; PE, phycoerythrin. d, The gating strategy for the mixed lymphocyte assay. Expression of Nur77 by cells from the small intestine was analysed in TH17 cells and RORγtFoxp3 TH cells to evaluate TCR stimulation. TH17 cells were stimulated by SFB (faecal pellets from SFB-mono-colonized mice), purified SFB3340 peptide (an antigen from SFB) and PMA–ionomycin, a positive control. B. theta, Bacteroides thetaiotaomicron. e, Statistical analysis for the mixed lymphocyte assay. n = 6 mice per group. Statistical significance was assessed using a one-way analysis of variance in b and e (*P < 0.05; **P < 0.01; ***P < 0.001; NS > 0.05). Data shown are mean ± standard deviations from two independent experiments in b and e.
Fig. 2 |
Fig. 2 |. Strain-by-strain profiling of T cell responses to a complex defined community.
Profiling T cell reactivity against each strain in hCom1d (see Fig. 1c for schematic and Supplementary Fig. 3 for the gating strategy). Immune cells were isolated from the large intestine of 10–15 hCom1d-colonized mice, pooled and cocultured with each of the 97 heat-treated strains in hCom1d, along with dendritic cells for antigen presentation. After 4 h, immune cells were fixed, stained and analysed. As a negative control, immune cells from germ-free mice were cocultured and profiled in the same manner. Dot size shows the average percentage of Nur77+ cells after coculture. Dot colour represents P value in comparison with the negative control, treatment with PBS. Data showing the restimulation of pTreg cells by Intestinibacter bartlettii DSM 16795 are shown as an example (upper right). A phylogenetic tree of the strains in hCom1d was generated on the basis of a multiple sequence alignment generated from conserved single-copy genes. The coloured square to the left of each strain name indicates its phylum: Firmicutes, red; Actinobacteria, blue; Verrucomicrobia, orange; Bacteroidetes, green; and Proteobacteria, purple. n = 9 replicates were used for PBS and n = 3 replicates were used for the remaining samples. The data represent three independent experiments per colonization condition. For statistical analysis, multiple comparison testing was performed by GraphPad Prism using the two-stage linear step-up method (Benjamini, Krieger and Yekutieli) for controlling the false discovery rate. q value (adjusted P value, two-sided) <0.05: significant.
Fig. 3 |
Fig. 3 |. scRNA-seq and scTCR-seq to identify microbiome-responsive T cell clonotypes.
a, Schematic of the experiment. After 2 weeks of colonization, intestinal T cells were isolated, purified and analysed by scRNA-seq and scTCR-seq. For generating TCR hybridomas, 92 TCR clonotypes were selected on the basis of one of two criteria: (1) 55 were ‘expanded’ in that they occurred more than twice in our combined pool of 35,237 cells (range 2–84) and (2) 37 harboured an expression signature consistent with being microbiome specific. Synthetic expression constructs that consist of the TCR α and β chains separated by a self-cleaving P2A peptide were cloned into a retroviral vector and used to transfect Plat-E cells. Retrovirus was collected and used to transduce NFAT-GFP hybridoma cells, which were enriched for transductants using a selectable marker. Each T cell hybridoma was cocultured with every strain in hCom1d and hCom2d, one at a time. We measured IL-2 production by the T cell hybridomas to detect TCR stimulation. Data from this experiment were analysed to create a map of strain-TCR specificity. b, A map of TCR-strain specificity. Each T cell hybridoma was cocultured with every strain individually. Shown are the 35 TCRs reactive to at least one bacterial strain and the 55 antigens (53 strains, chow and a GF faecal pellet) that stimulated at least one TCR. Thirteen T cell hybridomas were reactive to a subset of 15–18 Firmicutes. GF, a T cell hybridoma derived from germ-free mice, is shown as a negative control. Coloured dots at left represent the primary T cells in which the corresponding TCR was expressed. H1-## indicates hybridomas expressing a TCR selected from hCom1d-colonized mice and H2-## are TCR hybridomas from hCom2d-colonized mice. The coloured square below each strain name indicates its phylum: Firmicutes, red; Bacteroidetes, green; and Proteobacteria, purple. SI, small intestine; LI, large intestine; tTreg, thymic Treg. The data are an average of two independent experiments.
Fig. 4 |
Fig. 4 |. Discovery of a conserved Firmicutes antigen.
a, Schematic of the antigen identification experiment. Genomic DNA from T. nexilis, C. bolteae and S. variabile was used to create libraries in E. coli. Each of three libraries was arrayed in plates as 480 pools of 30 clones. Each library was screened against a mixture of 13 Firmicutes-reactive hybridomas (Fig. 3b). TCR stimulation was monitored by measuring IL-2 production. b, One positive clone was identified from each of the genomic libraries. The genomic fragment in each clone overlaps around the C-terminal domain of a SBP, a component of a predicted ABC transport system for monosaccharide use. c, Schematic of the ABC transport system and SBP. The SBP is a predicted lipoprotein that is anchored in the the plasma membrane. d, BLAST-based genomic analysis of SBP distribution in hCom strains. The presence of an SBP homologue is almost perfectly correlated to the strain’s ability to stimulate the 13 hybridomas from Fig. 3b. e, A phylogenetic tree showing the distribution of the SBP gene cluster among host-associated Firmicutes. Red, species with the SBP cluster. f, Identification of the antigen epitope SBP405–413. C-terminal SBP peptides from 19 stimulatory strains from hCom1d and hCom2d were cocultured with the T cell hybridomas. The truncated peptides 14, 15, 31 and 32 were tested to define the minimal epitope. Six of the 13 TCRs were responsive to the synthetic peptides. The seven remaining TCRs are reactive to the N-terminal epitope SBP76–84 in Extended Data Fig. 9a. There is a strong correlation between the reactivity of TCRs and the TCR CDR3 sequences. g, Predicted structure of the SBP from AlphaFold2. The SBP405–413 and SBP76–84 epitopes, shown in red and blue, respectively, lie within the central beta sheet of the membrane-proximal domain. h, Induction of SBP-specific T cells in vivo. Colonic T cells from hCom1d- or hCom2d-colonized mice were isolated and cocultured with SBP405–413 and DCs and monitored for Nur77 expression by FACS. n = 8 mice per group from two independent experiments. Statistical analysis was a two-sided t-test. Error bars are standard deviations. *P < 0.05; ***P < 0.001; NS > 0.05. In hCom1d and hCom2d-colonized mice, TH17 and pTreg cells showed an antigen-specific response to SBP. Notably, SBP-specific T cells were also found in SPF mice, suggesting that the SBP is broadly conserved among Firmicutes that colonize the intestine.

References

    1. Yang Y et al. Focused specificity of intestinal TH17 cells towards commensal bacterial antigens. Nature 510, 152–156 (2014). - PMC - PubMed
    1. Xu M et al. c-MAF-dependent regulatory T cells mediate immunological tolerance to a gut pathobiont. Nature 554, 373–377 (2018). - PMC - PubMed
    1. Linehan JL et al. Non-classical immunity controls microbiota impact on skin immunity and tissue repair. Cell 172, 784–796.e18 (2018). - PMC - PubMed
    1. Ansaldo E et al. Akkermansia muciniphila induces intestinal adaptive immune responses during homeostasis. Science 364, 1179–1184 (2019). - PMC - PubMed
    1. Ivanov II, Tuganbaev T, Skelly AN & Honda K T cell responses to the microbiota. Annu. Rev. Immunol. 40, 559–587 (2022). - PMC - PubMed

Publication types

Substances

LinkOut - more resources