. 2023 Aug;620(7976):1071-1079.
doi: 10.1038/s41586-023-06436-3. Epub 2023 Aug 16.

Platelet factors attenuate inflammation and rescue cognition in ageing

Affiliations

Platelet factors attenuate inflammation and rescue cognition in ageing

Adam B Schroer et al. Nature. 2023 Aug.

Abstract

Identifying therapeutics to delay, and potentially reverse, age-related cognitive decline is critical in light of the increased incidence of dementia-related disorders forecasted in the growing older population1. Here we show that platelet factors transfer the benefits of young blood to the ageing brain. Systemic exposure of aged male mice to a fraction of blood plasma from young mice containing platelets decreased neuroinflammation in the hippocampus at the transcriptional and cellular level and ameliorated hippocampal-dependent cognitive impairments. Circulating levels of the platelet-derived chemokine platelet factor 4 (PF4) (also known as CXCL4) were elevated in blood plasma preparations of young mice and humans relative to older individuals. Systemic administration of exogenous PF4 attenuated age-related hippocampal neuroinflammation, elicited synaptic-plasticity-related molecular changes and improved cognition in aged mice. We implicate decreased levels of circulating pro-ageing immune factors and restoration of the ageing peripheral immune system in the beneficial effects of systemic PF4 on the aged brain. Mechanistically, we identified CXCR3 as a chemokine receptor that, in part, mediates the cellular, molecular and cognitive benefits of systemic PF4 on the aged brain. Together, our data identify platelet-derived factors as potential therapeutic targets to abate inflammation and rescue cognition in old age.


Conflict of interest statement

The regents of the University of California have applied for a provisional patent application arising from this work (‘Platelet factors and cognitive improvement’; PCT/US2021/017580; A.B.S., P.B.V. and S.A.V. are listed as coinventors). S.A.V. consulted for SV Health Investors and The Herrick Company. The other authors declare no competing interests.

Figures

Fig. 1
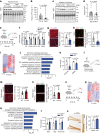
Fig. 1. Platelet factors mitigate neuroinflammation in the aged hippocampus.
a,b, Flow cytometry analysis of CD61+ platelets in mouse whole blood (a) and in the platelet fraction of young plasma preparations (b). c, Western blot of platelet marker thrombospondin-1 (THSB-1) in the young plasma preparation (prep.), the platelet-depleted fraction and the platelet fraction of mice. d, The timeline of administration of each treatment to aged (20 months) male mice. eh, RNA-seq analysis of the hippocampus of aged mice after systemic treatment with young plasma preparation (yellow; n = 6 mice) or young platelet fraction (blue; n = 6 mice) relative to aged saline-treated mice (n = 5 mice). e, DEGs (P < 0.05) in the hippocampus of aged mice. fh, GO terms associated with DEGs after treatment with young plasma preparation (f) and young platelet fraction (g) and the overlapping DEGs (h). i, qPCR analysis of neuroinflammation-related gene expression relative to Gapdh in the hippocampus of aged mice. n = 5 (saline), 6 (young plasma) and 6 (young platelet fraction) mice. j,k, Representative images and quantification of the C1q signal intensity (j; n = 10 mice per group) and IBA1+ and CD68+ cells (k; n = 11 (saline), 12 (young plasma) and 11 (platelet fraction) mice) in the dentate gyrus of the aged hippocampus. Uncropped immunoblots are provided in Supplementary Fig. 1. Scale bars, 25 μm (j) and 100 μm (k). Data are mean ± s.e.m. Statistical analysis was performed using Fisher’s exact tests (fh) and one-way analysis of variance (ANOVA) with Dunnett’s post hoc test (ik). Source data
Fig. 2
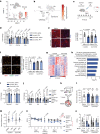
Fig. 2. Systemic PF4 attenuates neuroinflammation and elicits synaptic-related changes in the aged hippocampus.
a,b, Western blot analysis of PF4 in the platelet fraction (n = 4 independent samples per group) (a) and ELISA of PF4 in blood plasma preparations from young (3 months) and aged (20 months) mice (n = 8 mice per group) (b). c,d, Western blot analysis (c) and quantification (d) of PF4 in platelet-rich plasma from young (27.1 ± 3.7 years) and older (66.3 ± 4.2 years; n = 16 participants per group) humans. e, The timeline of saline or PF4 administration to aged male mice. f, qPCR analysis of neuroinflammation-related gene expression relative to Gapdh in the aged hippocampus (n = 5 saline; 6 PF4 mice). g,h, Representative images and quantification of C1q signal intensity (g; n = 6 (saline) and 7 (PF4) mice) and IBA1+ and CD68+ cells (h; n = 6 mice per group) in the dentate gyrus of the aged hippocampus. ik, Significant DEGs (P < 0.01) after RNA-seq analysis (i), associated GO terms (j) and the fold change in expression (fragments per kilobase of transcript per million mapped reads (FPKM)) of TNF-signalling-related genes (k) in aged hippocampal microglia (n = 3 (saline) and 4 (PF4) mice). l, Schematic of middle-aged (12–14 months) WT and Pf4-deficient (Pf4 KO) male mice. m,n, Representative images and quantification of C1q signal intensity (m; n = 8 WT; 9 Pf4-KO mice) and IBA1+ and CD68+ cells (n; n = 10 mice per group) in the dentate gyrus of the middle-aged hippocampus. o, The timeline of saline or PF4 administration to aged male mice. pr, Significant DEGs (P < 0.05) after RNA-seq analysis (p), associated GO terms (q) and the fold change in expression (FPKM) of synaptic-transmission-related genes (r) in the aged hippocampus (n = 4 (saline) and 6 (PF4) mice). s, Representative images and quantification of CREB phosphorylation (p-CREB) immunolabelling in the aged hippocampus (n = 6 mice per group). Uncropped immunoblots are provided in Supplementary Fig. 1. Data are mean ± s.e.m. Statistical analysis was performed using two-tailed unpaired t-tests (b, d, fh, k, m, n, r and s) and Fisher’s exact tests (j and q). Scale bars, 10 μm (g and m), 100 μm (h and n) and 150 μm (s). Source data
Fig. 3
Fig. 3. Systemic PF4 restores the ageing peripheral immune system to a more youthful state.
a, The timeline of HDTVI of expression constructs to aged (20 months) male mice. b, Luminescence-based quantification of PF4–HiBiT in aged mice after HDTVI (n = 3 (GFP) and 4 (PF4–HiBiT) mice). c, The timeline of saline or PF4 administration to young (3 months) and aged male mice. df, Quantification of plasma levels of CCL2 (d; n = 9 (young, saline), 25 (aged, saline) and 17 (aged, PF4) mice) and TNF (e; n = 11 (young, saline), 27 (aged, saline) and 19 (aged, PF4) mice) by ELISA and CyPA (f; n = 9 (young, saline), 10 (aged, saline) and 10 (aged, PF4) mice) by western blotting. gp, CITE-seq analysis of splenocytes from young and aged saline-treated controls, and aged PF4-treated mice (n = 5 pooled mice per group). g, Combined two-dimensional visualization of single-cell clusters. DC, dendritic cell; NK, natural killer cells; NKT, natural killer T cells; TEM, T effector memory cells; TH, T helper cells; Treg, regulatory T cells. h, Comparison of the ratio of myeloid cells to lymphoid cells in the spleen. i, The top 20 DEGs in myeloid cells from each group. j, GO terms associated with downregulated genes in aged myeloid cells after PF4 administration relative to the control. k, Complement C3 and Lcn2 expression in myeloid cells. l, The fold change in myeloid cell populations relative to young control mice. m, The top 20 DEGs in T cells from each group. n, GO terms associated with downregulated genes in aged T cells after PF4 administration relative to the control. o, Tox and Nkg7 expression in T cells. p, The fold change in aged T cell populations relative to young control mice. Data are mean ± s.e.m., except for the violin plots in k and o. Statistical analysis was performed using one-way ANOVA with Tukey’s post hoc test (df) and Fisher’s exact test with false-discovery rate correction (j and n). Source data
Fig. 4
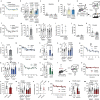
Fig. 4. Systemic PF4 improves hippocampal-dependent cognitive function in aged mice.
a, Schematic of the administration of treatments to aged (20 months) male mice and the cognitive testing timeline. i.v., intravenous; FC, fear conditioning. b, Object recognition memory was assessed by NOR as the percentage of time exploring the novel object (n = 14 (saline), 15 (young plasma preparation) and 14 (young platelet fraction) mice). c, Spatial working memory was assessed using the Y maze as the discrimination index for the novel arm (n = 12 (saline), 14 (young plasma preparation) and 14 (young platelet fraction) mice). d, Associative fear memory was assessed by contextual fear conditioning as the percentage of time freezing (n = 17 (saline), 11 (plasma) and 10 (platelet fraction) mice). e,i,l, Schematics of the administration of saline or mouse PF4 (mPF4) to aged male (e) and female (i) mice, or hPF4 to aged male mice (l) and the cognitive testing timeline. f,j,m, Object recognition memory was assessed by NOR in mPF4-treated aged male (f; n = 11 (saline) and 14 (PF4) mice) or female (j; n = 13 (saline) and 11 (PF4) mice) mice, or hPF4-treated aged male mice (m; n = 15 (saline) and 16 (hPF4) mice). g,n, Spatial learning and memory was assessed using the RAWM as the number of entry errors in mPF4-treated (g; n = 12 (saline) and 11 (PF4) mice) and hPF4-treated (n; n = 19 (saline) and 16 (hPF4) mice) aged male mice. h,k, Spatial working memory was assessed using the Y maze in mPF4-treated aged male (h; n = 11 (saline) and 9 (PF4) mice) and female (k; n = 12 mice per group) mice. o, Schematic of cognitive testing of middle-aged (12–14 months) WT and Pf4-deficient (Pf4-KO) male mice. pr, Learning and memory was assessed by NOR (p; n = 18 WT; 14 Pf4-KO mice), RAWM (q; n = 18 WT; 15 Pf4-KO mice) and Y maze (r; n = 17 WT; 15 Pf4-KO mice) testing. Data are mean ± s.e.m. Statistical analysis was performed using two-tailed one-sample t-tests (b,c,f,h,j,k,m,p and r), one-way ANOVA with Šidák’s post hoc test (d) and two-way ANOVA with Šidák’s post hoc test (g, n and q). Source data
Fig. 5
Fig. 5. CXCR3 mediates, in part, the benefits of systemic PF4 on the aged hippocampus.
a,b, Cxcr3 expression in spleen (a) and hippocampus (b) clusters was analysed using single-cell and single-nucleus RNA-seq, respectively. DG, dentate gyrus; TPM, transcripts per million. c, The timeline of saline or PF4 administration to aged (19–21 months) Cxcr3-deficient (Cxcr3-KO) and littermate control (WT/heterozygous) mice. d, qPCR analysis of neuroinflammation-related gene expression relative to Gapdh in the aged hippocampus (n = 10 (control, saline), 9 (control, PF4), 10 (Cxcr3-KO, saline) and 11 (Cxcr3-KO, PF4) mice). e,f, Representative images and quantification of C1q signal intensity (e; n = 6 mice per group) and IBA1+ and CD68+ cells (f; n = 5 (control, saline), 5 (control, PF4), 6 (Cxcr3-KO, saline) and 6 (Cxcr3-KO, PF4) mice) in the dentate gyrus of the aged hippocampus. gi, RNA-seq analysis of aged hippocampi from saline- and PF4-treated control and PF4-treated Cxcr3-KO mice (n = 6 mice per group). Scale bars, 25 μm (e) and 100 μm (f). g, Significant DEGs (P < 0.01) from PF4-treated mice relative to saline-treated control mice. h, GO terms associated with DEGs after PF4 treatment in control mice, but not Cxcr3-KO mice. i, The fold change (FPKM) in synaptic-plasticity-related genes. j, qPCR analysis of synaptic-plasticity-related gene expression relative to Gapdh in the aged hippocampus (n = 8 mice per group). k, Schematic of cognitive testing. l, Object recognition memory was assessed using NOR as the percentage time spent exploring the novel object (n = 17 (control, saline); 9 (control, PF4), 15 (Cxcr3-KO, saline) and 11 (Cxcr3-KO, PF4) mice). m, Spatial working memory was assessed using the Y maze as the discrimination index for the novel arm (n = 17 (control, saline), 9 (control, PF4), 16 (Cxcr3-KO, saline) and 13 (Cxcr3-KO, PF4) mice). n,o, Spatial learning and memory was assessed using the RAWM as the number of entry errors (n = 17 (control, saline), 10 (control, PF4); 17 (Cxcr3-KO, saline) and 13 (Cxcr3-KO, PF4) mice). Data are mean ± s.e.m. Statistical analysis was performed using two-tailed one-sample t-tests (l and m), one-way ANOVA with Šidák’s post hoc test (df, i and j), Fisher’s exact tests (h), two-way ANOVA with Tukey’s post hoc test (n) and three-way ANOVA with Šidák’s post hoc test (o). Source data
Extended Data Fig. 1
Extended Data Fig. 1. The beneficial effect of systemic administration of platelet factors on neuroinflammation in the hippocampus is age-dependent.
(a) Schematic illustrates young (5 months) and aged mice (22 months) used for analyses. (b) qPCR of neuroinflammation-related gene expression relative to Gapdh in hippocampi from young and aged mice (n = 4 young; 5 aged mice). (c,d) Representative images and quantification of C1q signal intensity (c; n = 6 mice/group; scale bars = 25 µm) and Iba1- and CD68-positive cells (d; n = 6 young; 5 aged mice; scale bars = 50 µm) in the dentate gyrus of the hippocampus. (e) Schematic illustrates timeline of tail vein injection of saline or the aged platelet fraction of plasma into aged mice. (f) qPCR of neuroinflammation-related gene expression relative to Gapdh in aged hippocampi (n = 9 mice/group). (g,h) Representative images and quantification of C1q signal intensity (g; n = 7 saline; 9 aged platelet fraction mice; scale bars = 50 µm) and Iba1- and CD68-positive cells (h; n = 8 saline; 9 aged platelet fraction mice; scale bars = 50 µm) in the dentate gyrus of the aged hippocampus. (i) Schematic illustrates timeline of saline or PF4 administration to young mice (3 months). (j) qPCR of neuroinflammation-related gene expression relative to Gapdh in young hippocampi (n = 9 saline; 7 PF4 mice). (k,l) Representative images and quantification of C1q signal intensity (k; n = 9 saline; 7 PF4 mice; scale bars = 10 µm) and Iba1- and CD68-positive cells (l; n = 9 saline; 7 PF4 mice; scale bars = 50 µm) in the dentate gyrus of the young hippocampus. (m–n) Percent change in weight of aged (m; n = 16 saline; 12 PF4 mice) and young (n; n = 9 saline; 8 PF4 mice) mice during treatment. Data shown as mean±s.e.m.; two-tailed unpaired t-test (b-d,f-h,j-l), two-way ANOVA with Šidák’s post-hoc test (m,n). Source data
Extended Data Fig. 2
Extended Data Fig. 2. Systemic administration of PF4 does not cross the BBB in aged or young mice, but affects the systemic milieu.
(a) Luminescence-based quantification of PF4-HiBiT and TRF-HiBiT in tissues from young (3 months) and aged (20 months) mice following HDTVI (n = 7 GFP; 3 young PF4-HiBiT; 6 aged PF4-HiBiT; 2 young TRF-HiBiT; 4 aged TRF-HiBiT mice). (b) Quantification of plasma levels of β2M by ELISA (n = 8 mice/group). (c) Representative Western blot of Cyclophilin A (CyPA) in blood plasma preparation. For uncropped immunoblots, see Supplementary Fig. 1. Data shown as mean±s.e.m.; one-way ANOVA with Tukey’s post-hoc test (b). Source data
Extended Data Fig. 3
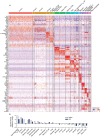
Extended Data Fig. 3. CITE-seq gene signature and populations for each cell cluster.
(a) Heatmap of the expression levels of the top five marker genes for each of the 21 identified cell clusters. (b) Fold-change in cell populations from the spleen of aged saline treated control and aged PF4 treated mice, relative to young saline treated control mice (n = 5 pooled mice/group). Source data
Extended Data Fig. 4
Extended Data Fig. 4. Systemic administration of PF4 restores spleen-derived immune cells to a more youthful state in aged mice.
(a) Gene ontology (GO) terms associated with downregulated genes in myeloid cells from aged saline-treated mice relative to young saline-treated mice. (b) GO terms associated with upregulated genes in myeloid cells from aged saline-treated mice relative to young saline-treated mice. (c) GO terms associated with upregulated genes in myeloid cells following PF4 administration relative to aged saline-treated mice. (d) GO terms associated with downregulated genes in T cells from aged saline-treated mice relative to young saline-treated mice. (e) GO terms associated with upregulated genes in T cells from aged saline-treated mice relative to young saline-treated mice. (f) GO terms associated with upregulated genes in T cells following PF4 administration relative to aged saline-treated mice. (g–h) Violin plot of the expression levels in myeloid cells of inflammatory mediator genes (g) S100a8 and (h) S100a9 (n = 5 pooled mice/group). (i–l) Violin plot comparing the expression levels in T cells of genes associated with a naïve phenotype including (i) Sell, (j) Dapl1, (k) Satb1, and (l) Foxp1 (n = 5 pooled mice/group). (m-n) Violin plots showing expression levels of (m) Gzmk and (n) Pdcd1 (encoding PD-1) in all cell clusters (splenoctyes from 3 groups with 5 pooled mice/group). Fisher exact test with False Discovery Rate correction (a–f).
Extended Data Fig. 5
Extended Data Fig. 5. Validation of PF4-mediated changes to spleen-derived immune cells in aged mice.
(a-c) Flow cytometry gating strategy for the identification of CD45+ myeloid (lin−) and lymphoid (lin+) cells, neutrophils (CD45+, lin−, Ly6G+), and macrophages (CD45+, lin−, F4/80+, CD11b+) in the aged spleen. (b) Comparison of the ratio of myeloid cells to lymphoid cells in the spleen of saline and PF4 treated aged mice (n = 8 saline; 9 PF4 mice). (c) Comparison of the relative populations of neutrophils and macrophages in the spleen (n = 8 saline; 9 PF4 mice). (d) qPCR of inflammation-related genes relative to Gapdh in the aged spleen (n = 12 saline; 11 PF4 mice). (e–f) Flow cytometry gating strategy for the identification of CD4+ T cells, CD8+ T cells, and CD8+ T effector memory cells (CD45+, CD3+, CD8+, CD44HI, CD62LLO) in the aged spleen. (f) Comparison of the relative populations of T cells in the spleen (n = 8 mice/group). (g) Schematic of aged T cell isolation, activation, and treatment with vehicle or PF4 (1 μg ml−1). (h,i) Flow cytometry gating strategy for the identification of the exhaustion marker PD1 in CD4+ and CD8+ T cells following in vitro activation of aged T cells. (i) Quantification of PD-1 expression in CD4+ and CD8+ T cells by flow cytometry (n = 6 biologically independent samples/group). Data shown as mean ± s.e.m.; two-tailed unpaired t-test (b,c,d,f), two-way ANOVA with a Šidák post hoc test (i). Source data
Extended Data Fig. 6
Extended Data Fig. 6. Young platelet factors and PF4 improve hippocampal-dependent cognitive function in aged mice.
(a) Baseline activity of aged mice (20 months) treated with saline (n = 15), young plasma preparation (n = 15), or the young platelet fraction (n = 16) assessed with open field testing as the number of beam-breaks each minute. (b) Spatial working memory assessed by Y Maze as percent of entries in the arms (n = 12 saline; 14 young plasma preparation; 14 young platelet fraction mice). (c,d) Baseline freezing behaviour and amygdala-dependent associative fear memory assessed using cued fear conditioning in aged mice treated with saline (n = 17), young plasma preparation (n = 11), or the young platelet fraction (n = 10). (e) Schematic illustrates administration of treatments to aged male mice and cognitive testing timeline. (f) Baseline activity assessed with open field testing (n = 9 mice/group). (g) Object recognition memory assessed by novel object recognition (NOR) as time spent exploring a novel object (n = 9 saline; 7 aged platelet fraction mice). (h–i) Spatial working memory assessed by Y Maze as percent of entries (h), and the discrimination index for the novel arm (i, n = 9 mice/group). (j–l) Baseline freezing behaviour and associative fear memory assessed using contextual (k) and cued (l) fear conditioning as percent time freezing (n = 9 mice/group). (m,p,r) Baseline activity assessed with open field testing of mouse PF4 (mPF4) treated aged male (m, n = 10 mice/group), or female (p, n = 13 saline; 12 PF4 mice) mice, or human PF4 (hPF4) treated aged male mice (r, n = 15 saline; 16 hPF4 mice). (n,s) Comparison of the number of errors committed during the first and last block of radial arm water maze (RAWM) in mPF4 treated (n; n = 12 saline; 11 PF4 mice) and hPF4 treated (s; n = 19 saline; 16 hPF4 mice) aged male mice. (o,q) Spatial working memory in aged male (o, n = 11 saline; 9 PF4 mice) and female mice (q, n = 12 mice/group) assessed by Y Maze as percent of entries. (t) Schematic illustrates cognitive testing of mature adult (6-8 months old) wild-type (WT) and Pf4-deficient (PF4KO) mice. (u,y) Baseline activity assessed with open field testing in mature adult (u, n = 18 WT; 15 PF4KO mice) and middle-aged male mice (y; n = 18 WT; 15 PF4KO mice). (v) Object recognition memory assessed by NOR (n = 18 WT; 14 PF4KO mice). (w-x) Spatial working memory assessed by Y Maze as percent time in arms (w) and the discrimination index for the novel arm (x, n = 17 WT; 13 PF4KO mice). (z) Comparison of the number of errors committed during the first and last block of RAWM (n = 18 WT; 15 PF4KO mice). (aa) Spatial working memory assessed by Y Maze as percent time in arms (n = 17 WT and 15 PF4KO mice). Data shown as mean ± s.e.m.; two-way ANOVA with Šidák’s post-hoc (a,b,f,h,m,n,o,p,q,r,s,u,w,y,z,aa), one-way ANOVA with Šidák’s post hoc (c,d), two-tailed unpaired t-test (g,j,k,l), two-tailed one-sample t-test (i,v,x). Source data
Extended Data Fig. 7
Extended Data Fig. 7. Expression of CXCR3 across human tissues and cells.
(a-b) CXCR3 expression levels in human tissues and cells from previously published sequencing data (The Human Protein Atlas). (a) Consensus transcript expression levels in 54 tissues based on transcriptomics data from HPA and GTEx. The consensus normalized expression value is calculated as the maximum value for each gene in the two data sources. (b) Transcript expression levels of CXCR3 in 76 cell types from 26 datasets. Red bars indicate immune tissues and cells, and blue bars indicate CNS regions and cells. Underlying data are available at v21.proteinatlas.org and downloadable at http://www.proteinatlas.org/ENSG00000186810.tsv. Source data
Extended Data Fig. 8
Extended Data Fig. 8. Systemic administration of PF4 in aged Cxcr3 KO and control mice does not alter activity.
(a) Baseline activity of aged control and Cxcr3 KO mice treated with saline or PF4 assessed with open field testing as the number of beam-breaks each minute (n = 12 control/saline; 11 control/PF4; 17 CXCR3KO/saline; 16 CXCR3KO/PF4 mice). (b) Spatial working memory assessed by Y Maze as percent of entries in the start, trained, and novel arms (n = 17 control/saline; 9 control/PF4; 16 CXCR3KO/saline; 13 CXCR3KO/PF4 mice). Data shown as mean±s.e.m.; two-way analysis of variance (ANOVA) with Šidák’s correction for multiple comparisons (a,b). Source data

Comment in

References

    1. James SL, et al. Global, regional, and national incidence, prevalence, and years lived with disability for 354 diseases and injuries for 195 countries and territories, 1990–2017: a systematic analysis for the Global Burden of Disease Study 2017. Lancet. 2018;392:1789–1858. doi: 10.1016/S0140-6736(18)32279-7. - DOI - PMC - PubMed
    1. Katsimpardi L, et al. Vascular and neurogenic rejuvenation of the aging mouse brain by young systemic factors. Science. 2014;344:630–634. doi: 10.1126/science.1251141. - DOI - PMC - PubMed
    1. Villeda SA, et al. Young blood reverses age-related impairments in cognitive function and synaptic plasticity in mice. Nat. Med. 2014;20:659–663. doi: 10.1038/nm.3569. - DOI - PMC - PubMed
    1. Castellano JM, et al. Human umbilical cord plasma proteins revitalize hippocampal function in aged mice. Nature. 2017;544:488–492. doi: 10.1038/nature22067. - DOI - PMC - PubMed
    1. Ozek C, Krolewski RC, Buchanan SM, Rubin LL. Growth differentiation factor 11 treatment leads to neuronal and vascular improvements in the hippocampus of aged mice. Sci. Rep. 2018;8:17293. doi: 10.1038/s41598-018-35716-6. - DOI - PMC - PubMed

Publication types

MeSH terms