. 2023 Aug 16;20(1):188.
doi: 10.1186/s12974-023-02870-2.

Microglial senescence contributes to female-biased neuroinflammation in the aging mouse hippocampus: implications for Alzheimer's disease

Affiliations

Microglial senescence contributes to female-biased neuroinflammation in the aging mouse hippocampus: implications for Alzheimer's disease

Sarah R Ocañas et al. J Neuroinflammation. .

Abstract

Background: Microglia, the brain's principal immune cells, have been implicated in the pathogenesis of Alzheimer's disease (AD), a condition shown to affect more females than males. Although sex differences in microglial function and transcriptomic programming have been described across development and in disease models of AD, no studies have comprehensively identified the sex divergences that emerge in the aging mouse hippocampus. Further, existing models of AD generally develop pathology (amyloid plaques and tau tangles) early in life and fail to recapitulate the aged brain environment associated with late-onset AD. Here, we examined and compared transcriptomic and translatomic sex effects in young and old murine hippocampal microglia.

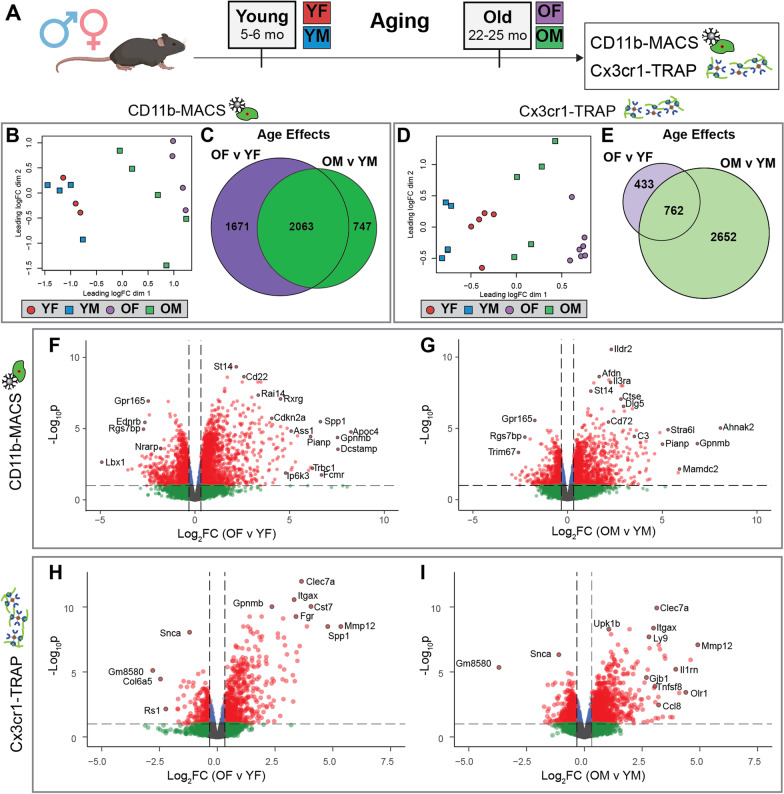
Methods: Hippocampal tissue from C57BL6/N and microglial NuTRAP mice of both sexes were collected at young (5-6 month-old [mo]) and old (22-25 mo) ages. Cell sorting and affinity purification techniques were used to isolate the microglial transcriptome and translatome for RNA-sequencing and differential expression analyses. Flow cytometry, qPCR, and imaging approaches were used to confirm the transcriptomic and translatomic findings.

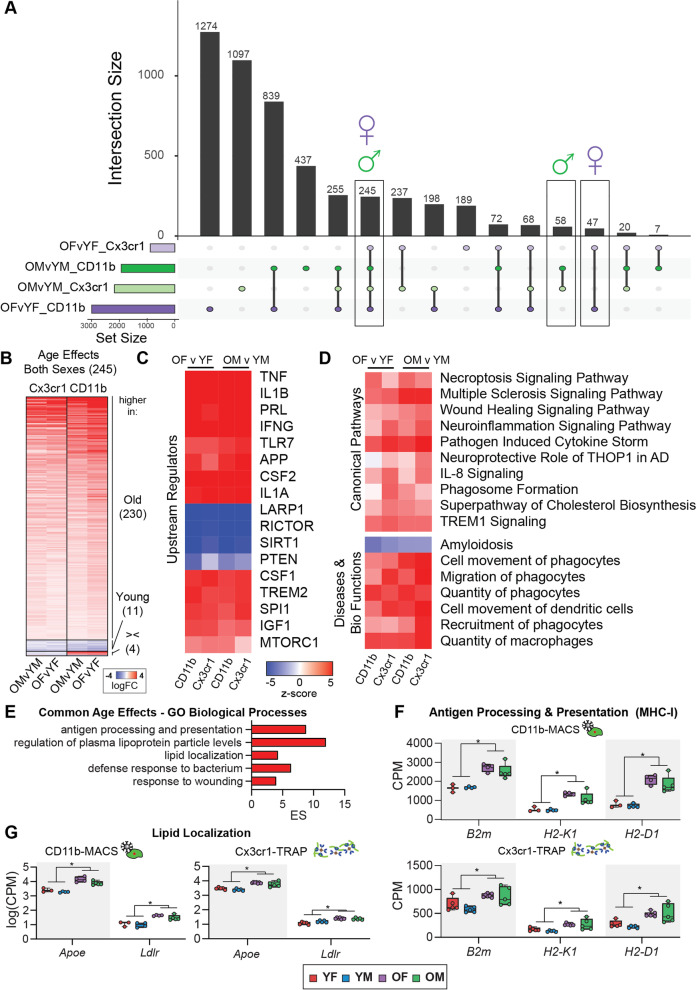
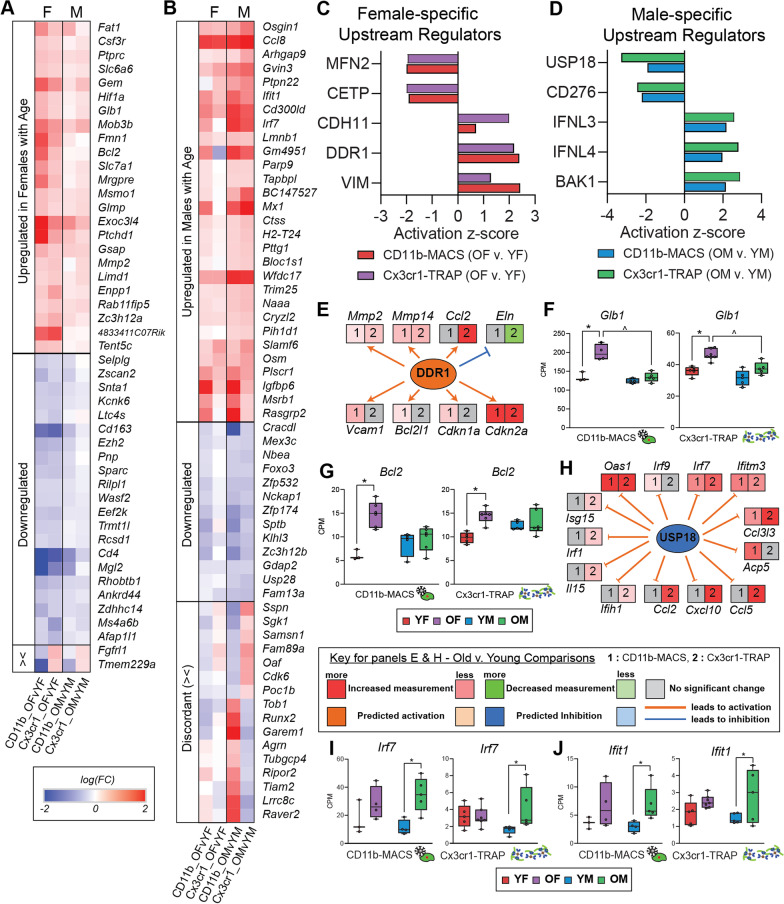
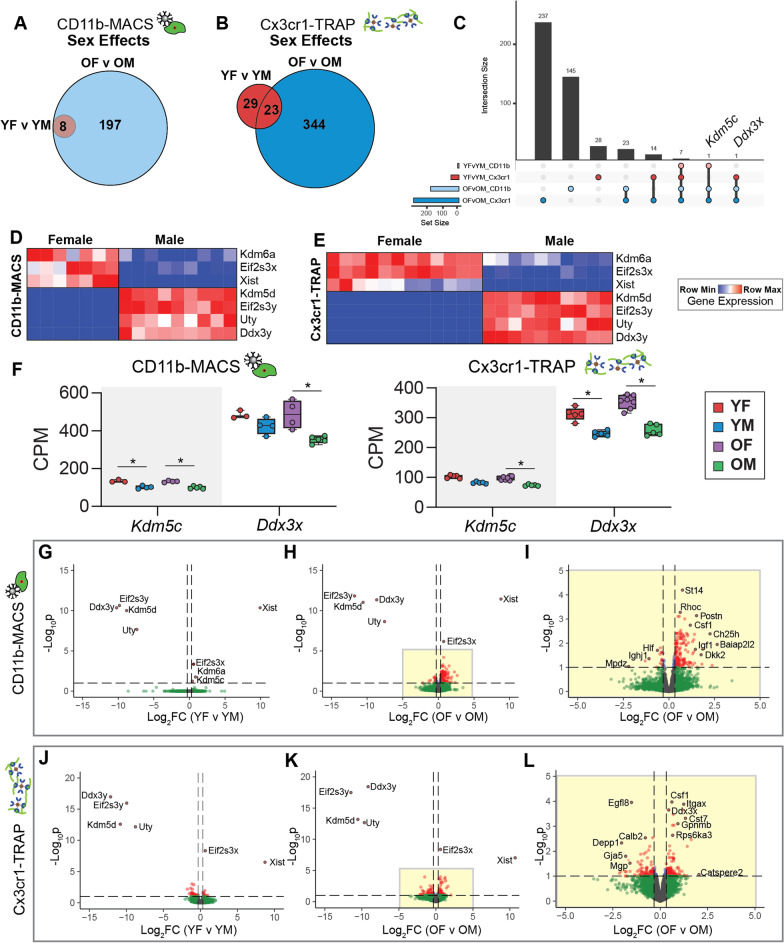
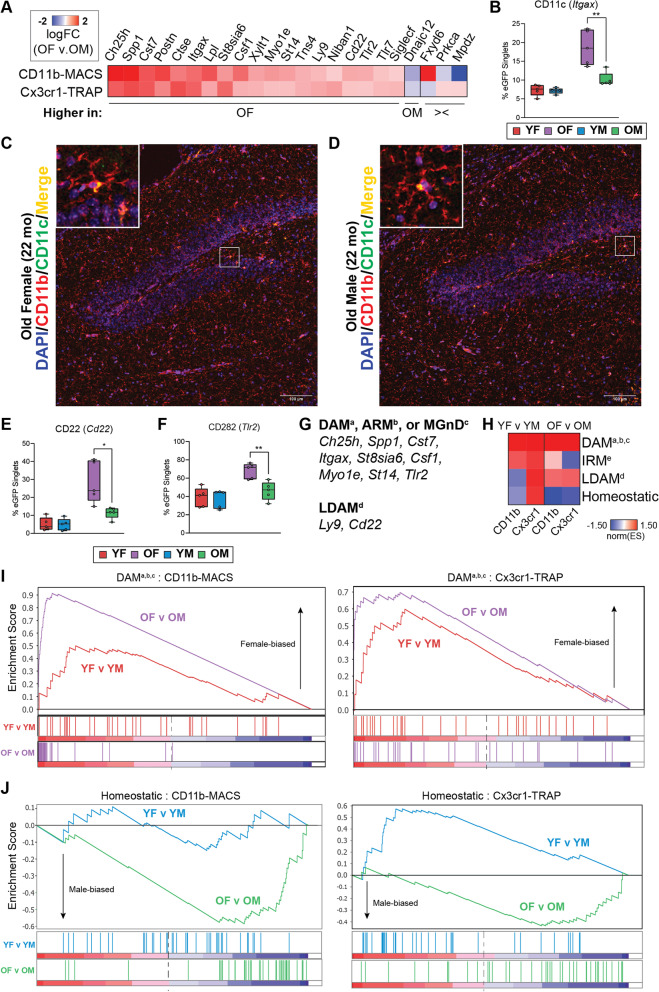
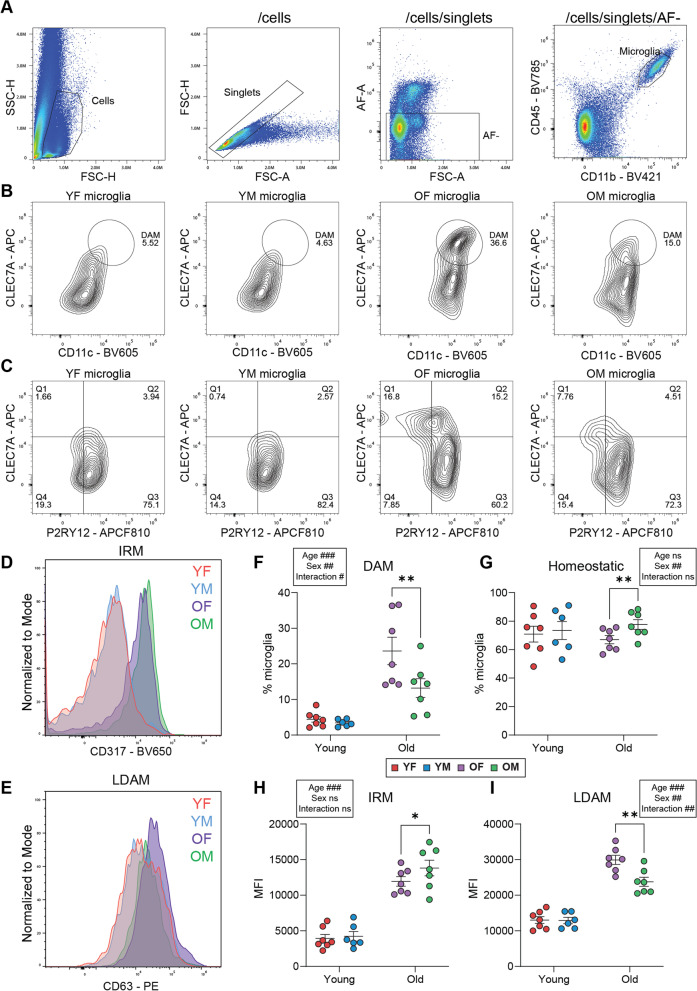
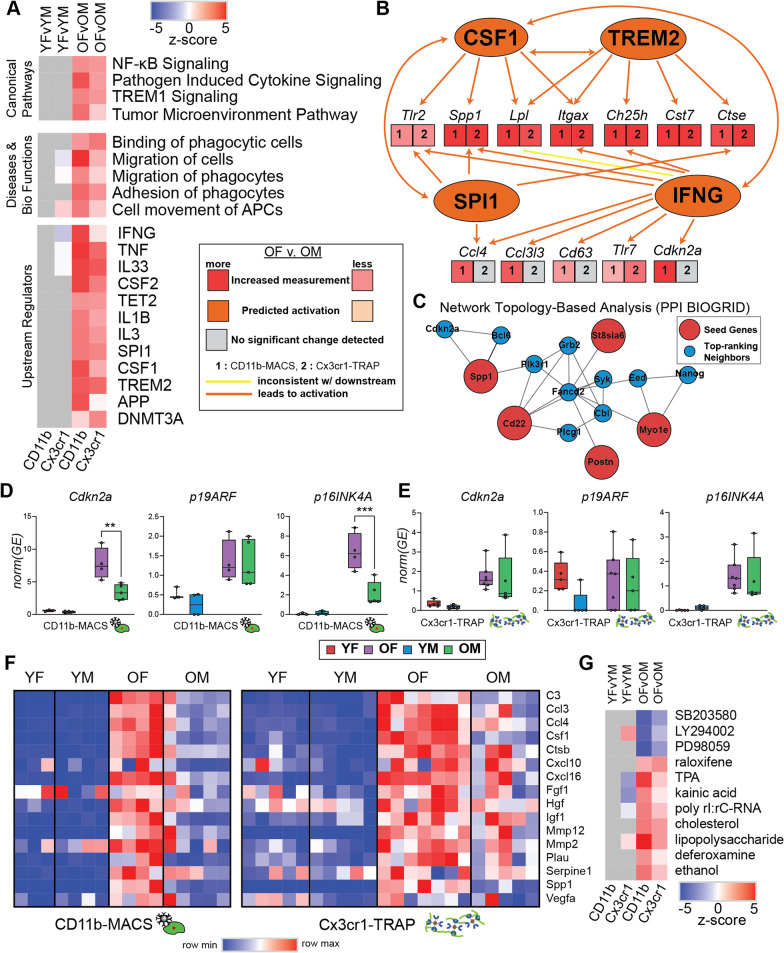
Results: There were marginal sex differences identified in the young hippocampal microglia, with most differentially expressed genes (DEGs) restricted to the sex chromosomes. Both sex chromosomally and autosomally encoded sex differences emerged with aging. These sex DEGs identified at old age were primarily female-biased and enriched in senescent and disease-associated microglial signatures. Normalized gene expression values can be accessed through a searchable web interface ( https://neuroepigenomics.omrf.org/ ). Pathway analyses identified upstream regulators induced to a greater extent in females than in males, including inflammatory mediators IFNG, TNF, and IL1B, as well as AD-risk genes TREM2 and APP.

Conclusions: These data suggest that female microglia adopt disease-associated and senescent phenotypes in the aging mouse hippocampus, even in the absence of disease pathology, to a greater extent than males. This sexually divergent microglial phenotype may explain the difference in susceptibility and disease progression in the case of AD pathology. Future studies will need to explore sex differences in microglial heterogeneity in response to AD pathology and determine how sex-specific regulators (i.e., sex chromosomal or hormonal) elicit these sex effects.

Keywords: Alzheimer’s disease; Brain aging; Disease-associated microglia; Hippocampus; Microglia; Neuroinflammation; Senescence; Sex divergence; Sex effects; Transcriptomics.


Conflict of interest statement

The authors declare that they have no competing interests.

Figures

Fig. 1
Fig. 1
Analysis of sex-specific microglial transcriptomic (CD11b-MACS) and translatomic (Cx3cr1-TRAP) age effects from mouse hippocampus. A Schematic of experimental grouping. Male and female C57BL/6N or Cx3cr1-NuTRAP mice were collected at young (5–6 months) and old (22–25 months) timepoints to form four groups: (1) young female (YF), (2) young male (YM), (3) old female (OF), and (4) old male (OM). Stranded RNA-Seq libraries were constructed from microglial RNA isolated by CD11b-MACS (n = 3–5/sex/age) or Cx3cr1-TRAP (n = 5–7/sex/age) and sequenced on an Illumina NovaSeq6000 platform. Demultiplexed fastq files were aligned and deduplicated in StrandNGS software prior to quantification (featureCounts) and differential expression calling (edgeR) in R. B Multidimensional scaling (MDS) plot of CD11b-MACS gene expression shows separation in the first dimension by age. Of note, the young samples do not show separation by sex, whereas the old samples can be separated into male and female groups. C Sets of differentially expressed genes (GLM QLF-test, FDR < 0.1) showing an age effect in females (OF v YF) or males (OM v YM) within the CD11b-MACS dataset were compared by Venn diagram. D MDS plot of Cx3cr1-TRAP gene expression shows separation in the first dimension by age and sex. E Sets of differentially expressed genes (GLM QLF-test, FDR < 0.1) showing an age effect in females (OF v YF) or males (OM v YM) within the Cx3cr1-TRAP dataset were compared by Venn diagram. Volcano plots of differentially expressed genes with age (GLM QLF-test, FDR < 0.1, |FC|> 1.25) within CD11b-MACS for F females and G males, in addition to Cx3cr1-TRAP for H females and I males
Fig. 2
Fig. 2
Comparison of hippocampal microglial transcriptomic age effects between CD11b-MACS and Cx3cr1-TRAP methods. A Upset plot of differentially expressed genes by age with both sexes and across both methods (GLM QLF-test, FDR < 0.1, |FC|> 1.25). B Differentially expressed genes with age that were identified in both males and females across both methods (GLM QLF-test, FDR < 0.1, |FC|> 1.25). C Ingenuity pathway analysis identified conserved ‘Upstream Regulators’ across both sexes and methods (|z|> 2, p < 0.05). D Ingenuity pathway analysis identified conserved ‘Canonical Pathways’ and ‘Diseases and Bio Functions’ across both sexes and methods (|z|> 2, p < 0.05). E Top 5 GO Biological Processes for age effects altered in the same direction across both methods and sexes (Hypergeometric test, BH MTC, FDR < 0.05). F Gene expression (CPM) of antigen processing and presentation genes (B2m, H2-K1, H2-D1) (GLM QLF-test, |FC|> 1.25, *FDR < 0.1 for OF v YF and OM v YM comparisons). G Gene expression (log10CPM) of lipid localization genes (Apoe, Lplr) (GLM QLF-test, |FC|> 1.25, *FDR < 0.1 for OF v YF and OM v YM comparisons)
Fig. 3
Fig. 3
Sex-specific age effects in the microglial transcriptome and translatome. A Heatmap of female-specific age effects (OF v. YF) identified as significantly upregulated or downregulated in the CD11b-MACS and Cx3cr1-TRAP analyses (GLM QLF-test, FDR < 0.1, |FC|> 1.25). B Heatmap of male-specific age effects (OM v. YM) identified as significantly upregulated or downregulated in the CD11b-MACS and Cx3cr1-TRAP analyses (GLM QLF-test, FDR < 0.1, |FC|> 1.25). C Select IPA upstream regulators that were identified as differentially regulated by age in females only across the CD11b-MACS and Cx3cr1-TRAP analyses (FDR < 0.1). D Select IPA upstream regulators that were identified as differentially regulated by age in males only across the CD11b-MACS and Cx3cr1-TRAP analyses (FDR < 0.1). E Expression analysis of genes downstream of IPA upstream regulator DDR1 that is altered with age only in females. F, G Gene expression (CPM) of F Glb1 and G Bcl2 which change with age in only females (GLM QLF-test, |FC|> 1.25, *FDR < 0.1 age effect (O v. Y), ^FDR < 0.1, sex effect (F v. M)). Boxplots represent the median ± IQR. H Expression analysis of genes downstream of IPA upstream regulator USP18 that is altered with age in males only. I, J Gene expression (CPM) of I Irf7 and J Ifit1 which change with age in only males (GLM QLF-test, |FC|> 1.25, *FDR < 0.1 age effect (O v. Y), ^FDR < 0.1, sex effect (F v. M)). Boxplots represent the median ± IQR
Fig. 4
Fig. 4
Analysis of microglial transcriptomic (CD11b-MACS) and translatomic (Cx3cr1-TRAP) sex effects from young and old mouse hippocampus. A Sets of differentially expressed genes (GLM QLF-test, FDR < 0.1) showing sex effects in young (YF v YM) or old (OF v OM) within the CD11b-MACS dataset were compared by Venn diagram. B Sets of differentially expressed genes (GLM QLF-test, FDR < 0.1) showing sex effects in young (YF v YM) or old (OF v OM) within the Cx3cr1-TRAP dataset were compared by Venn diagram. C Upset plot of differentially expressed genes by sex from both age groups and across methods (GLM QLF-test, FDR < 0.1, |FC|> 1.25). D, E Heatmap of the gene expression of seven DEGs by sex that were identified in young and old mice with both D CD11b-MACS and E Cx3cr1-TRAP methodologies. F Gene expression (CPM) of Kdm5c and Ddx3x from CD11b-MACS and Cx3cr1-TRAP analyses (GLM QLF-test, |FC|> 1.25, *FDR < 0.1). GI Volcano plots of differentially expressed genes with sex (GLM QLF-test, FDR < 0.1, |FC|> 1.25) within CD11b-MACS for G young and H old mice. I Inset of H volcano plot showing differentially expressed genes between old females and old males within the CD11b-MACS analysis. JL Volcano plots of differentially expressed genes with sex (GLM QLF-test, FDR < 0.1, |FC|> 1.25) within Cx3cr1-TRAP for J young and K old mice. L Inset of K volcano plot showing differentially expressed genes between old females and old males within the CD11b-MACS analysis
Fig. 5
Fig. 5
Sex differences in the transcriptome (CD11b-MACS) and translatome (Cx3cr1-TRAP) in old microglia. A Heatmap of the logFC(OF/OM) from the 23 sex DEGs identified in the old age groups across both the transcriptome (CD11b-MACS) and translatome (Cx3cr1-TRAP). B Flow cytometry confirmations of the percentage of CD11c (Itgax) (two-way ANOVA, Sidak’s MTC, *p < 0.05, **p < 0.01, ***p < 0.001). Boxplots represent the median ± IQR. C, D Representative confocal fluorescent microscopy images of sagittal brain sections captured in the hippocampus of old (22 mo) C female and D male mice show CD11c (pseudo-color green signal) in cells that co-expressed CD11b (red signal). E, F Flow cytometry confirmations of the percentage of E CD22 (Cd22), and F CD282 (Tlr2) positive cells among the eGFP+ cells from Cx3cr1-NuTRAP hippocampus (two-way ANOVA, Sidak’s MTC, *p < 0.05, **p < 0.01, ***p < 0.001). Boxplots represent the median ± IQR. G List of genes with female-biased expression in old microglia that overlap with DAMa [21], ARMb [60], MGnDc [61], and LDAMd [42] markers. H GSEA normalized enrichment scores comparing sex-biased enrichment of microglial phenotypic markers of DAMa,b,c [21, 60, 61], IRMe [60], LDAMd [42], or homeostatic states in young (YF v YM) or old (OF v OM) groups. I, J GSEA enrichment plots for I DAMa,b,c [21, 42, 60] and J homeostatic marker genes
Fig. 6
Fig. 6
Assessment of microglial heterogeneity by flow cytometry across age and sex. Hippocampal tissue from young (2–4 mo) and old (23 mo) C57BL6 wildtype mice of both sexes (n = 6–7/sex/age) was processed for flow cytometric analysis using markers for microglial identity (CD11b, CD45) and microglial phenotypic states: DAM (CD11c, CLEC7A), homeostatic (P2RY12), IRM (CD317), and LDAM (CD63). A Gating strategy to identify microglial cells (CD11b+CD45mid) after filtering on cells and singlets, and gating out auto-fluorescent (AF) cells. B The proportion of microglia displaying DAM phenotype markers was assessed by the percentage of microglia that were CD11chighCLEC7Ahigh. C The proportion of homeostatic microglia was assessed by the percentage of microglia that were P2RY12+CLEC7A. D Median fluorescent intensity (MFI) of IRM marker CD317 within the microglial population (normalized to the mode). E Median fluorescent intensity (MFI) of LDAM marker CD63 within the microglial population (normalized to the mode). F Quantitation of the percent microglia expressing the DAM phenotype markers (CD11chighCLEC7Ahigh) as gated in panel (B). G Quantitation of the percent homeostatic microglia (P2RY12+CLEC7A) as gated in panel (C). H Quantitation of the MFI for IRM marker CD317. I Quantitation of the MFI for LDAM marker CD63. Strip plot bars represent mean with SEM. Statistics were calculated with mixed-effect model matched by age and collection date (main/interactive effects #p < 0.05, ##p < 0.01, ###p < 0.001, Sidak’s MTC, *p < 0.05, **p < 0.01, ***p < 0.001)
Fig. 7
Fig. 7
Pathway analysis of sex effects in the hippocampal microglial transcriptome and translatome. A Heatmap of z-scores for IPA canonical pathways, diseases and bio functions, and upstream regulators analyses. B IPA upstream regulator comparison to assess sex effects in old hippocampal microglia. C Network topology-based analysis (PPI BIOGRID) of the 19 genes that were more highly expressed in old female microglia compared to old males (Fig. 5A) in both the transcriptome and translatome. D, E Cdkn2a transcript analysis for p19ARF and p16INK4A in the D transcriptome and E translatome of hippocampal microglia. F Heatmap of SASP gene expression (CPM). G IPA upstream regulator analysis to identify drug regulators of sex differences

Update of

Similar articles

Cited by

References

    1. Klein SL, Flanagan KL. Sex differences in immune responses. Nat Rev Immunol. 2016;16(10):626–638. - PubMed
    1. Franceschi C, Campisi J. chronic inflammation (inflammaging) and its potential contribution to age-associated diseases. J Gerontol Ser A. 2014;69(Suppl_1):S4–S9. - PubMed
    1. Hammond TR, Dufort C, Dissing-Olesen L, Giera S, Young A, Wysoker A, et al. Single-cell RNA sequencing of microglia throughout the mouse lifespan and in the injured brain reveals complex cell-state changes. Immunity. 2019;50(1):253–71.e6. - PMC - PubMed
    1. Mangold CA, Masser DR, Stanford DR, Bixler GV, Pisupati A, Giles CB, et al. CNS-wide sexually dimorphic induction of the major histocompatibility complex 1 pathway with aging. J Gerontol A Biol Sci Med Sci. 2017;72(1):16–29. - PMC - PubMed
    1. Mangold CA, Wronowski B, Du M, Masser DR, Hadad N, Bixler GV, et al. Sexually divergent induction of microglial-associated neuroinflammation with hippocampal aging. J Neuroinflamm. 2017;14(1):141. - PMC - PubMed