. 2023 Sep 15;29(18):3793-3812.
doi: 10.1158/1078-0432.CCR-23-0547.

Lorazepam Stimulates IL6 Production and Is Associated with Poor Survival Outcomes in Pancreatic Cancer

Affiliations

Lorazepam Stimulates IL6 Production and Is Associated with Poor Survival Outcomes in Pancreatic Cancer

Abigail C Cornwell et al. Clin Cancer Res. .

Abstract

Purpose: This research investigates the association between benzodiazepines (BZD) and cancer patient survival outcomes, the pancreatic cancer tumor microenvironment, and cancer-associated fibroblast (CAF) signaling.

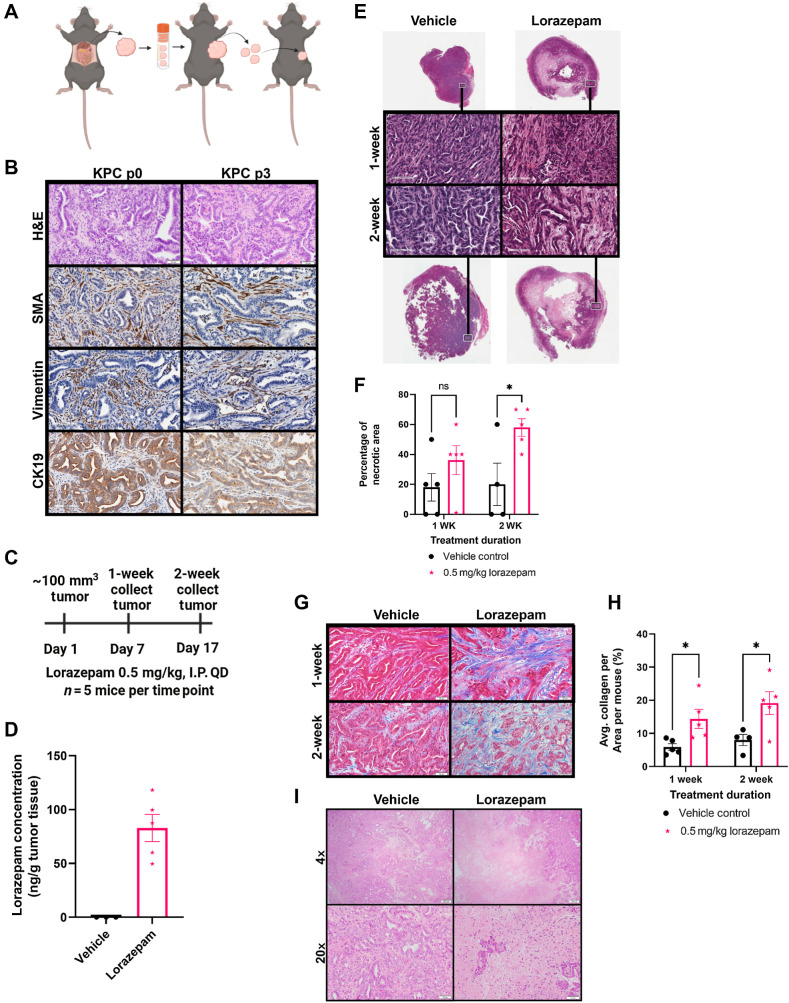
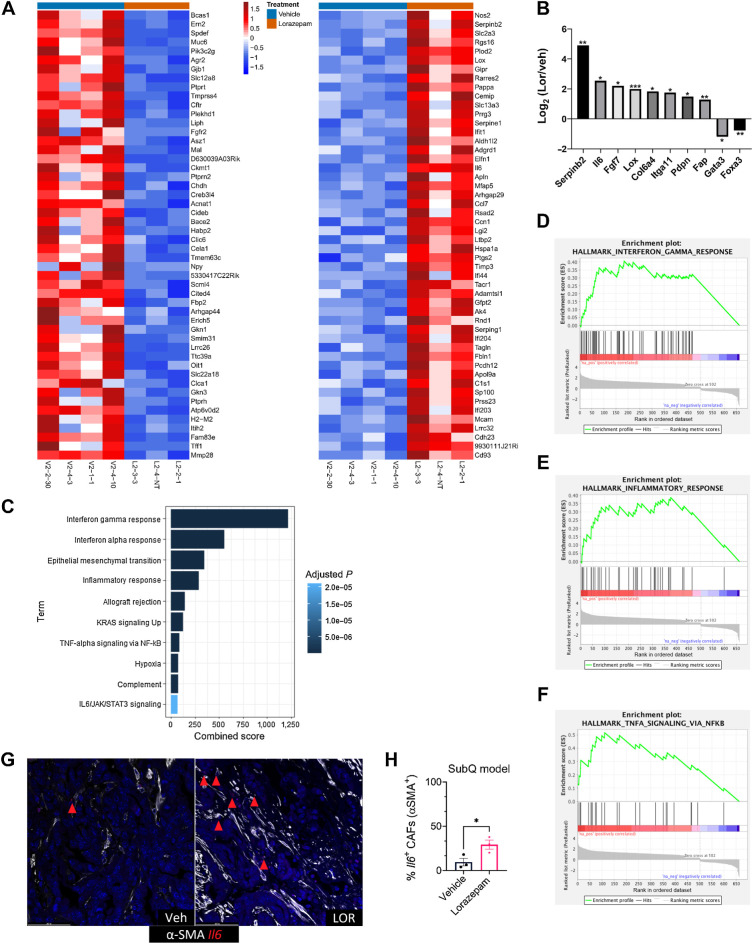
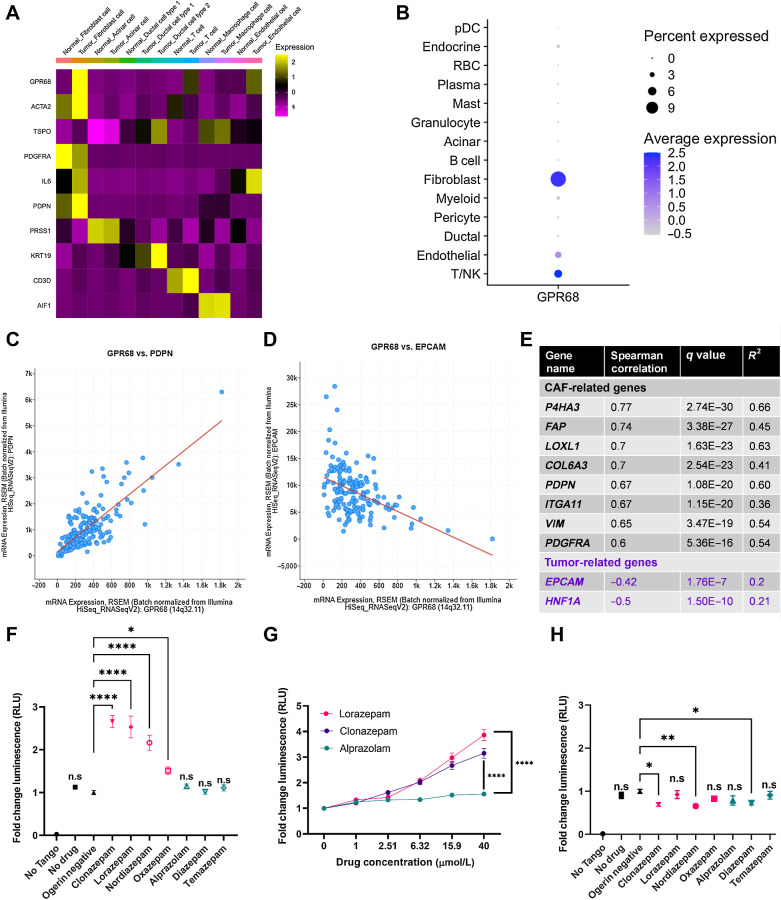
Experimental design: Multivariate Cox regression modeling was used to retrospectively measure associations between Roswell Park cancer patient survival outcomes and BZD prescription records. IHC, H&E, Masson's trichrome, RNAscope, and RNA sequencing were used to evaluate the impact of lorazepam (LOR) on the murine PDAC tumor microenvironment. ELISA and qPCR were used to determine the impact of BZDs on IL6 expression or secretion by human-immortalized pancreatic CAFs. PRESTO-Tango assays, reanalysis of PDAC single-cell sequencing/TCGA data sets, and GPR68 CRISPRi knockdown CAFs were used to determine the impact of BZDs on GPR68 signaling.

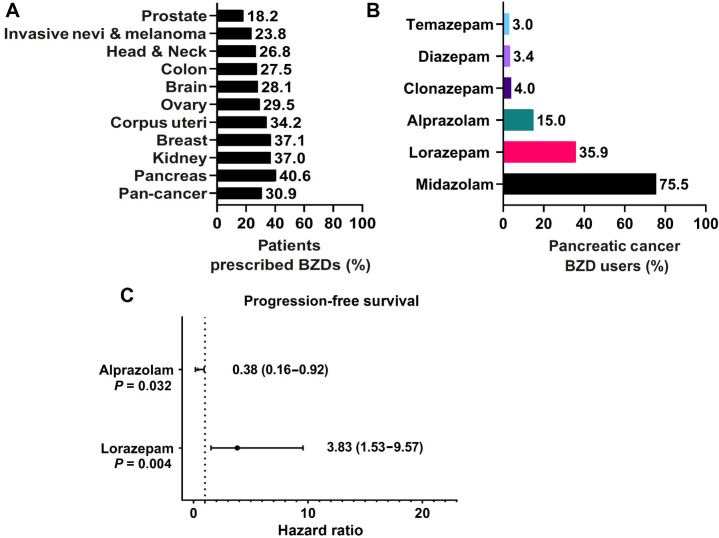
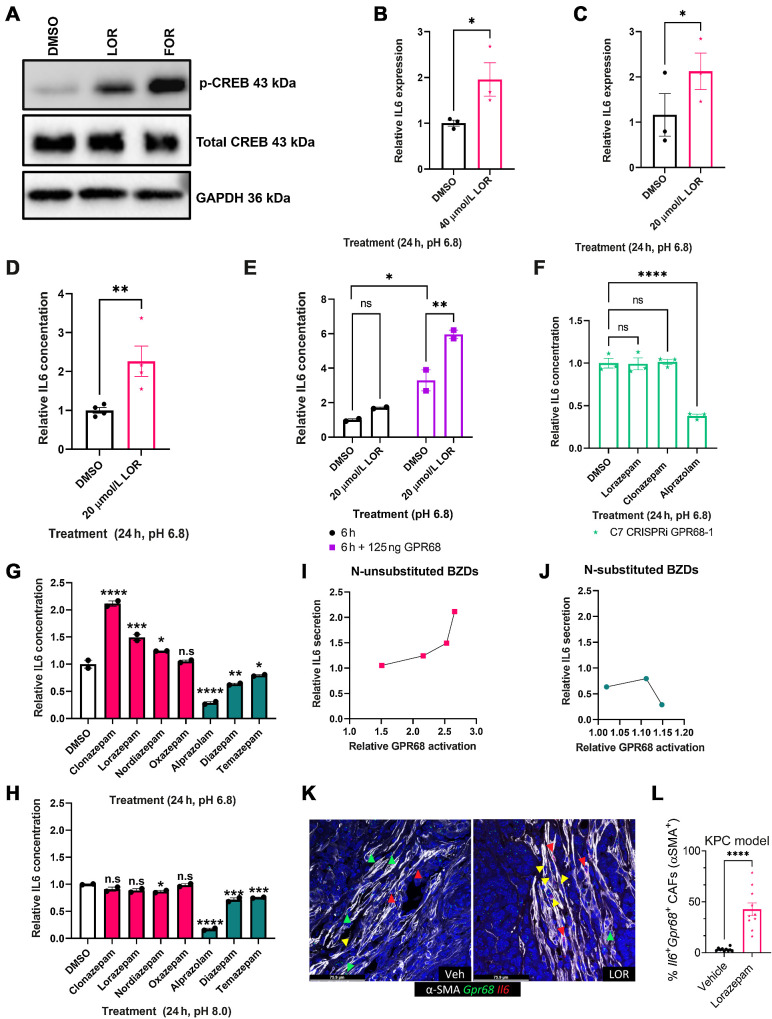
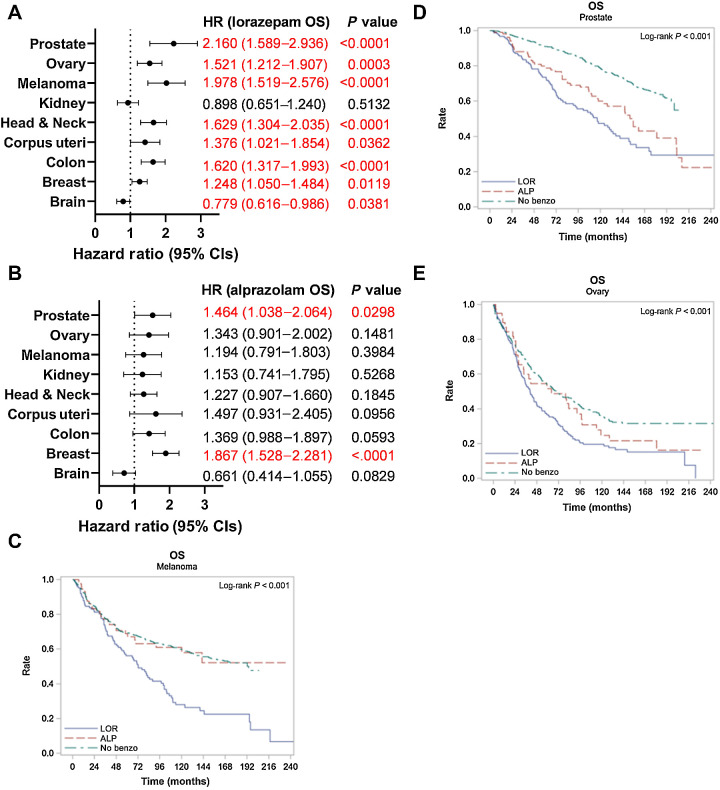
Results: LOR is associated with worse progression-free survival (PFS), whereas alprazolam (ALP) is associated with improved PFS, in pancreatic cancer patients receiving chemotherapy. LOR promotes desmoplasia (fibrosis and extracellular matrix protein deposition), inflammatory signaling, and ischemic necrosis. GPR68 is preferentially expressed on human PDAC CAFs, and n-unsubstituted BZDs, such as LOR, significantly increase IL6 expression and secretion in CAFs in a pH and GPR68-dependent manner. Conversely, ALP and other GPR68 n-substituted BZDs decrease IL6 in human CAFs in a pH and GPR68-independent manner. Across many cancer types, LOR is associated with worse survival outcomes relative to ALP and patients not receiving BZDs.

Conclusions: We demonstrate that LOR stimulates fibrosis and inflammatory signaling, promotes desmoplasia and ischemic necrosis, and is associated with decreased pancreatic cancer patient survival.


Figures

Figure 1. Lorazepam is associated with poor survival outcomes in pancreatic cancer patients. A, Percentage of Roswell Park patients with a prescription record of benzodiazepines (BZDs) by cancer type. B, Percentage of pancreatic cancer patients prescribed BZDs who are receiving the top six most commonly prescribed BZDs. C, Covariate-adjusted analysis evaluating the impact of lorazepam (n = 40) or alprazolam (n = 27) prescription records on pancreatic cancer patient PFS, accounting for age, sex, race, clinical stage, additional treatments, and progressive disease relative to no lorazepam (n = 29) or no alprazolam (n = 42). Pan-cancer analysis refers to the combined average of all cancer types in the nSight database. Statistics: To account for potential imbalances in patient demographic and clinical characteristics, multivariable Cox regression models were used to evaluate the association between group (i.e., BZD usage) and the survival outcomes while adjusting for age, sex, race, clinical stage, and additional treatments. Hazard ratios for BZD, with 95% confidence intervals, were obtained from model estimates. All analyses were conducted in SAS v9.4 at a significance level of 0.05.
Figure 1.
Lorazepam is associated with poor survival outcomes in pancreatic cancer patients. A, Percentage of Roswell Park patients with a prescription record of benzodiazepines (BZDs) by cancer type. B, Percentage of pancreatic cancer patients prescribed BZDs who are receiving the top six most commonly prescribed BZDs. C, Covariate-adjusted analysis evaluating the impact of lorazepam (n = 40) or alprazolam (n = 27) prescription records on pancreatic cancer patient PFS, accounting for age, sex, race, clinical stage, additional treatments, and progressive disease relative to no lorazepam (n = 29) or no alprazolam (n = 42). Pan-cancer analysis refers to the combined average of all cancer types in the nSight database. Statistics: To account for potential imbalances in patient demographic and clinical characteristics, multivariable Cox regression models were used to evaluate the association between group (i.e., BZD usage) and the survival outcomes while adjusting for age, sex, race, clinical stage, and additional treatments. Hazard ratios for BZD, with 95% confidence intervals, were obtained from model estimates. All analyses were conducted in SAS v9.4 at a significance level of 0.05.
Figure 2. Lorazepam promotes ischemic necrosis and desmoplasia in murine PDAC tumors. A, Schematic of subcutaneous LSL-KrasG12D/+; LSL-Trp53R172H/+; Pdx-1-Cre (KPC) syngeneic allograft model generation. B, Comparison (top to bottom) of H&E (20×), α-SMA IHC (20×), vimentin IHC (20×), and CK19 IHC (20×) in the KPC spontaneous tumor (left) and the p3 KPC syngeneic allograft derived from the KPC spontaneous tumor (right). C, Experimental schematic of short-term LOR (n = 5/arm) or vehicle treatment (n = 4–5/arm). D, Scatter plot with bar (mean with SEM) of LOR concentration per mouse quantified by liquid chromatography–mass spectroscopy (LC-MS) in the 2-week LOR (n = 5) or vehicle (n = 3) treated subcutaneous KPC syngeneic allograft tumors collected 2 hours post-dosing. E, Representative Aperio scanned H&E section of 1-week (top) and 2-week (bottom) vehicle (left) and LOR (right) treated mice, representative zoomed-in 20× images (black and white box) of 1-week (second row) and 2-week (third row) vehicle (left) and LOR (right) treated mice. F, Quantification of the percentage of necrotic area per slide. G, Representative 20× Masson's trichrome images of 1-week (top) and 2-week (bottom) treated mice. H, Quantification of the percentage of collagen per area. ImageJ (ImageJ, RRID: SCR_003070) color deconvolution plugin was used to quantify collagen area/20× field of 5 randomly selected images per mouse in a blinded manner. I, Representative 4× (top) and 20× (bottom) H&E image of KPC spontaneous tumors treated with 0.5 mg/kg vehicle (left) or LOR (right) for 2 weeks (n = 2–3/arm). Statistics: Groups were compared by mixed-effects analysis with Bonferroni's multiple comparison test, black = vehicle, pink = 0.5 mg/kg LOR.
Figure 2.
Lorazepam promotes ischemic necrosis and desmoplasia in murine PDAC tumors. A, Schematic of subcutaneous LSL-KrasG12D/+; LSL-Trp53R172H/+; Pdx-1-Cre (KPC) syngeneic allograft model generation. B, Comparison (top to bottom) of H&E (20×), α-SMA IHC (20×), vimentin IHC (20×), and CK19 IHC (20×) in the KPC spontaneous tumor (left) and the p3 KPC syngeneic allograft derived from the KPC spontaneous tumor (right). C, Experimental schematic of short-term LOR (n = 5/arm) or vehicle treatment (n = 4–5/arm). D, Scatter plot with bar (mean with SEM) of LOR concentration per mouse quantified by liquid chromatography–mass spectroscopy (LC-MS) in the 2-week LOR (n = 5) or vehicle (n = 3) treated subcutaneous KPC syngeneic allograft tumors collected 2 hours post-dosing. E, Representative Aperio scanned H&E section of 1-week (top) and 2-week (bottom) vehicle (left) and LOR (right) treated mice, representative zoomed-in 20× images (black and white box) of 1-week (second row) and 2-week (third row) vehicle (left) and LOR (right) treated mice. F, Quantification of the percentage of necrotic area per slide. G, Representative 20× Masson's trichrome images of 1-week (top) and 2-week (bottom) treated mice. H, Quantification of the percentage of collagen per area. ImageJ (ImageJ, RRID: SCR_003070) color deconvolution plugin was used to quantify collagen area/20× field of 5 randomly selected images per mouse in a blinded manner. I, Representative 4× (top) and 20× (bottom) H&E image of KPC spontaneous tumors treated with 0.5 mg/kg vehicle (left) or LOR (right) for 2 weeks (n = 2–3/arm). Statistics: Groups were compared by mixed-effects analysis with Bonferroni's multiple comparison test, black = vehicle, pink = 0.5 mg/kg LOR.
Figure 3. Lorazepam promotes inflammatory response and extracellular matrix signature in PDAC tumors. A, Heat map of top 50 downregulated (left) and upregulated (right) genes in the 2-week LOR-treated (orange bar) subcutaneously implanted KPC tumors relative to the vehicle-treated (blue bar) tumors. B, Differentially expressed extracellular matrix–related genes and epithelial genes in the 2-week LOR-treated mice relative to the vehicle-treated mice. Statistics: adjusted P-value of log2 fold change of LOR/VEH. C, Enrichr combined scores of the top 10 enriched KEGG terms in the 2-week LOR-treated tumors relative to vehicle. D–F, Enrichment plots of (D) Hallmark_Interferon_Gamma_Response (adjusted P = 2.23E−36) and (E) Hallmark_Inflammatory Response (adjusted P = 1.98E−16), and (F) Hallmark_TNFA_Signaling_via_NFKB (adjusted P = 5.57E−08). G, Representative 40 P = RNAscope images of IL6+/SMA+ cells in the 2-week treated vehicle (left) and LOR-treated subcutaneously implanted KPC tumors (n = 3/arm). H, Quantification of G.
Figure 3.
Lorazepam promotes inflammatory response and extracellular matrix signature in PDAC tumors. A, Heat map of top 50 downregulated (left) and upregulated (right) genes in the 2-week LOR-treated (orange bar) subcutaneously implanted KPC tumors relative to the vehicle-treated (blue bar) tumors. B, Differentially expressed extracellular matrix–related genes and epithelial genes in the 2-week LOR-treated mice relative to the vehicle-treated mice. Statistics: adjusted P-value of log2 fold change of LOR/VEH. C, Enrichr combined scores of the top 10 enriched KEGG terms in the 2-week LOR-treated tumors relative to vehicle. D–F, Enrichment plots of (D) Hallmark_Interferon_Gamma_Response (adjusted P = 2.23E−36) and (E) Hallmark_Inflammatory Response (adjusted P = 1.98E−16), and (F) Hallmark_TNFA_Signaling_via_NFKB (adjusted P = 5.57E−08). G, Representative 40 P = RNAscope images of IL6+/SMA+ cells in the 2-week treated vehicle (left) and LOR-treated subcutaneously implanted KPC tumors (n = 3/arm). H, Quantification of G.
Figure 4. N-unsubstituted benzodiazepines potentiate activation of GPR68, a receptor preferentially expressed on human PDAC CAFs. A, Heat map of GPR68 and TSPO expression by cell type from the Peng et al (22) human pancreatic ductal adenocarcinoma tumor single-cell sequencing data set. Yellow represents upregulated gene expression relative to other cell types within a row. B, Dot plot visualization of GPR68 gene expression level (color intensity) and frequency (size of dot) in different cell populations of human PDAC samples from Steele et al (25). C and D, Correlation plot of (C) GPR68 and PDPN, and (D) GPR68 and EPCAM in the human PDAC Pan-Cancer Atlas (TCGA data set). E, Summary table of the Spearman correlation of CAF-related genes with GPR68 in the human PDAC Pan-Cancer Atlas (TCGA data set). F–H, PRESTO-Tango Assay for GPR68 activation (F) pH 6.8 BZD screen; (G) pH 6.8 dose-response curve for LOR, CLZ, and ALP; and (H) pH 7.4 BZD screen. Each plot represents the normalized average of 2–3 biological replicates. Statistics: BZD screens were analyzed by ordinary one-way ANOVA with Dunnett multiple comparison test, and dose–response curves were analyzed by two-way ANOVA with Holm–Šídák multiple comparisons test.
Figure 4.
N-unsubstituted benzodiazepines potentiate activation of GPR68, a receptor preferentially expressed on human PDAC CAFs. A, Heat map of GPR68 and TSPO expression by cell type from the Peng et al (22) human pancreatic ductal adenocarcinoma tumor single-cell sequencing data set. Yellow represents upregulated gene expression relative to other cell types within a row. B, Dot plot visualization of GPR68 gene expression level (color intensity) and frequency (size of dot) in different cell populations of human PDAC samples from Steele et al (25). C and D, Correlation plot of (C) GPR68 and PDPN, and (D) GPR68 and EPCAM in the human PDAC Pan-Cancer Atlas (TCGA data set). E, Summary table of the Spearman correlation of CAF-related genes with GPR68 in the human PDAC Pan-Cancer Atlas (TCGA data set). F–H, PRESTO-Tango Assay for GPR68 activation (F) pH 6.8 BZD screen; (G) pH 6.8 dose-response curve for LOR, CLZ, and ALP; and (H) pH 7.4 BZD screen. Each plot represents the normalized average of 2–3 biological replicates. Statistics: BZD screens were analyzed by ordinary one-way ANOVA with Dunnett multiple comparison test, and dose–response curves were analyzed by two-way ANOVA with Holm–Šídák multiple comparisons test.
Figure 5. Lorazepam increases IL6 secretion by human PDAC CAFs in a GPR68-dependent manner. A, Western blot of immortalized human PDAC CAFs treated with LOR or forskolin (positive control) at pH 6.8 for 3 hours. B, Il6 qPCR of immortalized human PDAC CAFs treated with 40 μmol/L LOR at pH 6.8 for 24 hours. C, Il6 qPCR of primary human PDAC CAFs treated with 20 μmol/L LOR at pH 6.8 for 24 hours. D, IL6 ELISA of conditioned media from immortalized human PDAC CAFs treated with BZDs (20 μmol/L) or DMSO control for 24 hours at pH 6.8. E, IL6 ELISA of conditioned media from immortalized human PDAC CAFs treated with 20 μmol/L LOR or DMSO control for 6 hours in the presence or absence of GPR68 overexpression. F, IL6 ELISA of GPR68 knockdown immortalized human PDAC CAFs treated with LOR, CLZ, ALP, or DMSO control for 24 hours at pH 6.8. G–H, IL6 ELISA of conditioned media from immortalized human PDAC CAFs treated with BZDs (20 μmol/L) or DMSO control for 24 hours at (G) pH 6.8 or (H) pH 8.0. Pink represents n-unsubstituted BZDs, teal represents n-substituted BZDs. I and J, Correlation plot of relative GPR68 activation of each BZD by PRESTO-Tango relative to IL6 secretion by IL6 ELISA for (I) n-unsubstituted BZDs and (J) n-substituted BZDs at pH 6.8. K, Representative 40× RNAscope images of IL6+/GPR68+/SMA+ cells in the 2-week treated vehicle (left) and LOR-treated KPC tumors. L, Quantification of K. All experiments are representative of 2–4 biological replicates. Statistics: To analyze two groups, paired/unpaired one-tailed t tests were performed. For the analysis of multiple groups, we performed ordinary one-way ANOVA with Bonferroni multiple comparison test. In the case of multiple groups with two independent variables, groups were compared by two-way ANOVA with Holm–Šídák multiple comparisons test.
Figure 5.
Lorazepam increases IL6 secretion by human PDAC CAFs in a GPR68-dependent manner. A, Western blot of immortalized human PDAC CAFs treated with LOR or forskolin (positive control) at pH 6.8 for 3 hours. B,Il6 qPCR of immortalized human PDAC CAFs treated with 40 μmol/L LOR at pH 6.8 for 24 hours. C,Il6 qPCR of primary human PDAC CAFs treated with 20 μmol/L LOR at pH 6.8 for 24 hours. D, IL6 ELISA of conditioned media from immortalized human PDAC CAFs treated with BZDs (20 μmol/L) or DMSO control for 24 hours at pH 6.8. E, IL6 ELISA of conditioned media from immortalized human PDAC CAFs treated with 20 μmol/L LOR or DMSO control for 6 hours in the presence or absence of GPR68 overexpression. F, IL6 ELISA of GPR68 knockdown immortalized human PDAC CAFs treated with LOR, CLZ, ALP, or DMSO control for 24 hours at pH 6.8. G–H, IL6 ELISA of conditioned media from immortalized human PDAC CAFs treated with BZDs (20 μmol/L) or DMSO control for 24 hours at (G) pH 6.8 or (H) pH 8.0. Pink represents n-unsubstituted BZDs, teal represents n-substituted BZDs. I and J, Correlation plot of relative GPR68 activation of each BZD by PRESTO-Tango relative to IL6 secretion by IL6 ELISA for (I) n-unsubstituted BZDs and (J) n-substituted BZDs at pH 6.8. K, Representative 40× RNAscope images of IL6+/GPR68+/SMA+ cells in the 2-week treated vehicle (left) and LOR-treated KPC tumors. L, Quantification of K. All experiments are representative of 2–4 biological replicates. Statistics: To analyze two groups, paired/unpaired one-tailed t tests were performed. For the analysis of multiple groups, we performed ordinary one-way ANOVA with Bonferroni multiple comparison test. In the case of multiple groups with two independent variables, groups were compared by two-way ANOVA with Holm–Šídák multiple comparisons test.
Figure 6. Lorazepam is associated with worse patient survival across multiple cancer types. A and B, Association between prescription or infusion records of (A) LOR or (B) ALP and OS by cancer type in Roswell Park patients with a diagnostic date from 2000 to 2022; significant values are highlighted in red. C–E, Kaplan–Meier curve comparing OS in Roswell Park patients with prescription or infusion records of LOR or ALP, or those with no history of BZD use treated for primary (C) invasive nevi or melanoma, (D) prostate cancer, or (E) ovarian cancer. Statistics: Multivariate Cox regression modeling was performed to measure associations between survival outcomes and cohort. Models were adjusted for sex (where applicable), clinical grade, and clinical stage. HR and corresponding 95% CIs were provided for individual LOR and ALP groups, with “No Benzo” as the referent group. Type 3 test was used, and an overall P value measuring the association between survival and cohort was provided. CI, confidence interval; HR, hazard ratio; OS, overall survival.
Figure 6.
Lorazepam is associated with worse patient survival across multiple cancer types. A and B, Association between prescription or infusion records of (A) LOR or (B) ALP and OS by cancer type in Roswell Park patients with a diagnostic date from 2000 to 2022; significant values are highlighted in red. C–E, Kaplan–Meier curve comparing OS in Roswell Park patients with prescription or infusion records of LOR or ALP, or those with no history of BZD use treated for primary (C) invasive nevi or melanoma, (D) prostate cancer, or (E) ovarian cancer. Statistics: Multivariate Cox regression modeling was performed to measure associations between survival outcomes and cohort. Models were adjusted for sex (where applicable), clinical grade, and clinical stage. HR and corresponding 95% CIs were provided for individual LOR and ALP groups, with “No Benzo” as the referent group. Type 3 test was used, and an overall P value measuring the association between survival and cohort was provided. CI, confidence interval; HR, hazard ratio; OS, overall survival.

Comment in

References

    1. SEER*Explorer: an interactive website for SEER cancer statistics, National Cancer Institute [Internet]. 2022. Available from:https://seer.cancer.gov/statistics-network/explorer/application.html.
    1. Rahib L, Smith BD, Aizenberg R, Rosenzweig AB, Fleshman JM, Matrisian LM. Projecting cancer incidence and deaths to 2030: the unexpected burden of thyroid, liver, and pancreas cancers in the United States. Cancer Res 2014;74:2913–21. - PubMed
    1. Sarantis P, Koustas E, Papadimitropoulou A, Papavassiliou AG, Karamouzis MV. Pancreatic ductal adenocarcinoma: treatment hurdles, tumor microenvironment and immunotherapy. World J Gastrointest Oncol 2020;12:173. - PMC - PubMed
    1. Wu YA, Oba A, Lin R, Watanabe S, Meguid C, Schulick RD, et al. . Selecting surgical candidates with locally advanced pancreatic cancer: a review for modern pancreatology. J Gastrointest Oncol 2021;12:2475. - PMC - PubMed
    1. Hwang RF, Moore T, Arumugam T, Ramachandran V, Amos KD, Rivera A, et al. . Cancer-associated stromal fibroblasts promote pancreatic tumor progression. Cancer Res 2008;68:918–26. - PMC - PubMed

Publication types