. 2023 May 22:5:e13.
doi: 10.1017/ehs.2023.9. eCollection 2023.

The making of the oral microbiome in Agta hunter-gatherers

Affiliations

The making of the oral microbiome in Agta hunter-gatherers

Begoña Dobon et al. Evol Hum Sci. .

Abstract

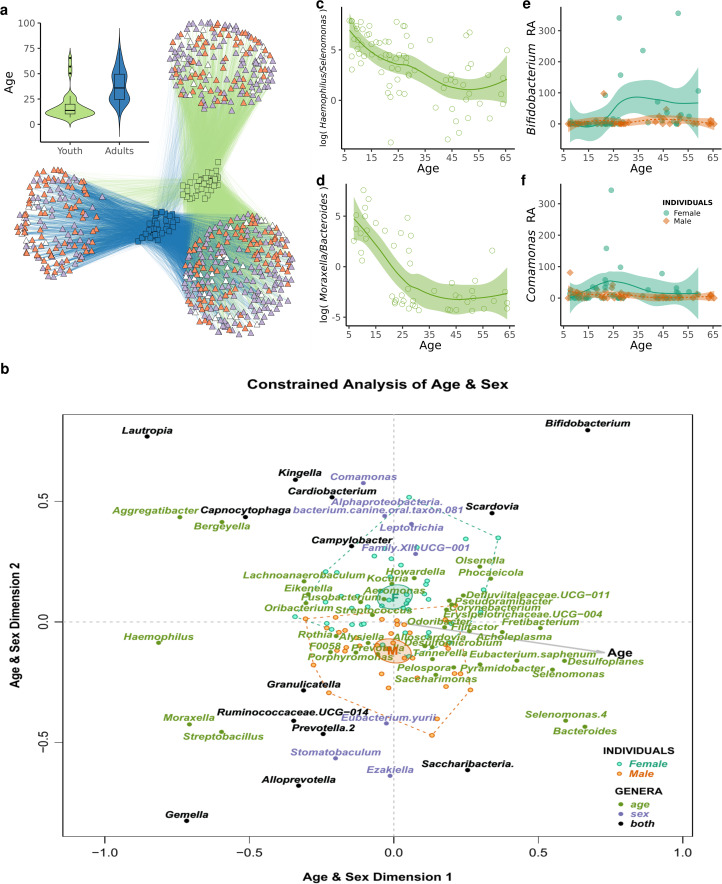
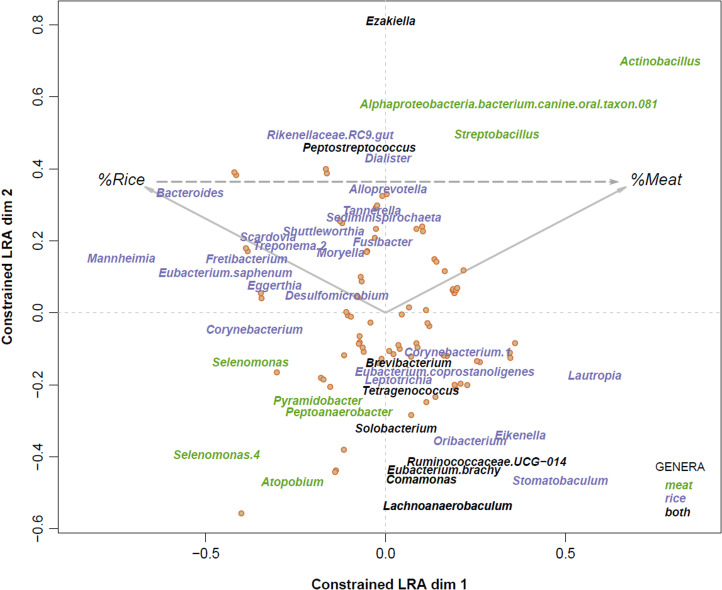
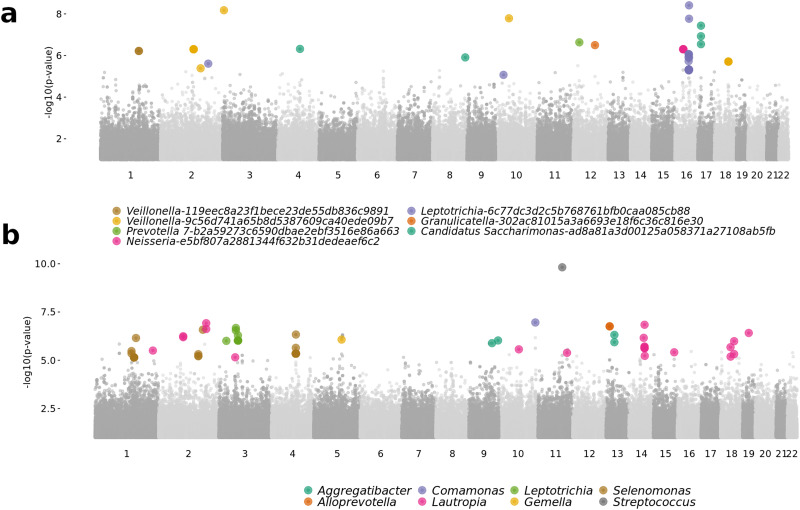
Ecological and genetic factors have influenced the composition of the human microbiome during our evolutionary history. We analysed the oral microbiota of the Agta, a hunter-gatherer population where some members have adopted an agricultural diet. We show that age is the strongest factor modulating the microbiome, probably through immunosenescence since we identified an increase in the number of species classified as pathogens with age. We also characterised biological and cultural processes generating sexual dimorphism in the oral microbiome. A small subset of oral bacteria is influenced by the host genome, linking host collagen genes to bacterial biofilm formation. Our data also suggest that shifting from a fish/meat diet to a rice-rich diet transforms their microbiome, mirroring the Neolithic transition. All of these factors have implications in the epidemiology of oral diseases. Thus, the human oral microbiome is multifactorial and shaped by various ecological and social factors that modify the oral environment.

Keywords: Neolithic transition; hunter–gatherers; oral microbiome; pathogen transmission.


Conflict of interest statement

The authors declare none.

Figures

None
Graphical abstract
Figure 1.
Figure 1.
Age- and sex-related effects in the hunter–gatherer oral microbiome. (a) Network representation of the hunter–gatherer core measurable microbiota (CMM). Amplicon sequence variants (ASVs; triangles) are colour-coded as putatively pathogenic (purple), non-pathogenic (orange) or unclassified (white). Inset shows age distribution for the two clusters of individuals (squares). (b) Log ratio analysis constrained to age and sex differences on the bacterial composition at genus level. The effects of diet were partialled out. Only genera statistically significant in at least 20 (for age) or 10 (for sex) log ratios are displayed (p-value < 0.05 after Benjamini–Hochberg correction). Dashed lines enclose all individuals (dots) within a sex, with 95% confidence ellipses for their means. Taxa are colour-coded depending on the associated variable: age, sex or both. The starting point of the grey arrow indicates the mean age of the population (30 years old). Log ratio of (c) Haemophilus and Selenomonas relative abundance and (d) Moraxella and Bacteroides according to age. Line and shaded area indicate the 95% confidence interval of the mean. Relative abundance of (e) Bifidobacterium and (f) Comamonas according to age and sex. Lines and shaded areas indicate the 95% confidence interval of the mean for each sex.
Figure 2.
Figure 2.
Effect of diet on the oral microbiome in the Agta. Log ratio analysis constrained to diet differences on bacterial composition at genus level. The effects of age and sex were partialled out. Only genera statistically significant in more than five (for rice) or three (for meat) log ratios are displayed (p-value < 0.05 after Benjamini–Hochberg correction). Taxa are colour-coded based on the variable they are associated with proportion of meals with meat (%Meat), proportion of meals with only rice (%Rice) or both. The original plot was slightly rotated without any change in explained variance, so that the dashed vector indicating the difference between %Meat and %Rice was horizontal.
Figure 3.
Figure 3.
Genome-wide association study of bacterial abundance. Aggregated Manhattan plot of the GWAS results of (a) seven ASV and (b) eight genera with non-zero PVE (‘chip heritability’) estimates with at least one significant genetic association. Each dot is a single nucleotide polymorphism (SNP), and significant SNP–bacteria associations (q < 0.1) are colour-coded.

Similar articles

Cited by

References

    1. Adler, C. J., Dobney, K., Weyrich, L. S., Kaidonis, J., Walker, A. W., Haak, W., … Cooper, A. (2013). Sequencing ancient calcified dental plaque shows changes in oral microbiota with dietary shifts of the Neolithic and Industrial revolutions. Nature Genetics, 45(4), 450–455. 10.1038/ng.2536 - DOI - PMC - PubMed
    1. Alexa, A. & Rahnenfuhrer, J. (2019). topGO: Enrichment Analysis for Gene Ontology. R package version 2.52.0.
    1. Auton, A., Abecasis, G. R., Altshuler, D., Durbin, R., Bentley, D., Chakravarti, A., … Schloss, J. A. (2015). A global reference for human genetic variation. Nature, 526(7571), 68–74. 10.1038/nature15393 - DOI - PMC - PubMed
    1. Bacanu, S. A., Devlin, B., & Roeder, K. (2000). The power of genomic control. American Journal of Human Genetics 66 (6), 1933–1944. - PMC - PubMed
    1. Bellussi, L., Passali, F. M., Ralli, M., De Vincentiis, M., Greco, A. V., & Passali, D. (2019). An overview on upper respiratory tract infections and bacteriotherapy as innovative therapeutic strategy. European Reviews on Medical and Pharmacological Science, 23, 27–38. 10.26355/eurrev_201903_17345 - DOI - PubMed

LinkOut - more resources