. 2023 Jul 31:14:1214098.
doi: 10.3389/fimmu.2023.1214098. eCollection 2023.

Effects of Atrazine exposure on human bone marrow-derived mesenchymal stromal cells assessed by combinatorial assay matrix

Affiliations

Effects of Atrazine exposure on human bone marrow-derived mesenchymal stromal cells assessed by combinatorial assay matrix

Crystal C Uwazie et al. Front Immunol. .

Abstract

Introduction: Mesenchymal Stromal/Stem cells (MSCs) are an essential component of the regenerative and immunoregulatory stem cell compartment of the human body and thus of major importance in human physiology. The MSCs elicit their beneficial properties through a multitude of complementary mechanisms, which makes it challenging to assess their phenotype and function in environmental toxicity screening. We here employed the novel combinatorial assays matrix approach/technology to profile the MSC response to the herbicide Atrazine, which is a common environmental xenobiotic, that is in widespread agricultural use in the US and other countries, but banned in the EU. Our here presented approach is representative for screening the impact of environmental xenobiotics and toxins on MSCs as an essential representative component of human physiology and well-being.

Methods: We here employed the combinatorial assay matrix approach, including a panel of well standardized assays, such as flow cytometry, multiplex secretome analysis, and metabolic assays, to define the phenotype and functionality of human-donor-derived primary MSCs exposed to the representative xenobiotic Atrazine. This assay matrix approach is now also endorsed for characterization of cell therapies by leading regulatory agencies, such as FDA and EMA.

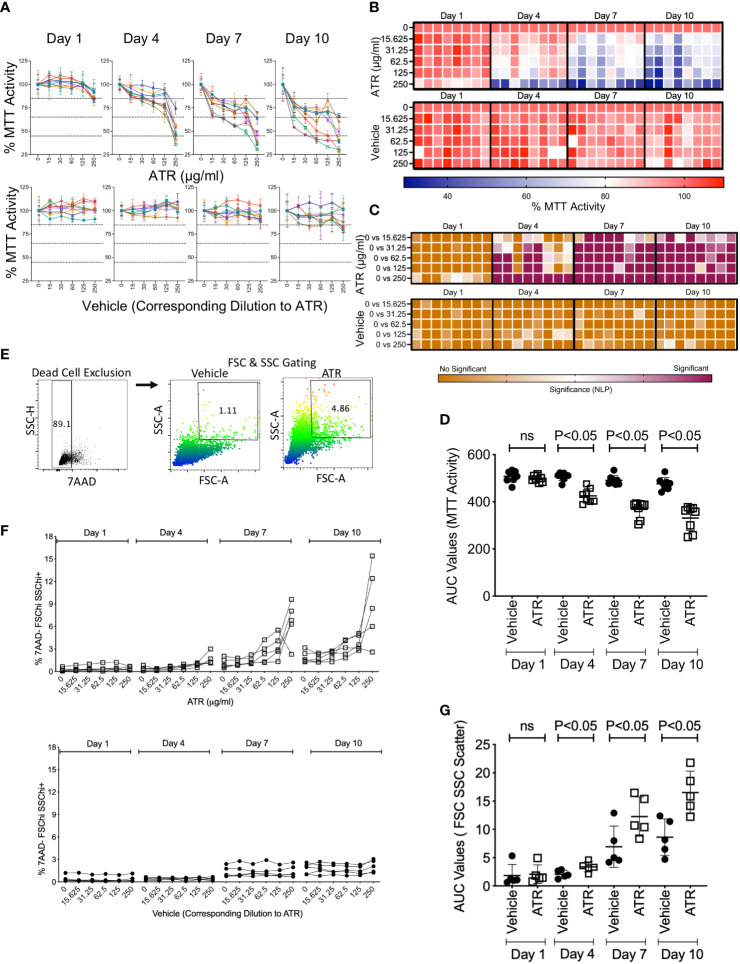
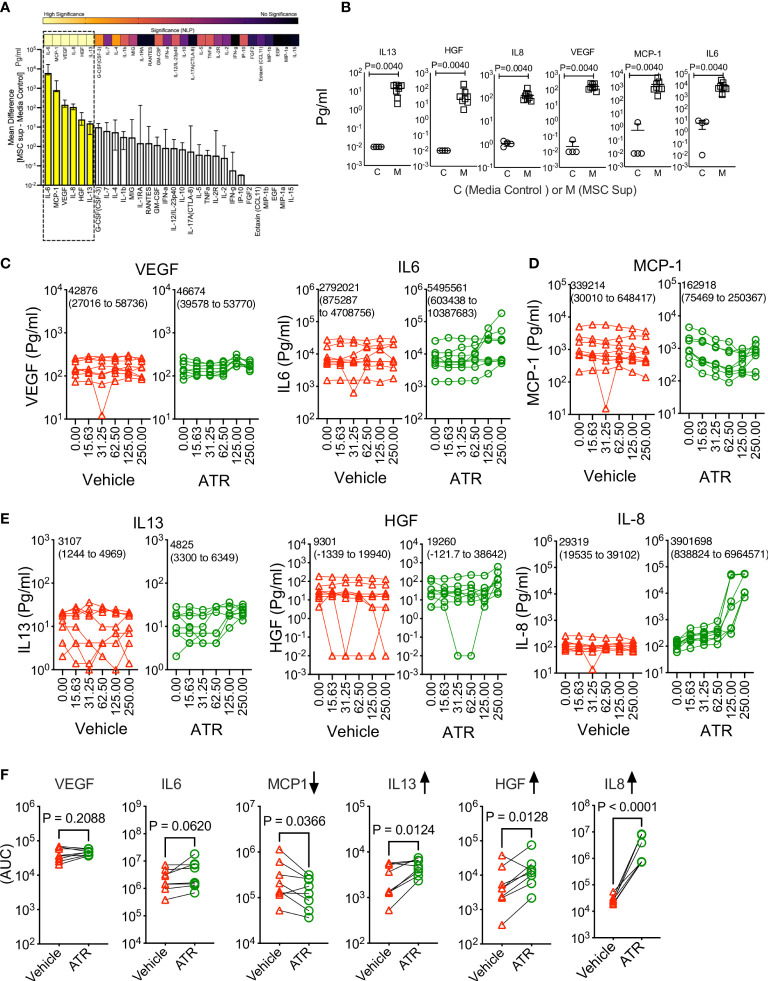
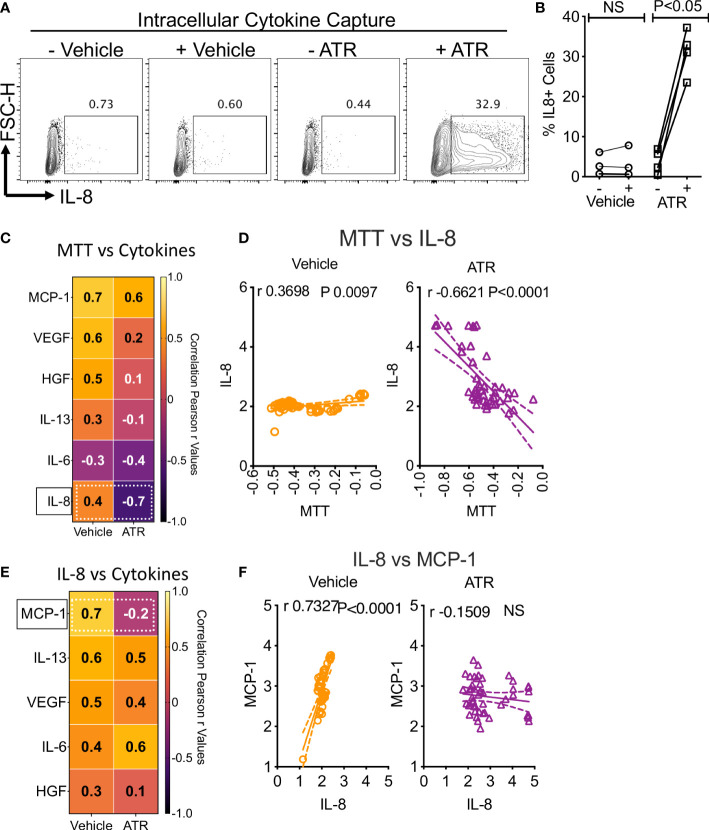
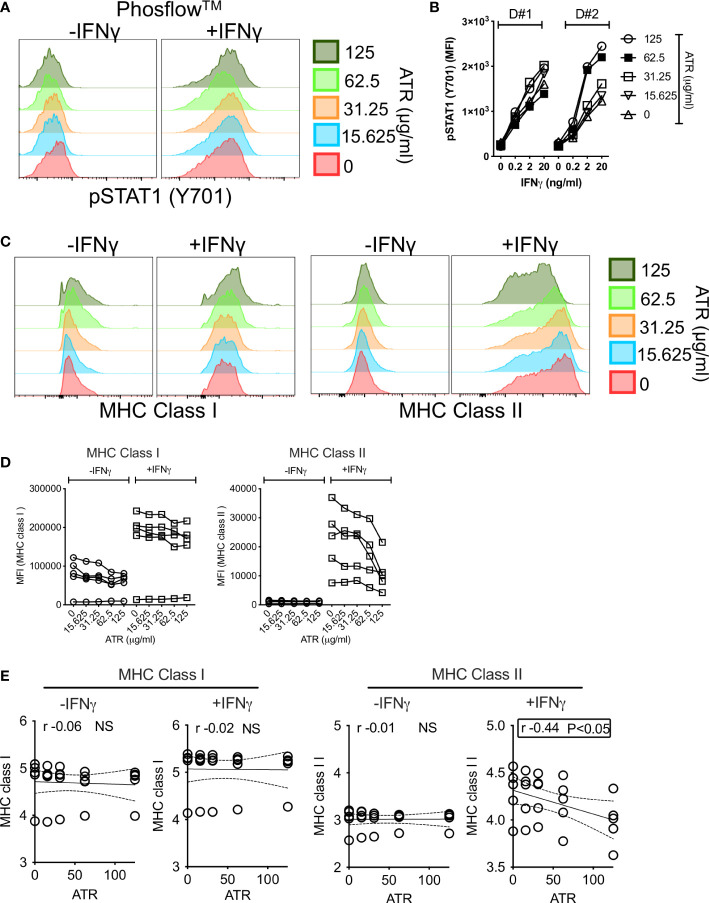
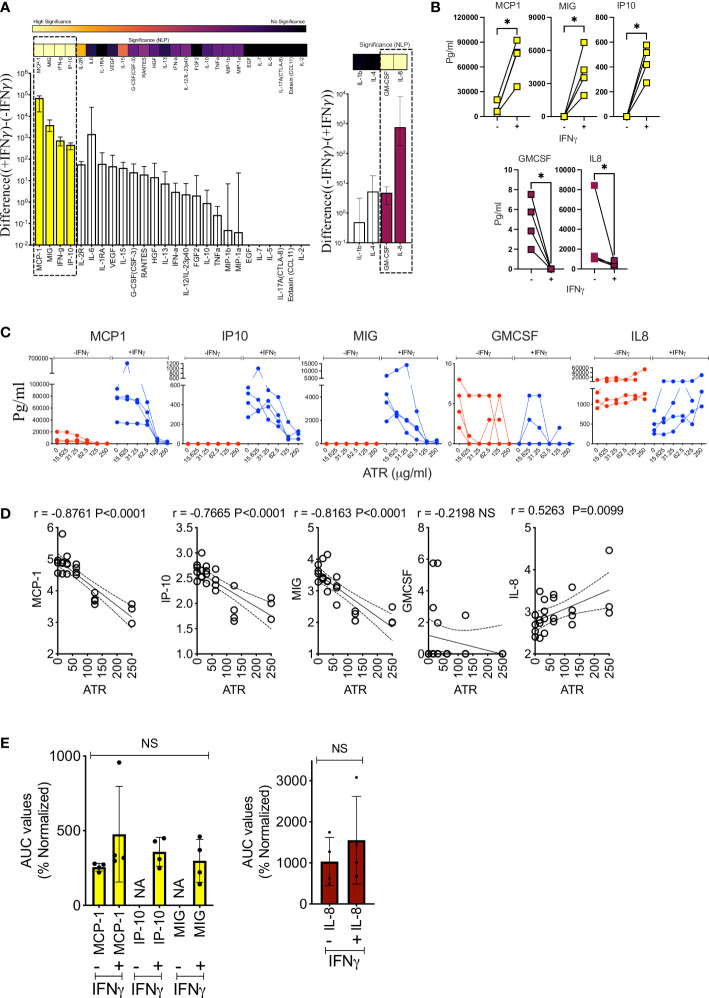
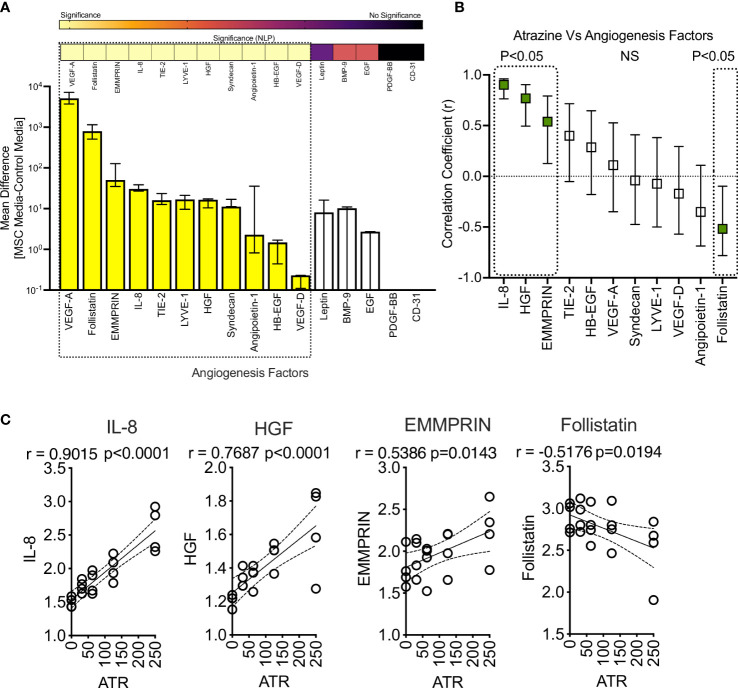
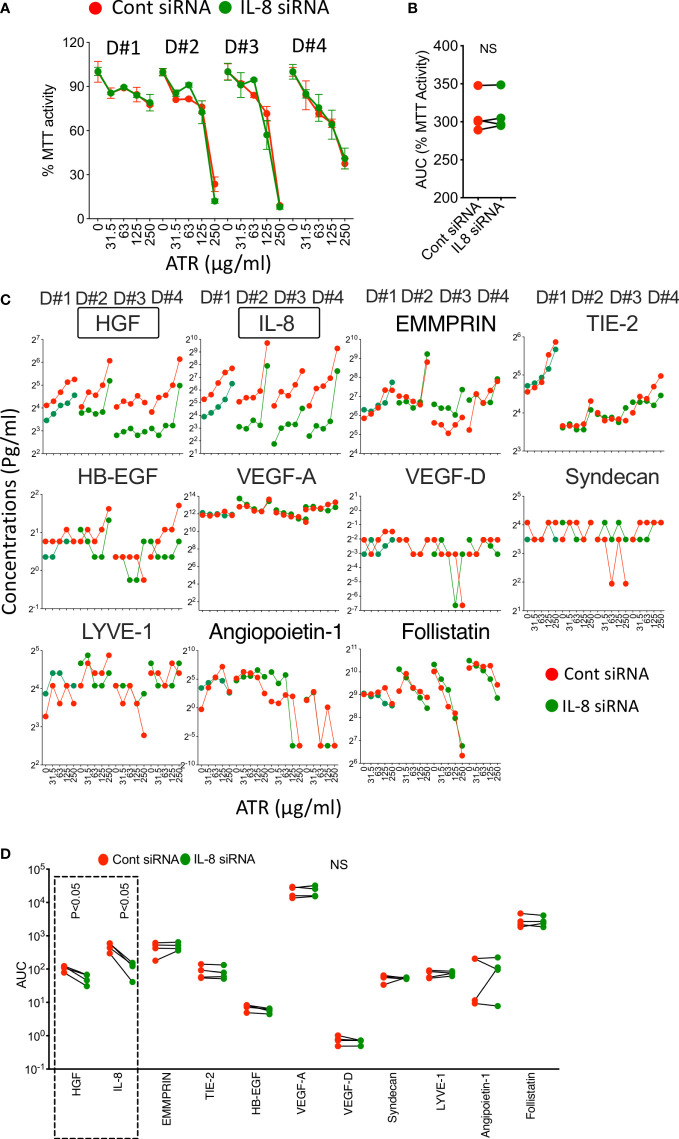
Results: Our results show that the exposure to Atrazine modulates the metabolic activity, size, and granularity of MSCs in a dose and time dependent manner. Intriguingly, Atrazine exposure leads to a broad modulation of the MSCs secretome (both upregulation and downmodulation of certain factors) with the identification of Interleukin-8 as the topmost upregulated representative secretory molecule. Interestingly, Atrazine attenuates IFNγ-induced upregulation of MHC-class-II, but not MHC-class-I, and early phosphorylation signals on MSCs. Furthermore, Atrazine exposure attenuates IFNγ responsive secretome of MSCs. Mechanistic knockdown analysis identified that the Atrazine-induced effector molecule Interleukin-8 affects only certain but not all the related angiogenic secretome of MSCs.

Discussion: The here described Combinatorial Assay Matrix Technology identified that Atrazine affects both the innate/resting and cytokine-induced/stimulated assay matrix functionality of human MSCs, as identified through the modulation of selective, but not all effector molecules, thus vouching for the great usefulness of this approach to study the impact of xenobiotics on this important human cellular subset involved in the regenerative healing responses in humans.

Keywords: cellular phenotype and function; combinatorial assay matrix technology; environmental herbicide atrazine; immunomodulation and regeneration; mesenchymal stromal/stem cells (MSCs).


Conflict of interest statement

The authors declare that the research was conducted in the absence of any commercial or financial relationships that could be construed as a potential conflict of interest.

Figures

Figure 1
Figure 1
Effect of dose and duration of Atrazine exposure on the metabolic activity and scatter profile of human MSCs. Human MSCs derived from eight independent donors were seeded in 96 well plate and treated with the indicated concentrations of Atrazine (μg/ml) or respective dilutions of the vehicle DMSO. MTT assay was performed longitudinally on the indicated days, and optical density was measured. Optical density values of individual donors at each time point without Atrazine/vehicle were normalized as 100 percent and values from other concentrations were calculated as percentage MTT activity. Dose dependent effect of Atrazine or vehicle on % MTT activity is shown longitudinally at the indicated time points using (A) spaghetti plots and (B) heat map. In the heat map, each cell denotes the individual MSC donor. Each spaghetti plot curve with unique color denotes distinct MSC donor. Means and standard deviations are derived from the triplicate wells of each donor at each concentration of Atrazine or Vehicle. (C) Statistical significance (Negative Logarithmic of P Values (NLP)) of the percentage MTT activity is shown as a heat map for the comparison of indicated conditions of Atrazine or vehicle for all the donors. Two-Way ANOVA multiple comparison test was performed to obtain the NLP values. (D) Area Under Curve (AUC) values were obtained from each curve with Atrazine or vehicle at the indicated time points and were plotted with mean and standard deviation. Atrazine or vehicle exposed MSCs from five independent donors were harvested at the indicated time points and were stained with 7AAD dye to exclude dead cells. Flow cytometry was performed to determine forward scatter and side scatter profiles. (E) Representative flow cytometry plot and gating strategy are shown. 7AAD- (live cells) were first gated, and subsequently Forward Scatter hi and Side Scatter Hi populations were gated to identify the percentage of 7AAD- FSCHiSSCHi+ populations. (F) Dose dependent effect of Atrazine or vehicle on % 7AAD-FSChiSSChi+ population is shown longitudinally at the indicated time points. (G) AUC values of % 7AAD-FSChiSSChi+ were obtained from each curve with Atrazine or vehicle at the indicated time points, and were plotted with mean and standard deviation.
Figure 2
Figure 2
Atrazine exposure on the innate secretory fitness of human MSCs. Human MSCs derived from eight independent donors were seeded in a 96 well plate and treated with the indicated concentrations of Atrazine (μg/ml) or respective dilutions of the vehicle DMSO. After seven days of culture, supernatants were collected and analyzed for 30-plex secretome using Luminex™ xMAP (multi-analyte profiling) technology. (A) MSCs’ innate secretome in the absence of Atrazine or vehicle is plotted with 30plex analysis. Secretory levels of each analyte from MSC cultures (MSC Supernatant) are subtracted from control media (without MSCs) and are plotted hierarchically based on their secretion levels. Statistical significance (Negative Logarithms of P value) of these secretions is also shown as a heat map. (B) Statistically significant secretory molecules of MSCs, derived from eight independent donors, are individually plotted. MSC Sup= MSC supernatant and Control=Control media without MSCs. (C–E) Dose dependent effect of Atrazine or vehicle on the statistically significant secretory molecules (B) are plotted. Mean AUC value derived from eight independent donors and the respective 95% confidence interval are shown within each plot. Secretory molecules are categorized as (C) unmodulated, (D) downregulated and (E) upregulated based on their response to Atrazine. (F) AUC values of individual secretory molecules, derived from the dose dependent curves of atrazine and vehicle, are plotted. Each pair of AUC values (Atrazine and vehicle) is derived from the individual donor MSCs. Paired t test analysis was performed to identify p values. Upregulated and downregulated secretory molecules are marked with appropriate arrow symbols.
Figure 3
Figure 3
Dynamics of Atrazine induced IL-8 on MSCs. Atrazine or vehicle exposed MSCs were treated with Golgi transport inhibitor to capture intracellular accumulation of IL-8. Intracellular cytokine staining was performed to identify IL-8 expression through flow cytometry. (A) Representative flow cytometry plot and gating are shown to identify IL-8 expression in Atrazine and vehicle treated cells. (B) Cumulative IL-8 expression with MSCs from four independent donors is shown with statistical significance. (C) Optical density values of MTT metabolic assays, derived from Atrazine and vehicle exposure conditions, were subjected to linear regression analysis with the levels of corresponding individual secretory molecules. Correlation coefficient (r) values are plotted as a heat map. The major shift from direct to inverse correlation of IL-8 and MTT metabolic activity in the conditions of vehicle and Atrazine is shown with the dotted line box. (D) Linear regression plots and statistical significance show the correlation between IL-8 secretion and MTT metabolic activity in vehicle and Atrazine exposure conditions. MTT assay values (optical density) and IL-8 concentrations (pg/ml) were transformed to logarithmic data to fit the regression line. (E) Quantitative levels of IL-8 were subjected to linear regression analysis with other secretory molecules derived from the same culture conditions with Atrazine or vehicle exposure. Correlation coefficient (r) values are plotted as a heat map. The major shift from direct to inverse correlation of IL-8 and MCP-1 in the conditions of vehicle and Atrazine is shown with the dotted line box. (F) Linear regression plots and statistical significance show the correlation between IL-8 and MCP-1 secretion in vehicle and atrazine exposure conditions. IL-8 and MCP-1 concentrations (pg/ml) were transformed to logarithmic data to fit the regression line. r values of 1 and -1 indicate the best direct and inverse correlations respectively, while 0 indicates no correlation.
Figure 4
Figure 4
Effect of Atrazine exposure on IFNγ induced early phosphorylation and downstream surface molecules on human MSCs. MSCs exposed with various concentrators of Atrazine were stimulated with IFNγ for 15 minutes. Phosflow technology was deployed to detect STAT1 phosphorylation (Y701) using flow cytometry. (A) Representative histogram overlay plots are shown for IFNγ induced pSTAT-1 expression on MSCs exposed with various concentrations of Atrazine. (B) Cumulative Mean Fluorescent Intensity (MFI) values of pSTAT-1 from two independent donor MSCs exposed to varying concentrations of Atrazine are shown. Indicated concentrations of IFNγ stimulation was performed in these conditions. (C) MSCs exposed to varying concentrations of Atrazine were stimulated with 0 or 20ng/ml IFNγ for 48 hours, subsequently stained with the antibodies to MHC Class I and MHC Class II surface markers, and acquired in flow cytometry. Representative histogram overlay plots are shown for MHC Class I and MHC Class II expression. (D) +/- IFNγ induced MFI values of MHC Class I and MHC Class II from five independent donor MSCs exposed to varying concentrations of Atrazine are cumulatively shown. (E) MFI values of MHC Class I and MHC Class II molecules were subjected to linear regression analysis with Atrazine exposure concentrations to identify their correlations. Statistically significant inverse correlation between IFNγ induced MHC Class II and Atrazine exposure is highlighted with the box.
Figure 5
Figure 5
Atrazine attenuates of IFNγ responsive secretome of human MSCs. MSCs derived from four independent donors were exposed to varying concentrations of Atrazine for ten days. After harvesting, cells were seeded with normalized density and subsequently stimulated with 0 or 20ng/ml IFNγ for 48 hours. Supernatants were analyzed for 30-plex secretome using Luminex™ xMAP (multi-analyte profiling) technology. (A) IFNγ responsive MSCs’ secretome in the absence of Atrazine or vehicle is plotted. Difference in the secretory levels of each analyte between + and - IFNγ stimulation is hierarchically plotted. Statistical significance (Negative Logarithms of P value) of difference in secretions also shown as a heat map. (B) Statistically significant up or downregulated secretory molecules upon IFNγ stimulation of MSCs, derived from four independent donors, are individually plotted. (C) Dose dependent effect of Atrazine exposure on statistically significant IFNγ responsive secretory molecules (B) are plotted. (D) IFNγ modulated secretion levels of MCP-1, IP10, MIG, GMCSF and IL-8 were subjected to linear regression analysis with Atrazine exposure concentrations to identify their correlations. Inverse and direct correlations between IFNγ induced molecules and Atrazine exposure are shown with correlation coefficient (r) values and statistically significance. (E) AUC values of MCP-1, IP10, MIG, GMCSF and IL-8 derived from Atrazine dose dependent curves were normalized. Percentage normalization was calculated based on the levels of these analytes without Atrazine. Upregulated analytes MCP-1, IP10, MIG and down regulated analytes IL-8 and GMCSF are separately plotted. Ordinary One-Way ANOVA multiple comparisons are performed to determine statistical significance. NS, No significance; NA, Not Applicable. *, P<0.05.
Figure 6
Figure 6
Effect of Atrazine exposure on angiogenic secretory factors of human MSCs. Human MSCs derived from four independent donors were seeded in a 96 well plate and treated with various concentrations of Atrazine. After seven days of culture, supernatants were collected and analyzed for 16-plex angiogenic secretory factors using Luminex™ xMAP (multi-analyte profiling) technology. (A) MSCs’ angiogenic secretory factors in the absence of Atrazine or vehicle is plotted. Secretory levels of each analyte from MSC cultures are subtracted from control media (without MSCs) and are plotted hierarchically based on their levels of secretion. Statistical significance (Negative Logarithms of P value) of these secretions also shown as a heat map. (B) Secretion levels of statistically significant angiogenic factors were subjected to linear regression analysis with Atrazine concentrations to identify their correlations. Hierarchical ranking of correlation coefficient (r) values with 95% confidence intervals for each angiogenic molecule is shown in the scale of -1 to + 1 which indicates the best inverse to direct correlations respectively. Statistically significant r values (P<0.05) are marked with dotted boxes. Non-Significant (NS) correlations are also shown. (C) Individual linear regression plots with statistical significance are shown for IL-8, HGF, EMMPRIN and Follistatin.
Figure 7
Figure 7
Role of Atrazine induced IL-8 on MSC’s metabolic activity and secretion of angiogenic factors. Control or IL-8 siRNA silenced human MSCs derived from four independent donors were subjected to Atrazine exposure for seven days. Supernatants were stored, and MTT assays were performed with the cells. (A) Dose dependent effect of Atrazine on % MTT activity is shown for each MSC donor (D#1, D#2, D#3, D#4). (B) AUC values of MTT activity derived from the curves of control and IL-8 silenced MSCs are shown. Paired t test was performed to identify statistical significance. (C) Dose dependent effect of Atrazine on the secretion of angiogenic factors from control or IL-8 silenced MSCs of four independent donors (D#1, D#2, D#3, D#4) is shown. (D) AUC values of angiogenic factors derived from the curves of control and IL-8 silenced MSCs are shown. Paired t test was performed to identify statistical significance. Statistically significant (P<0.05) changes (IL-8, HGF) between control and IL-8 silenced conditions are marked with dotted box. NS, Non-significant.

Similar articles

Cited by

References

    1. Pereira EF, Aracava Y, DeTolla LJ, Jr., Beecham EJ, Basinger GW, Jr., Wakayama EJ, et al. . Animal models that best reproduce the clinical manifestations of human intoxication with organophosphorus compounds. J Pharmacol Exp Ther (2014) 350:313–21. doi: 10.1124/jpet.114.214932 - DOI - PMC - PubMed
    1. Boverhof DR, Chamberlain MP, Elcombe CR, Gonzalez FJ, Heflich RH, Hernandez LG, et al. . Transgenic animal models in toxicology: historical perspectives and future outlook. Toxicol Sci (2011) 121:207–33. doi: 10.1093/toxsci/kfr075 - DOI - PubMed
    1. Pollard KM, Christy JM, Cauvi DM, Kono DH. Environmental xenobiotic exposure and autoimmunity. Curr Opin Toxicol (2018) 10:15–22. doi: 10.1016/j.cotox.2017.11.009 - DOI - PMC - PubMed
    1. Wang Y, Fang J, Liu B, Shao C, Shi Y. Reciprocal regulation of mesenchymal stem cells and immune responses. Cell Stem Cell (2022) 29:1515–30. doi: 10.1016/j.stem.2022.10.001 - DOI - PubMed
    1. Shi Y, Wang Y, Li Q, Liu K, Hou J, Shao C, et al. . Immunoregulatory mechanisms of mesenchymal stem and stromal cells in inflammatory diseases. nature reviews. Nephrology (2018) 14:493–507. doi: 10.1038/s41581-018-0023-5 - DOI - PubMed

Publication types