. 2023 Aug 17:12:e86136.
doi: 10.7554/eLife.86136.

Epigenetic signature of human immune aging in the GESTALT study

Affiliations

Epigenetic signature of human immune aging in the GESTALT study

Roshni Roy et al. Elife. .

Abstract

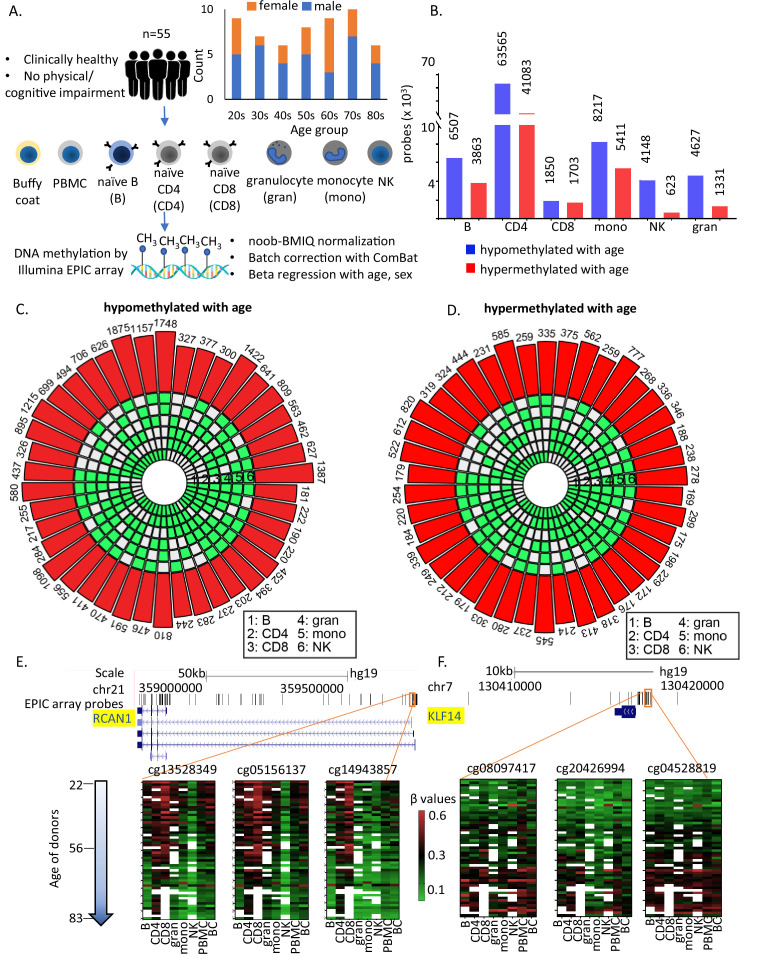
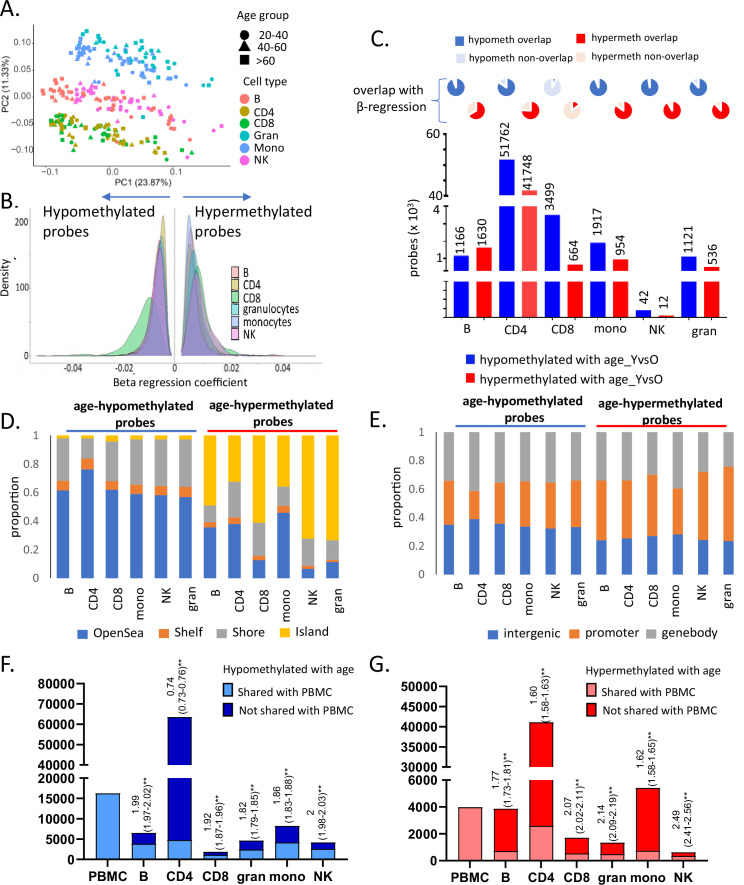
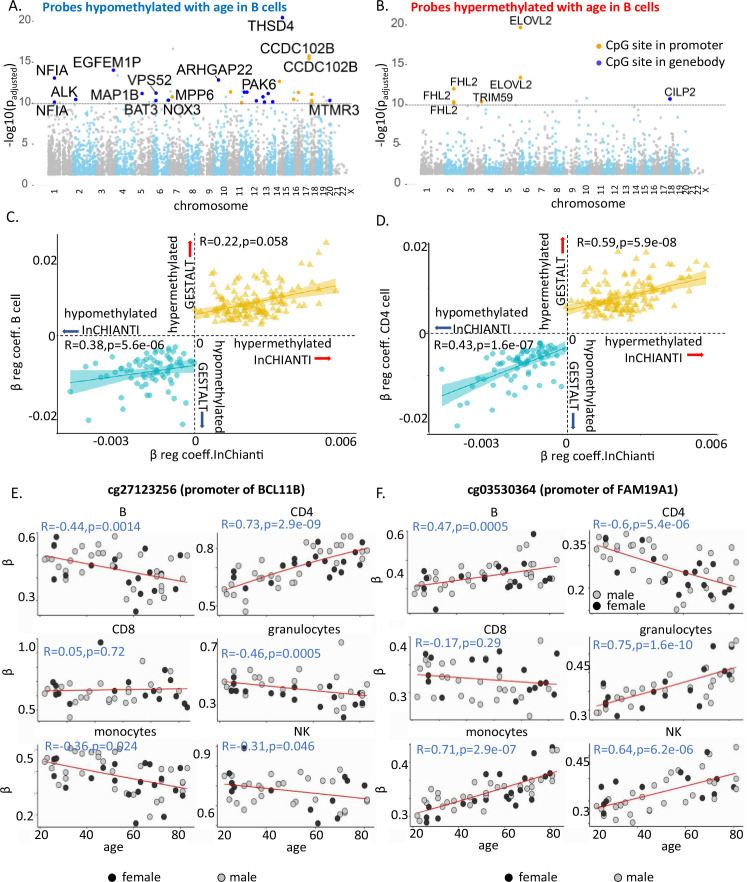
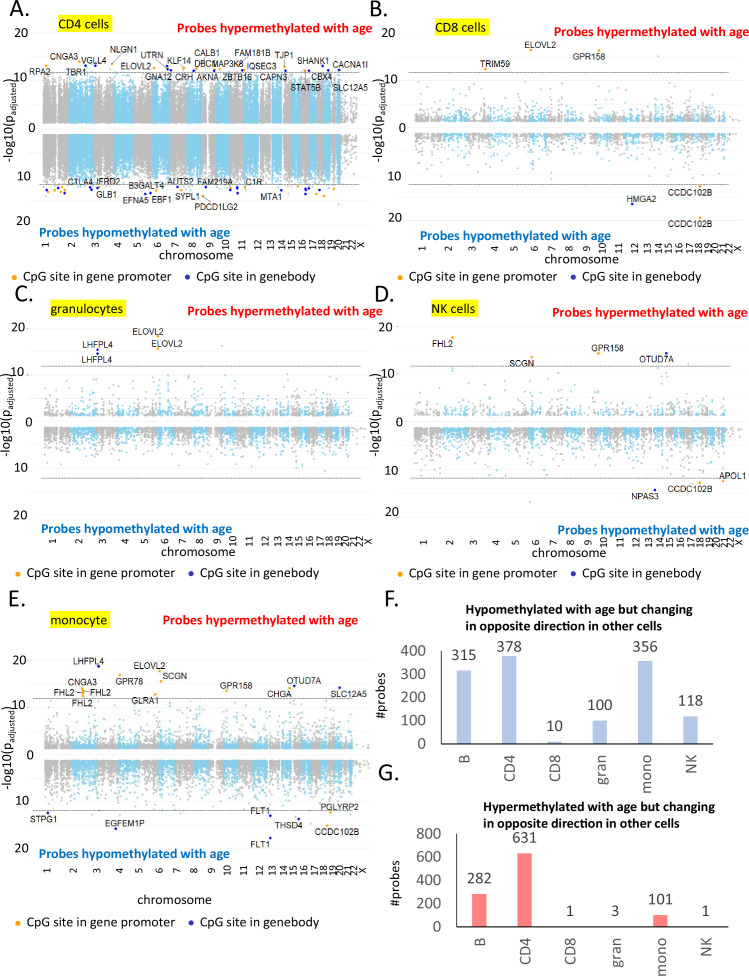
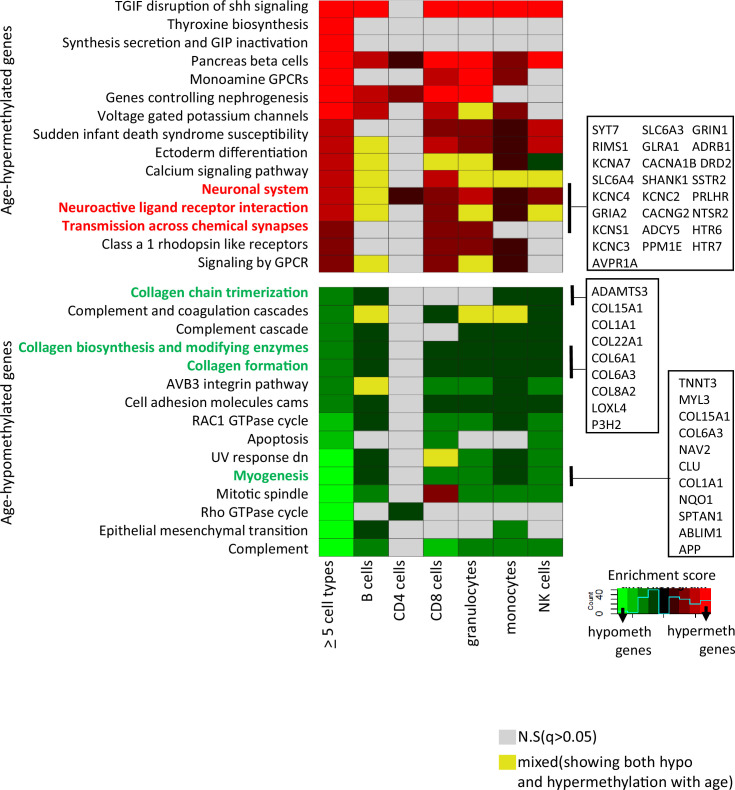
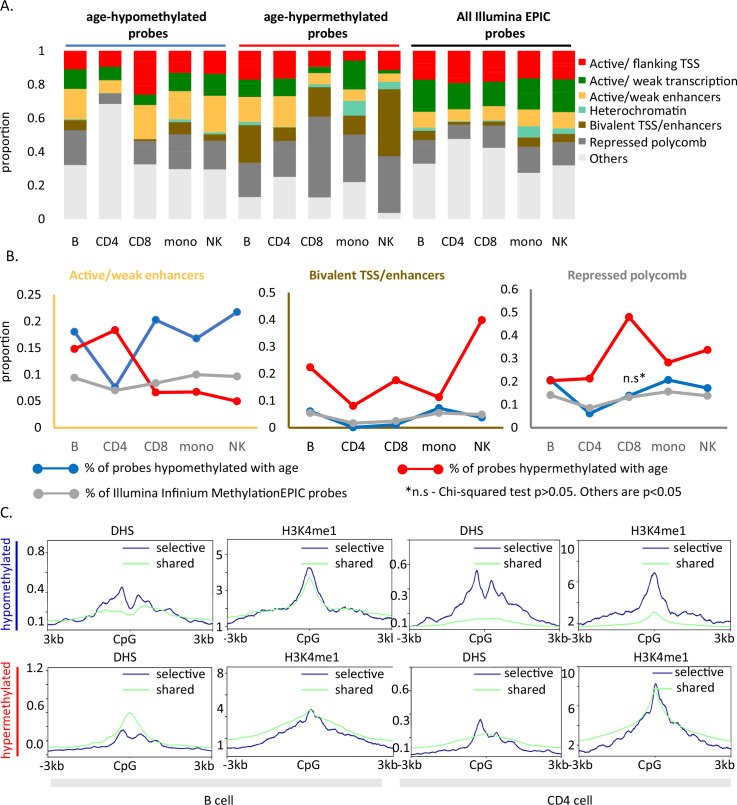
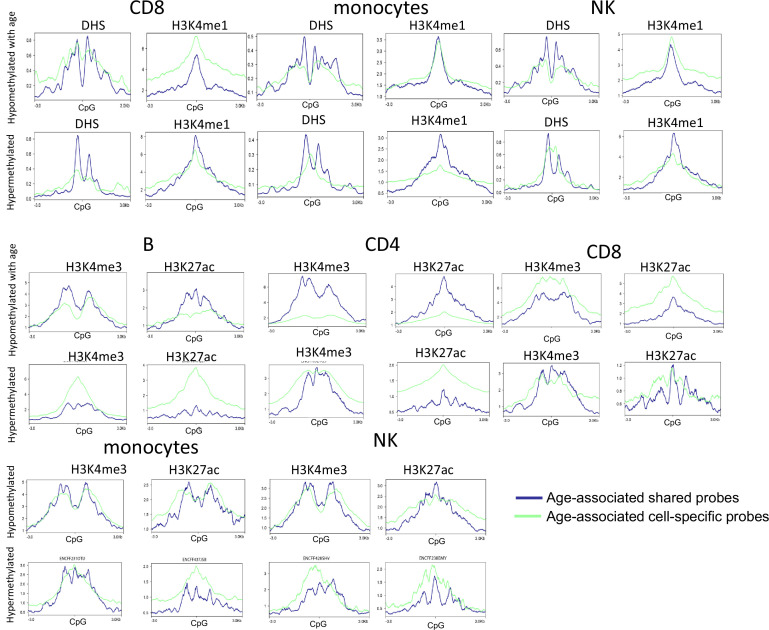
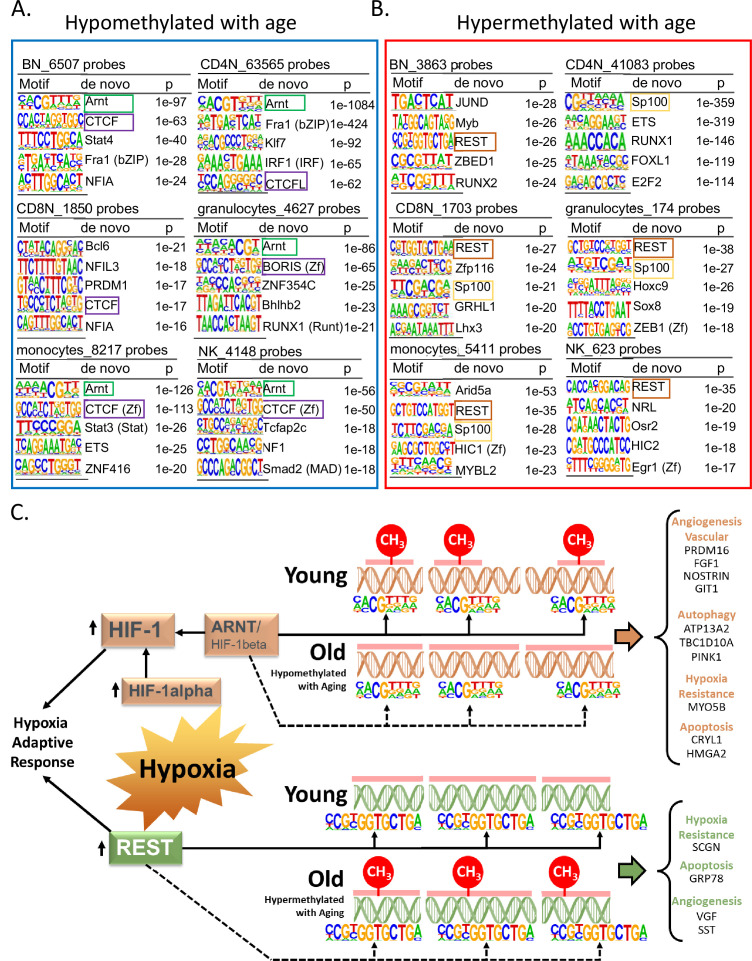
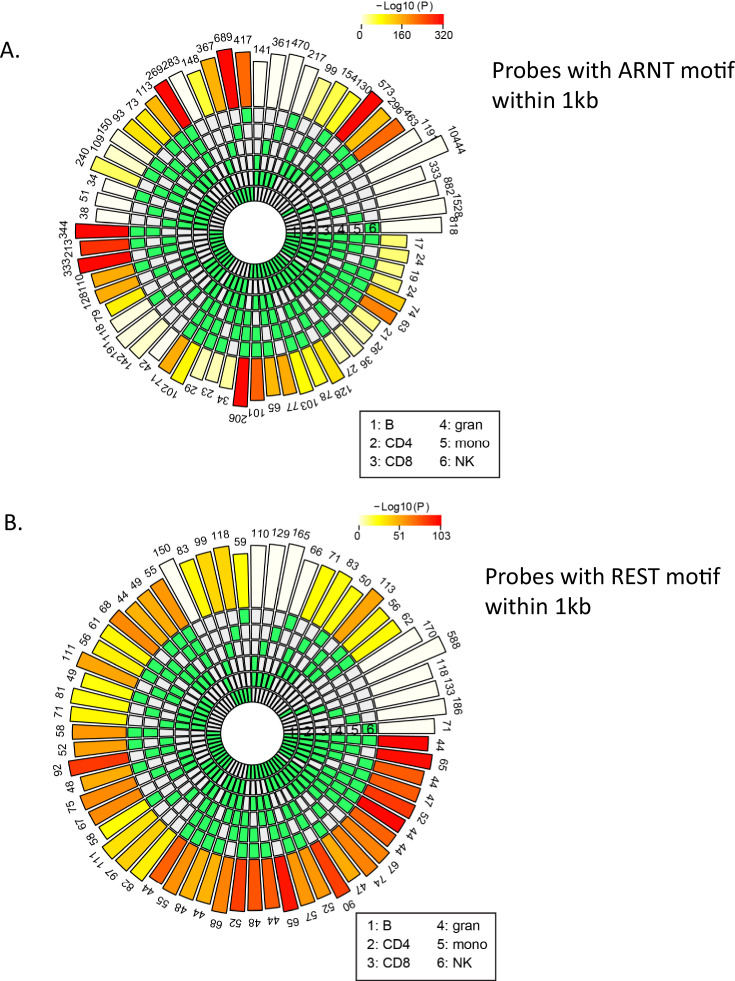
Age-associated DNA methylation in blood cells convey information on health status. However, the mechanisms that drive these changes in circulating cells and their relationships to gene regulation are unknown. We identified age-associated DNA methylation sites in six purified blood-borne immune cell types (naive B, naive CD4+ and CD8+ T cells, granulocytes, monocytes, and NK cells) collected from healthy individuals interspersed over a wide age range. Of the thousands of age-associated sites, only 350 sites were differentially methylated in the same direction in all cell types and validated in an independent longitudinal cohort. Genes close to age-associated hypomethylated sites were enriched for collagen biosynthesis and complement cascade pathways, while genes close to hypermethylated sites mapped to neuronal pathways. In silico analyses showed that in most cell types, the age-associated hypo- and hypermethylated sites were enriched for ARNT (HIF1β) and REST transcription factor (TF) motifs, respectively, which are both master regulators of hypoxia response. To conclude, despite spatial heterogeneity, there is a commonality in the putative regulatory role with respect to TF motifs and histone modifications at and around these sites. These features suggest that DNA methylation changes in healthy aging may be adaptive responses to fluctuations of oxygen availability.

Keywords: DNA methylation; genetics; genomics; healthy aging; human; hypoxia; immune cells; immunology; inflammation.


Conflict of interest statement

RR, PK, JC, DS, CU, DH, MK, SA, AS, AB, JK, AM, TT, JM, LZ, CN, TW, CD, WW, YP, CC, SD, JS, NW, RS, LF No competing interests declared

Figures

Figure 1.
Figure 1.. Study design and identification of age-associated methylation probes.
(A) Study design. (B) Age-associated CpG methylation (False Discovery Rate or FDR p < 0.05) in six cell types. (C, D) SuperExactTest circular plots to show the number of age-associated hypo- and hypermethylated probes shared among different combinations of cell types (indicated by green boxes), respectively. The outermost bars show the number of probes shared among each cell-type combination (regardless of other cell types). For example, probes hypomethylated with age in B + CD4 + CD8 + gran + mono (n = 222) includes probes also hypomethylated in NK cells (n = 181) and probes not hypomethylated with age in NK cells (n = 41). Based on the exact probability distributions of multi-set intersections, all the overlaps shown are highly statistically significant (p < 10−100). (E) Graphical representation of age-associated hypomethylation in promoter region of RCAN1 in all six cell types. (F) Graphical representation of age-associated hypermethylation in promoter region of KLF14. The methylation status in peripheral blood mononuclear cell (PBMC) and buffy coat are also shown. Missing methylation data are represented in white.
Figure 1—figure supplement 1.
Figure 1—figure supplement 1.. Characteristics of entire dataset and age-associated methylation data in six primary immune cells.
(A) Principal component analysis (PCA) plot of normalized methylation data of six immune cells in the 55 healthy donors. The cell types are indicated in different colors, while the three broad age groups (20–40, 40–60, and 60–90 years) are indicated in different shapes (PC1 – principal component 1, PC2 – principal component 2). (B) Distribution of beta-regression coefficient of the age-associated hypo- and hypermethylated probes in all six immune cell types estimated this cross-sectional study. Distribution of coefficient values categorized into groups is shown in Supplementary file 3. (C) Age-associated probes from independent sample t-test analysis of young (≤35 years, 25th percentile) vs old (≥70 years, 75th percentile) donors for each cell type. The pie charts on top show the extent of overlap with results from the beta-regression analysis. (D) Distribution of age-associated probes from beta-regression into groups based on distance from CpG islands (CGI) (Island – within CGI, shore – within 2 kb of CGI, shelf – 2–4 kb of CGI, open sea – >4 kb from CGI). (E) Distribution of age-associated hypo- and hypermethylated probes with respect to location (promoter – 1500TSS to first exon, genebody – within exons, introns, and 3′UTR). (F, G) Overlap of age-associated hypo- and hypermethylated probes in the six immune cell types with those identified in peripheral blood mononuclear cells (PBMCs). The first bar indicates the number of age-associated probes identified in PBMC. The following bars show the counts in the other immune cells, the lighter portion of the bars show the number of probes that are shared with PBMCs, and the darker portion indicates non-PBMC cell-specific probes. The numbers above the bars show the log of odds ratio and its 95% confidence interval to represent the significance of the overlap between age-associated probes in each cell type with PBMC. The p-value from odds ratio analysis is represented as ** as they were all <0.01.
Figure 2.
Figure 2.. Characteristics of age-associated probes.
(A, B) Manhattan plot of age-associated hypo- and hypermethylated CpG sites in B cells, respectively. Most significant genic probes (−log padj >10) are labeled. (C) Correlation between beta-regression coefficients of age-differentially methylated CPGs in GESTALT and longitudinal InCHIANTI study. X-axis – InCHIANTI, Y-axis – B cell (C) and CD4+ T cell coefficients (D). Blue dots – age-hypomethylated CpGs, yellow triangles – age-hypermethylated CpGs. (E, F) Scatter plot of age-associated CpGs showing opposite trends in different immune cells. (E) cg27123256 (in BCL11B promoter) is hypomethylated with older age in B, monocytes, and NK while is hypermethylated with older age in CD4+ T cells. (F) cg03530364 (in FAM19A1 promoter) is hypermethylated with older age in B, granulocytes, monocytes, and NK cells while it is hypomethylated with older age in CD4+ T cells.
Figure 2—figure supplement 1.
Figure 2—figure supplement 1.. Most significant age-associated CpGs in non-B immune cells along with CpGs showing opposite age-associated trends.
(A) Manhattan plot of age-associated CpGs in CD4+ T cells. The X-axis shows the distribution of significant CpGs (FDR p < 0.05), and the Y-axis shows the associated negative log of the adjusted p-value from beta-regression. Positive axis comprises of probes hypermethylated with age while the negative axis shows age-associated hypomethylated probes. The top hits in each group with the most significant p-values are labeled where the orange dot present CpG probes in the gene promoter. (B) Manhattan plot of age-associated probes in CD8+ T cells. (C) Manhattan plot of age-associated probes in granulocytes. (D) Manhattan plot of age-associated probes in NK cells. (E) Manhattan plot of age-associated probes in monocytes. (F) Count of probes hypomethylated with age in cell type of interest but showing hypermethylation in one or more other cell types. For example, 315 probes are age-hypomethylated in B cells but are significantly hypermethylated with age in one or more other immune cell types. Maximum number of such probes are observed in CD4+ T cells followed by B cells and monocytes. (G) Count of probes hypermethylated with age in cell type of interest but showing hypomethylation in one or more other cell types. For example, 282 probes are hypermethylated in B cells but are significantly hypomethylated with age in one or more other immune cell types. Maximum number of such probes are observed in CD4+ T cells followed by B cells and monocytes.
Figure 2—figure supplement 2.
Figure 2—figure supplement 2.. Comparison of individual immune cells with InCHIANTI longitudinal study.
(A, B) Correlation between beta-regression coefficients of age-associated methylation probes in five or more cell types in study and beta-regression coefficients estimated from longitudinal data in the InCHIANTI study. On the X-axis is the data from InCHIANTI longitudinal study cohort while on the Y-axis is cell-specific coefficient values for CD8+ T cells (top left), granulocytes (top right), monocytes (bottom left), and NK cells (bottom right). Pink dots are the coefficients of the age-hypomethylated probes (A) while the blue dots are for age-hypermethylated probes (B).
Figure 3.
Figure 3.. Pathway analysis of methylated probes.
Enrichment analysis of genes annotated to age-associated hypo- and hypermethylated CpGs in ≥5 cell types (left-most column) and in individual cell types. Red/green shades indicate enrichment scores in hyper- (red) and hypo- (green) methylated genes. Yellow indicates ambiguous pathways associated with both hypo- and hypermethylated genes in individual cell types. Not significant pathways are shown in gray. Full results in Supplementary file 6.
Figure 4.
Figure 4.. Functional annotation of age-associated probes along with their grouping based on sharedness.
(A) ChromHMM annotation of age-associated CpGs. (B) Proportion of CpGs mapping to weak/active enhancers (left, orange box), bivalent enhancers/TSS (inset, brown box) and polycomb repressor regions (right, gray box) in age-associated hypo- (blue line), hypermethylated (red line) CpGs as compared to all MethylationEPIC CpGs (gray line). (C) DeepTools plots showing the distribution of accessible chromatin (DNase hypersensitive sites) and H3K4me1 histone mark in and around ±3 kb region of age-differentially methylated CpGs. The age-associated sites were divided into shared (blue) (common between five or more immune cells) and selective sites (green). The top row shows the pattern for age-associated hypomethylated CpGs while the bottom row is for the age-associated hypermethylated CpGs in B and CD4+ T cells.
Figure 4—figure supplement 1.
Figure 4—figure supplement 1.. Functional annotation of age-associated probes with respect to DHS and three other histone marks from ENCODE.
Rows 1 and 2 – the functional annotation of age-associated probes in CD8, monocytes, and NK cells with respect to DNase hypersensitivity sites and H3K4me1 peaks. Rows 3–6 – the functional annotation of age-associated probes in B, CD4, CD8, monocytes, and NK cells with respect to H3K4me3 and H3K27ac peaks. Age-associated hypo- or hypermethylated probes were grouped into shared (blue) and selective (green) based on whether they were common across five or more of the six cell types or not. A region of 3 kb of either side of the CpG probes of interest was examined. The DHS and histone bigwig files for the five primary cells were obtained from ENCODE. Granulocyte data were not available and hence could not be examined.
Figure 5.
Figure 5.. Association of transcription factor (TF)-binding motifs with age-differentially methylated CpGs.
(A) Top 5 TF motifs at and around (±200 bp) of CpG sites that are hypomethylated with age. All the age-hypomethylated sites were considered for the analysis in each cell type. Recurring motifs like ARNT and CTCF/BORIS are highlighted. (B) Top 5 TF motifs at and around (±200 bp) CpG sites that are hypermethylated with age. All the age-hypermethylated sites were considered for the analysis in each cell type. Recurring motifs like REST and Sp100 are highlighted. (C) Hypoxia-centric model of age-associated sites with ARNT and REST motifs. CpG sites hypomethylated with aging across six different cell types are significantly more likely to host-binding motifs for ARNT, the core hub for the hypoxia response. On the contrary, CpG sites hypermethylated with aging are significantly more likely to host-binding motifs for REST, a hypoxia-response transcriptional repressor. On the right are selected age-associated genes that carry the motifs for ARNT or REST TFs.
Figure 5—figure supplement 1.
Figure 5—figure supplement 1.. Count of age-associated hypo- or hypermethylated probes with ARNT or REST motifs within 1 kb, respectively.
ARNT and REST were the top transcription factor (TF) motifs associated, respectively, with all hypo- and hypermethylated age-associated probes in most cell types. To verify whether the same set of probes were present in each cell type with the ARNT (A) or REST (B) motifs, HOMER was used to find the probes that have an ARNT or REST motif within ±500 bp. The SuperExact test-based circular plots show the overlap between the different cell types (relevant cell types are indicated in green boxes in the inner circles for each combination). The numbers above the outermost bars indicate the count of probes that have ARNT or REST motifs across various combinations of cells while the color of the outermost bars in the plot indicates the log-transformed p-values obtained from hypergeometric test to check whether the overlap is significant or not.

Update of

  • doi: 10.1101/2023.01.23.525162

References

    1. Acevedo N, Reinius LE, Vitezic M, Fortino V, Söderhäll C, Honkanen H, Veijola R, Simell O, Toppari J, Ilonen J, Knip M, Scheynius A, Hyöty H, Greco D, Kere J. Age-associated DNA methylation changes in immune genes, histone modifiers and chromatin remodeling factors within 5 years after birth in human blood leukocytes. Clinical Epigenetics. 2015;7:34. doi: 10.1186/s13148-015-0064-6. - DOI - PMC - PubMed
    1. Aryee MJ, Jaffe AE, Corrada-Bravo H, Ladd-Acosta C, Feinberg AP, Hansen KD, Irizarry RA. Minfi: a flexible and comprehensive Bioconductor package for the analysis of Infinium DNA methylation microarrays. Bioinformatics. 2014;30:1363–1369. doi: 10.1093/bioinformatics/btu049. - DOI - PMC - PubMed
    1. Bae S, Lesch BJ. H3K4me1 distribution predicts transcription state and poising at promoters. Frontiers in Cell and Developmental Biology. 2020;8:289. doi: 10.3389/fcell.2020.00289. - DOI - PMC - PubMed
    1. Bell JT, Tsai P-C, Yang T-P, Pidsley R, Nisbet J, Glass D, Mangino M, Zhai G, Zhang F, Valdes A, Shin S-Y, Dempster EL, Murray RM, Grundberg E, Hedman AK, Nica A, Small KS, MuTHER Consortium. Dermitzakis ET, McCarthy MI, Mill J, Spector TD, Deloukas P. Epigenome-wide scans identify differentially methylated regions for age and age-related phenotypes in a healthy ageing population. PLOS Genetics. 2012;8:e1002629. doi: 10.1371/journal.pgen.1002629. - DOI - PMC - PubMed
    1. Bhat P, Honson D, Guttman M. Nuclear compartmentalization as a mechanism of quantitative control of gene expression. Nature Reviews. Molecular Cell Biology. 2021;22:653–670. doi: 10.1038/s41580-021-00387-1. - DOI - PubMed

Publication types

Associated data