Meta-Analysis
. 2023 Oct;601(19):4423-4440.
doi: 10.1113/JP284767. Epub 2023 Aug 17.

The normal distribution of the hypoxic ventilatory response and methodological impacts: a meta-analysis and computational investigation

Affiliations
Meta-Analysis

The normal distribution of the hypoxic ventilatory response and methodological impacts: a meta-analysis and computational investigation

Britney Oeung et al. J Physiol. 2023 Oct.

Abstract

The hypoxic ventilatory response (HVR) is the increase in breathing in response to reduced arterial oxygen pressure. Over several decades, studies have revealed substantial population-level differences in the magnitude of the HVR as well as significant inter-individual variation. In particular, low HVRs occur frequently in Andean high-altitude native populations. However, our group conducted hundreds of HVR measures over several years and commonly observed low responses in sea-level populations as well. As a result, we aimed to determine the normal HVR distribution, whether low responses were common, and to what extent variation in study protocols influence these findings. We conducted a comprehensive search of the literature and examined the distributions of HVR values across 78 studies that utilized step-down/steady-state or progressive hypoxia methods in untreated, healthy human subjects. Several studies included multiple datasets across different populations or experimental conditions. In the final analysis, 72 datasets reported mean HVR values and 60 datasets provided raw HVR datasets. Of the 60 datasets reporting raw HVR values, 35 (58.3%) were at least moderately positively skewed (skew > 0.5), and 21 (35%) were significantly positively skewed (skew > 1), indicating that lower HVR values are common. The skewness of HVR distributions does not appear to be an artifact of methodology or the unit with which the HVR is reported. Further analysis demonstrated that the use of step-down hypoxia versus progressive hypoxia methods did not have a significant impact on average HVR values, but that isocapnic protocols produced higher HVRs than poikilocapnic protocols. This work provides a reference for expected HVR values and illustrates substantial inter-individual variation in this key reflex. Finally, the prevalence of low HVRs in the general population provides insight into our understanding of blunted HVRs in high-altitude adapted groups. KEY POINTS: The hypoxic ventilatory response (HVR) plays a crucial role in determining an individual's predisposition to hypoxia-related pathologies. There is notable variability in HVR sensitivity across individuals as well as significant population-level differences. We report that the normal distribution of the HVR is positively skewed, with a significant prevalence of low HVR values amongst the general healthy population. We also find no significant impact of the experimental protocol used to induce hypoxia, although HVR is greater with isocapnic versus poikilocapnic methods. These results provide insight into the normal distribution of the HVR, which could be useful in clinical decisions of diseases related to hypoxaemia. Additionally, the low HVR values found within the general population provide insight into the genetic adaptations found in populations residing in high altitudes.

Keywords: HVR; hypoxia; hypoxic ventilatory response; population variation; variation; ventilation.


Conflict of interest statement

DISCLOSURES

The authors declare that the research was conducted in the absence of any commercial or financial relationships that could be construed as a potential conflict of interest.

Figures

Figure 1.
Figure 1.. PRISMA diagram of study filtering.
Filtering methods and inclusion criteria used to identify studies for this analysis. A PubMed search conducted on August 12, 2021 using the terms “hypoxic ventilatory response” or “hypoxic chemosensitivity” across any time period yielded 861 reports. All reports were screened by title, and 630 reports were excluded due to the title indicating they were reviews, or providing no indication that any type or respiratory reflex was measured in humans. All remaining abstracts were then screened, and 71 of the remaining reports were excluded because of abstracts which did not indicate that HVR was measured in at least one untreated healthy group. All remaining studies were then read in detail to verify that the study contained compatible study populations, compatible methodological approaches with sufficient detail provided, and compatible units (“L/min/SpO2” or “A”), and that raw or mean HVR data was available for extraction. 82 reports were excluded during this step (Data not provided/incompatible data presentation (N=7), Insufficient methodological detail (N=5), Lack of healthy adult participants (N=3), Lack of non-intervention group (N=1), Incompatible methodology (N=34), Incompatible HVR unit (N=18), Inability to access report/not available in English language (N=14)). This yielded 78 compatible reports for analysis.
Figure 2.
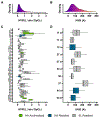
Figure 2.. HVR distributions across studies.
(Top) Density plots showing pooled data across all studies, separated by HVR unit, “L/min/%SpO2(A) or “A” (B). (Bottom) Boxplots showing distributions of HVR values within study datasets, separated by HVR unit, “L/min/%SpO2(C) or “A” (D). For studies examining two distinct populations, data is separated into individual plots for each population within that study (i.e., 2a and 2b). Boxplot colors indicate the population examined in each dataset. Studies 3a, 12a, and 44a represent data collected in Tibetan or Sherpa high-altitude natives, and studies 3b and 26 represent data collected in Andean high-altitude natives. Study 44b represents data collected in high-altitude residents of Han Chinese ancestry.
Figure 3.
Figure 3.. Impact of methodology on mean HVR.
Data points represent mean HVR values within an individual study. Data for all studies, including those in sea-level residents at sea level, high-altitude resident populations tested at high altitude, and sea-level residents acclimatized to high altitude are provided in panels A-C. Data for only studies conducted in sea-level residents at sea level are provided in panels D-F. Error bars represent 95% confidence intervals.
Figure 4.
Figure 4.. Spearman correlation plot for relationship between the HVR and end-tidal PCO2 isocapnic target.
Data points represent mean HVR values for individual studies. Points are slightly jittered along the x axis for visibility of overlapping data. Rho and p values represent values calculated via a Spearman rank correlation analysis.
Figure 5.
Figure 5.. Impact of methodology on HVR distribution skewness.
Data points represent skewness of HVR value distributions within an individual study. Error bars represent 95% confidence intervals.
Figure 6.
Figure 6.. Histograms of experimental hypoxia targets chosen across all studies.
Hypoxia targets were determined for each individual study based on the target SpO2 (A), or end-tidal PO2 target in mmHg (B) or % (C). Results reported here include both hypoxia targets for step-down tests as well as low-end threshold hypoxia targets for progressive/rebreathing methods.
Figure 7.
Figure 7.. Mean HVR values as a function of target hypoxia level.
Relationships between mean HVR across studies and hypoxia targets for studies indicating SpO2 (A), end-tidal PO2 (B), and FIO2 targets (C) with L/min/SpO2 units, as well as SpO2 targets with A units (D).
Figure 8.
Figure 8.. Distributions of lab-controlled datasets.
Datasets collected in the same laboratory all using isocapnic step-down protocols. Study IDs: A – Garcia et al. 2000, B – Hupperets et al. 2004, C – Weigner et al. 1998, D – Basaran et al. 1998, E – Unpublished 1, F – Unpublished 2, G – Unpublished 3.
Figure 9.
Figure 9.. Impact of high-altitude acclimatization on the HVR.
(A) Mean HVR values collected from 19 datasets across 6 studies conducted at 3800 to 4559 m elevation. (B) An expanded view of mean HVR values from studies reporting 1-7 days of acclimatization at 3800 to 4559 m elevation. (C) Mean HVR values in all studies collecting HVR values in sea-level residents at sea level (SL) compared to sea-level residents acclimatized to 3800-4559 m elevation (HA).
Figure 10.
Figure 10.. Simulated HVR curves.
A subset of 10 randomly generated HVR curves plotted as a function of PO2 (A) or SaO2 (B). The same 10 datasets are plotted in A and B, and estimated SpO2 levels in B were calculated from PO2 in A as described above.
Figure 11.
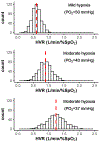
Figure 11.. Distribution of simulated HVR values at different target PO2 levels.
Plots display histogram distributions of 500 simulated HVR measurements with a target PO2 at three levels across the same curves. The mean HVR in each group is indicated by vertical red dashed lines.

References

    1. Ainslie PN, Lucas SJE & Burgess KR (2013). Breathing and sleep at high altitude. Respir Physiol Neurobiol 188, 233–256. - PubMed
    1. Aitken ML, Franklin JL, Pierson DJ & Schoene RB (1986). Influence of body size and gender on control of ventilation. J Appl Physiol 60, 1894–1899. - PubMed
    1. Albert TJ & Swenson ER (2014). Peripheral Chemoreceptor Responsiveness and Hypoxic Pulmonary Vasoconstriction in Humans. High Alt Med Biol 15, 15–20. - PubMed
    1. Amin HM, Sopchak AM, Foss JF, Esposito BF, Roizen MF & Camporesi EM (1994). Efficacy of Methylnaltrexone Versus Naloxone for Reversal of Morphine-Induced Depression of Hypoxic Ventilatory Response. Anesth Analg. 78, 701–5. - PubMed
    1. Balcerek B, Steinach M, Lichti J, Maggioni MA, Becker PN, Labes R, Gunga HC, Persson PB & Fähling M (2020). A broad diversity in oxygen affinity to haemoglobin. Sci Rep 10, 1–15. - PMC - PubMed

Publication types