. 2023 Aug 17:12:e83975.
doi: 10.7554/eLife.83975.

Optogenetic manipulation of neuronal and cardiomyocyte functions in zebrafish using microbial rhodopsins and adenylyl cyclases

Affiliations

Optogenetic manipulation of neuronal and cardiomyocyte functions in zebrafish using microbial rhodopsins and adenylyl cyclases

Hanako Hagio et al. Elife. .

Abstract

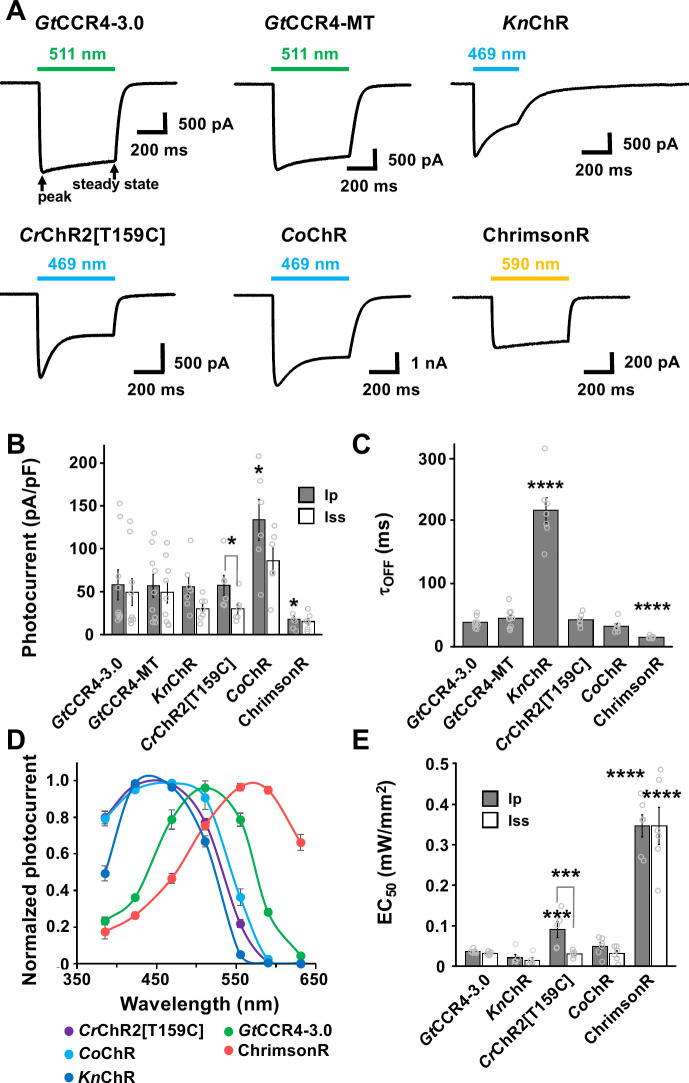
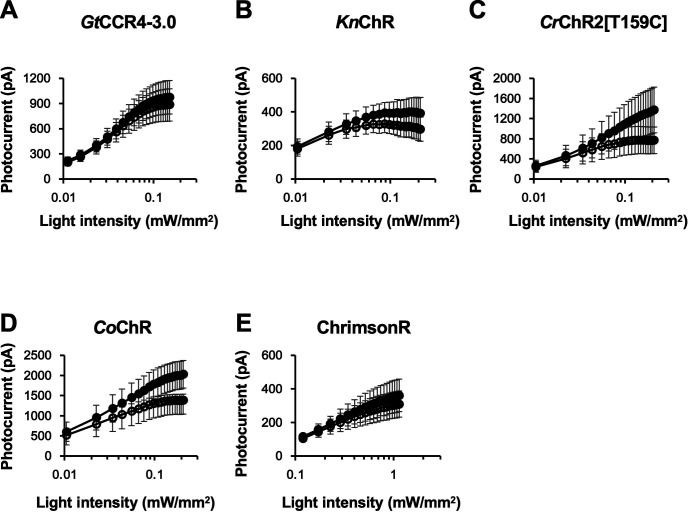
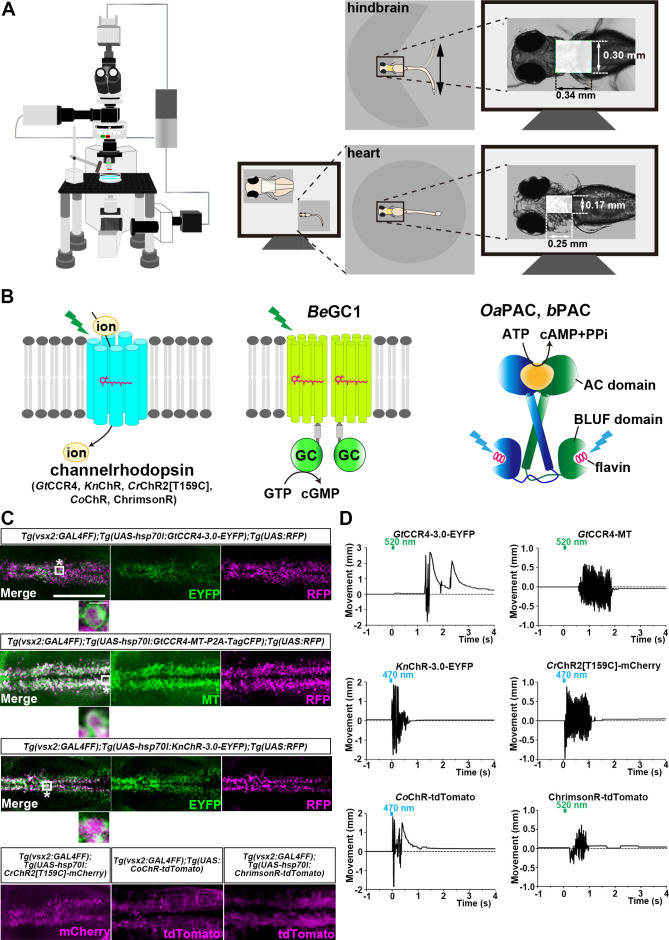
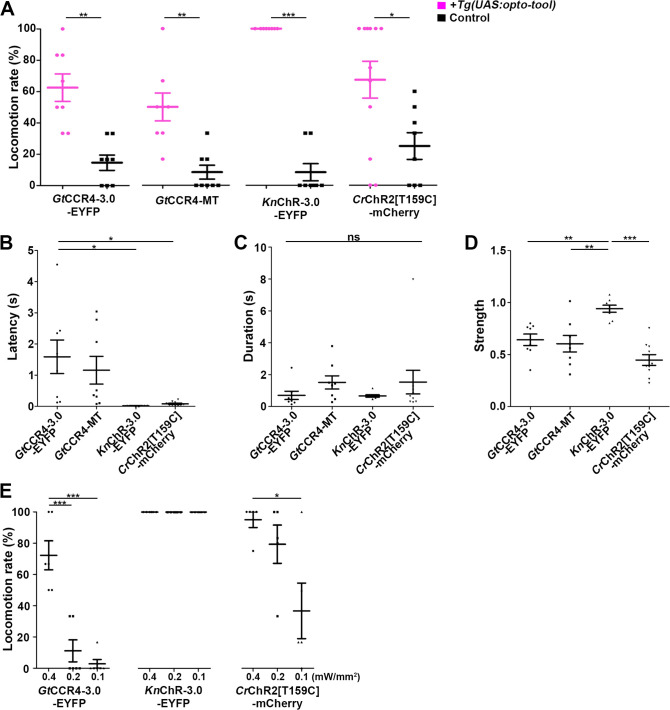
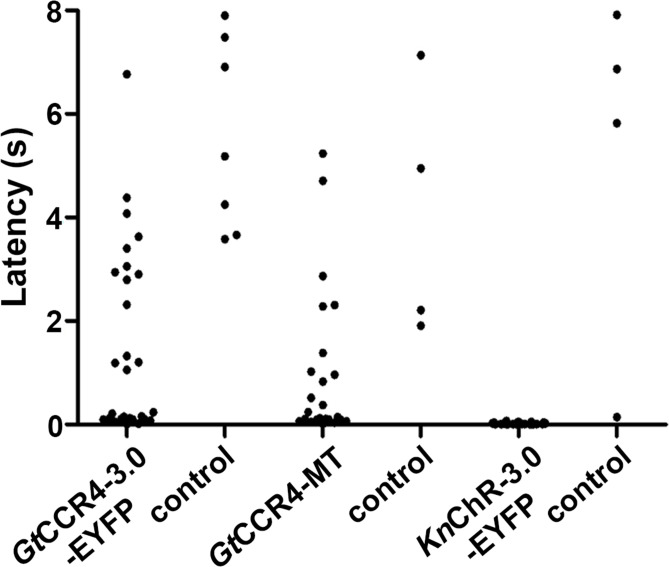
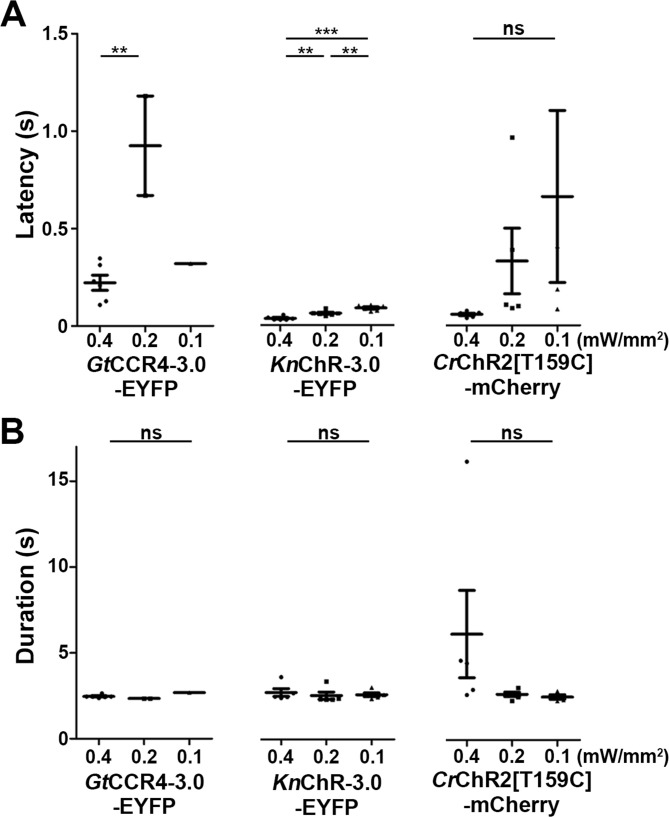
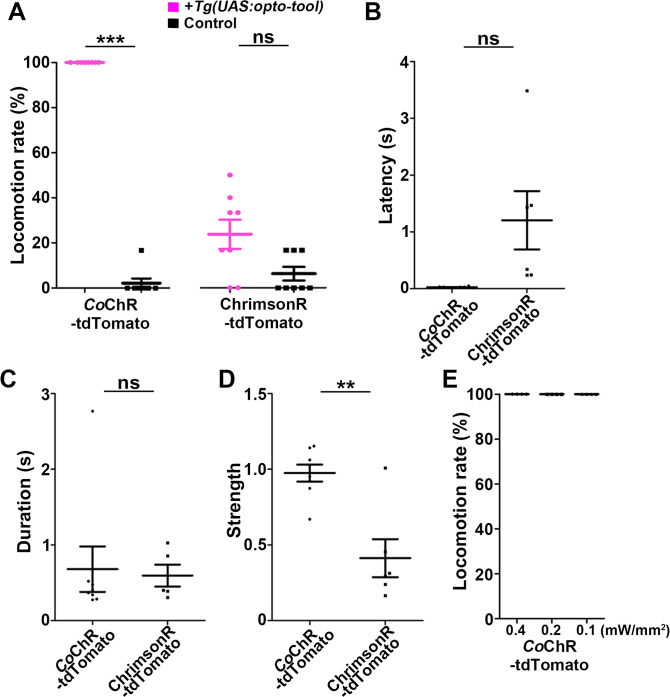
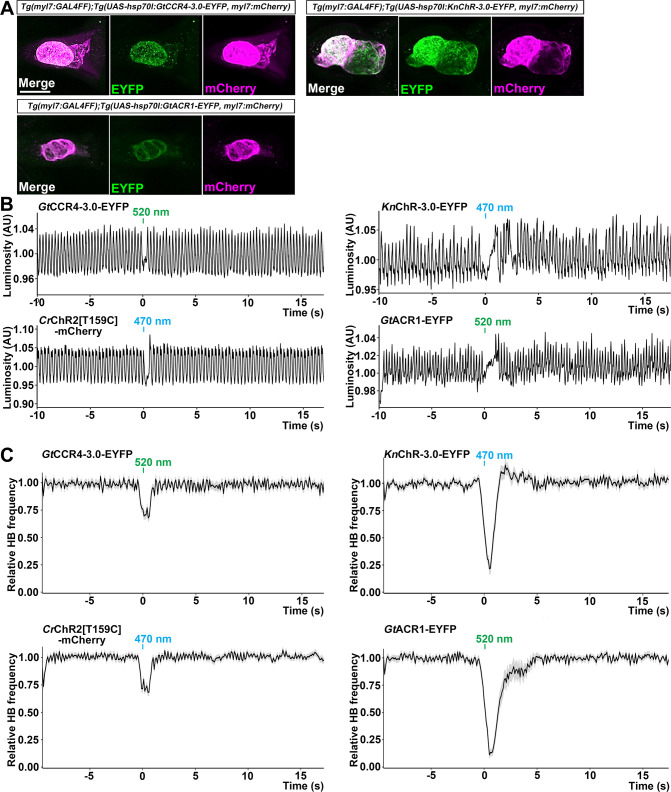
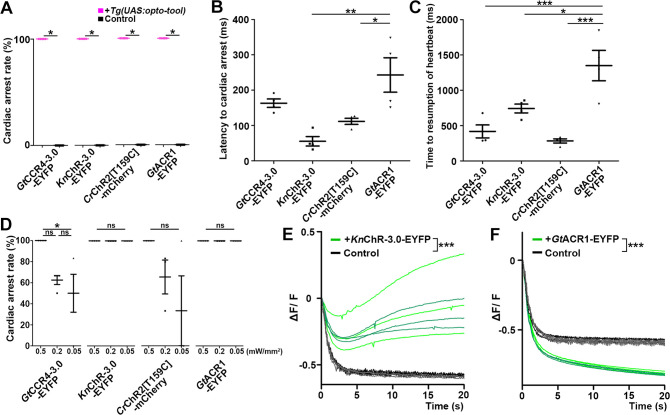
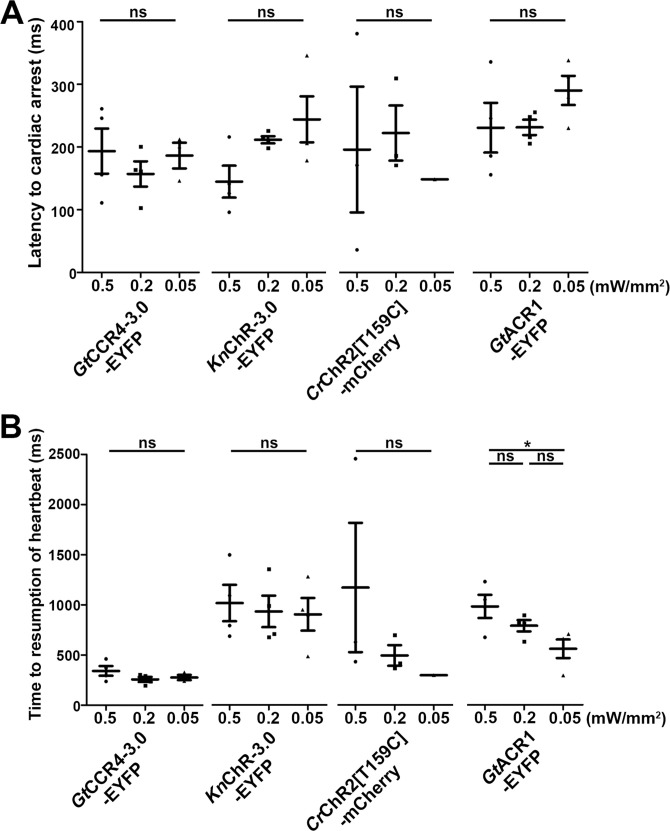
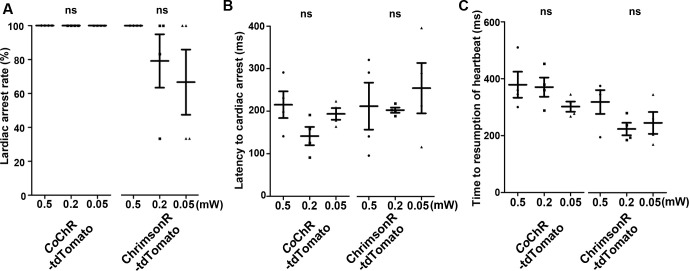
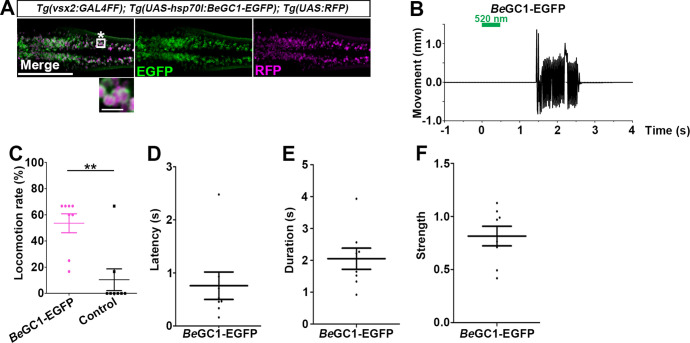
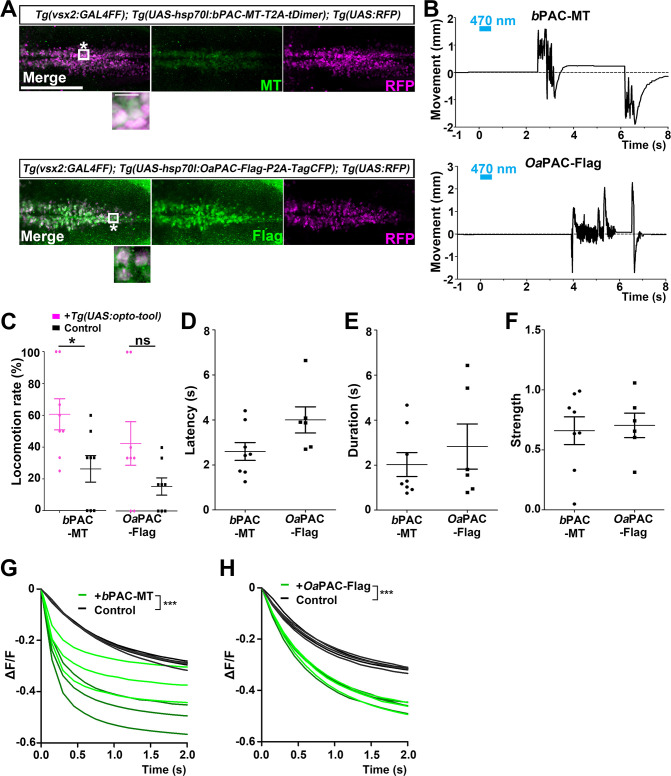
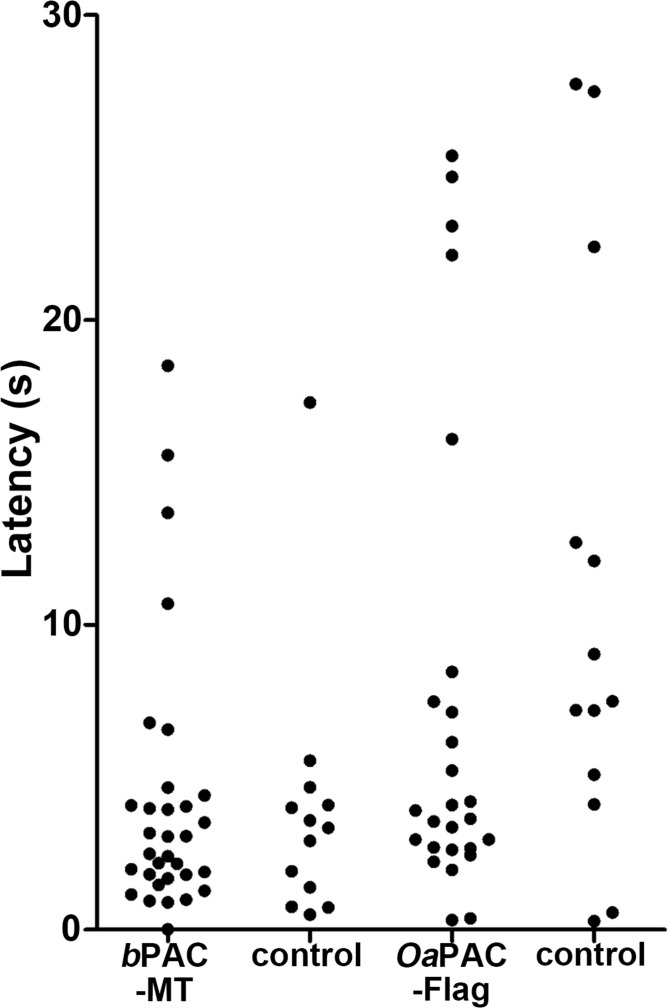
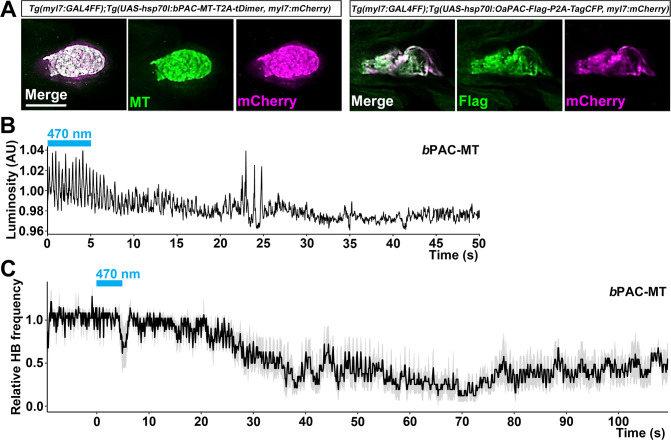
Even though microbial photosensitive proteins have been used for optogenetics, their use should be optimized to precisely control cell and tissue functions in vivo. We exploited GtCCR4 and KnChR, cation channelrhodopsins from algae, BeGC1, a guanylyl cyclase rhodopsin from a fungus, and photoactivated adenylyl cyclases (PACs) from cyanobacteria (OaPAC) or bacteria (bPAC), to control cell functions in zebrafish. Optical activation of GtCCR4 and KnChR in the hindbrain reticulospinal V2a neurons, which are involved in locomotion, induced swimming behavior at relatively short latencies, whereas activation of BeGC1 or PACs achieved it at long latencies. Activation of GtCCR4 and KnChR in cardiomyocytes induced cardiac arrest, whereas activation of bPAC gradually induced bradycardia. KnChR activation led to an increase in intracellular Ca2+ in the heart, suggesting that depolarization caused cardiac arrest. These data suggest that these optogenetic tools can be used to reveal the function and regulation of zebrafish neurons and cardiomyocytes.

Keywords: adenylyl cyclase; cardiac contraction; cell biology; guanylyl cyclase; locomotion; neuroscience; optogenetics; rhodopsin; zebrafish.


Conflict of interest statement

HH, WK, SH, AS, JN, KM, TS, SH, ST, HK, MH No competing interests declared

Figures

Figure 1.
Figure 1.. Photocurrent properties of channelrhodopsins.
(A) Representative photocurrent traces of GtCCR4-3.0-EYFP (GtCCR4-3.0), GtCCR4-MT-P2A-TagCFP (GtCCR4-MT), KnChR, CrChR2[T159C], CoChR, and ChrimsonR. Electrophysiological recordings were performed. Membrane voltage was clamped at –60 mV. Illumination sources were 511 nm light (GtCCR4-3.0, GtCCR4-MT), 469 nm light (KnChR, CrChR2[T159C], CoChR), and 590 nm light (ChrimsonR) at 1.4 mW/mm2. (B) Photocurrent amplitude. Gray bar: peak photocurrent (Ip); white bar: steady state photocurrent (Iss) (n = 6–9). Wilcoxon rank-sum test (CrChR2[T159C]-mCherry Ip vs. Iss, p=0.025; CoChR-tdTomato Ip vs. GtCCR4-3.0-EYFP Ip, p=0.025; ChrimsonR Ip vs. GtCCR4-3.0-EYFP Ip, p=0.049). (C) Comparison of the channel closing kinetics after shutting-off light (τoff) (n = 6–9), Wilcoxon rank-sum test (KnChR-EYFP vs. GtCCR4-3.0-EYFP, p=0.0002; ChrimsonR vs. GtCCR4-3.0-EYFP, p=0.0004). (D) The action spectrum of GtCCR4-3.0 (green circle), KnChR (blue circle), CrChR2[T159C] (purple circle), CoChR (light blue circle), and ChrimsonR (red circle). Illumination sources were 385, 423, 469, 511, 555, 590, or 631 nm light at 1.4 mW/mm2 (GtCCR4-3.0, CrChR2[T159C]) or 0.14 mW/mm2 (KnChR, CoChR, ChrimsonR) (n = 5–10). (E) Half saturation maximum (EC50) of the peak photocurrent (gray bar) and the steady-state photocurrent (white bar) are shown (n = 5, 6), Wilcoxon rank-sum test (CrChR2[T159C]-mcherry Ip vs. Iss, p=0.0079; CrChR2[T159C]-mCherry Ip vs. GtCCR4-3.0-EYFP Ip, p=0.0086; ChrimsonR Ip vs. GtCCR4-3.0-EYFP Ip, p=0.0021; ChrimsonR Iss vs. GtCCR4-3.0-EYFP Iss, p=0.0021). *p<0.05, **p<0.01, ***p<0.001, ****p<0.0005, Mean and SEM are indicated.
Figure 1—figure supplement 1.
Figure 1—figure supplement 1.. Light power dependency of photocurrent amplitude of GtCCR4-3.0 (A), KnChR (B), CrChR2[T159C] (C), CoChR (D), and ChrimsonR (E).
Photocurrent amplitude at − 60 mV was plotted as a function of light power. 511 nm light (A), 469 nm light (B, C), and 590 nm light (D) were illuminated. Filled circle: peak photocurrent; open circle: steady-state photocurrent (n = 5, 6). Error bars indicate standard errors of the mean (SEMs).
Figure 2.
Figure 2.. Optogenetic activation of hindbrain reticulospinal V2a neurons and cardiomyocytes by channelrhodopsins.
(A) Schematic of experimental devices. A larva was embedded in agarose. The hindbrain region or the heart were irradiated with light. Tail (caudal fin) movements and heartbeats were monitored by a high-speed camera with infrared light. (B) Schematic diagram of optogenetic tools used in this study. GC, guanylyl cyclase; AC, adenylyl cyclase; BLUF, sensors of blue-light using FAD. (C) Expression of GtCCR4-3.0-EYFP, GtCCR4-MT, KnChR-3.0-EYFP, CrChR2[T159C]-mCherry, CoChR-tdTomato, and ChrimsonR-tdTomato in the zebrafish hindbrain reticulospinal V2a neurons. 3 dpf (day post fertilization) Tg(vsx2:GAL4FF);Tg(UAS-hsp70l:GtCCR4-3.0-EYFP, GtCCR4-MT-P2A-TagCFP, KnChR-3.0-EYFP, or CrChR2[T159C]-mCherry, myl7:mCherry) larvae were fixed and stained with anti-GFP (EYFP, green), anti-Myc tag (green) or anti-DsRed (RFP, magenta) antibodies. For CoChR and ChrimsonR, fluorescent images of the hindbrain of Tg(vsx2:GAL4FF);Tg(UAS:CoChR-tdTomato, or UAS-hsp70l:ChrimsonR-tdTomato, myl7:mCherry) larvae are shown. Inset: higher magnification images for the boxed areas showing double-labeled neurons. (D) Tail movements of 3-dpf Tg larvae expressing GtCCR4-3.0-EYFP, GtCCR4-MT, KnChR-3.0-EYFP, and CrChR2[T159C]-mCherry, CoChR-tdTomato, and ChrimsonR-tdTomato in the reticulospinal V2a neurons after stimulation of the hindbrain area with LED (0.4 mW/mm2) light with a wavelength of 520 nm (GtCCR4-3.0-EYFP, GtCCR4-MT, ChrimsonR-tdTomato) and 470 nm (KnChR-3.0-EYFP, CrChR2[T159C]-mCherry, CoChR-tdTomato) for 100 ms. Light stimulations started at time 0 s. Typical examples are shown. Scale bars = 150 μm in (C), 5 μm in the insets of (C).
Figure 3.
Figure 3.. Optogenetic activation of hindbrain reticulospinal V2a neurons by GtCCR4, KnChR, and CrChR2[T159C].
(A) Light stimulation-dependent locomotion rates of 3-dpf Tg larvae expressing GtCCR4-3.0-EYFP, GtCCR4-MT, KnChR-3.0-EYFP, CrChR2[T159C]-mCherry. The hindbrain area was irradiated with light (0.4 mW/mm2) with a wavelength of 520 nm (GtCCR4-3.0-EYFP and GtCCR4-MT) or 470 nm (KnChR-3.0-EYFP and CrChR2[T159C]-mCherry) for 100 ms. Six consecutive stimulation trials were analyzed for eight rhodopsin-expressing and non-expressing (control) larvae of each Tg line. The average locomotion rates for each larva are shown, Wilcoxon rank-sum test (GtCCR4-3.0-EYFP vs. control, p=0.00166; GtCCR4-MT vs. control, p=0.00216; KnChR-EYFP vs. control, p=0.000266; CrChR2[T159C]-mCherry vs. control, p=0.0246). (B–D) Latency (B), duration (C), and strength (D) of tail movements. The time from the start of light stimulation to the first tail movement was defined as latency (s), and the time from the start of the first tail movement to the end of that movement was defined as duration (s). The maximum distance that the caudal fin moved from the midline divided by body length was measured as representative of its strength. One-way ANOVA with Tukey’s post hoc test (latency GtCCR4-3.0-EYFP vs. CrChR2[T159C]-mCherry, p=0.0115; GtCCR4-3.0-EYFP vs. KnChR-EYFP, p=0.0128; strength GtCCR4-3.0-EYFP vs. KnChR-EYFP, p=0.00601; GtCCR4-MT vs. KnChR-EYFP, p=0.00181; KnChR-EYFP vs. CrChR2[T159C]-mCherry, p=4.00e-06). (E) Locomotion evoked by light of various light intensities. The hindbrain area was irradiated with light at 0.4, 0.2, or 0.1 mW/mm2. Six consecutive trials were analyzed for 4–6 rhodopsin-expressing larvae for each Tg (n = 6 for GtCCR4-3.0-EYFP and KnChR-3.0-EFYP; n = 5 for CrChR2[T159C]-mCherry). Light stimulation experiments at 0.2 and 0.1 mW/mm2 were conducted only on larvae that exhibited evoked locomotion three or more times in response to the initial light stimulation at 0.4 mW/mm2. One-way ANOVA with Tukey’s post hoc test (GtCCR4-3.0-EYFP: 0.4 mW/mm2 vs. 0.1 mW/mm2, p=1.03e-05, 0.4 mW/mm2 vs. 0.2 mW/mm2, p=4.39e-05; CrChR2[T159C]-mCherry: 0.4 mW/mm2 vs. 0.1 mW/mm2, p=0.0185). *p<0.05, **p<0.01, ***p<0.001, ns: not significant. Means and SEMs are indicated.
Figure 3—figure supplement 1.
Figure 3—figure supplement 1.. Latency of locomotion in ChR-expressing and non-expressing larvae.
The hindbrain of 3-dpf larvae expressing GtCCR4-3.0-EYFP, GtCCR4-MT, or KnChR-3.0-EYFP, and non-expressing sibling control larvae was irradiated with light (520 nm for GtCCR4-3.0-EYFP, GtCCR4-MT and 470 nm for KnChR-3.0-EYFP) for 100 ms. Six consecutive stimulation trials were analyzed for eight rhodopsin-expressing and non-expressing control larvae of each line (48 trials for each condition). Latency was measured as the tail movements observed within 8 s after the onset of light stimulation and plotted in a graph. The number of tail movements was 28 and 7 for GtCCR4-3.0-EYFP and the control, 24 and 4 for GtCCR4-MT and the control, and 25 and 4 for KnChR-3.0-EYFP and the control, respectively.
Figure 3—figure supplement 2.
Figure 3—figure supplement 2.. Latency and duration of locomotion induced with channelrhodopsins (ChRs) by light of various light intensities.
Latency (A) and duration (B) of evoked tail movements. The hindbrain area of 3-dpf Tg larvae expressing GtCCR4-3.0, KnChR-3.0, and CrChR2[T159C] and control larvae (non-expressing sibling larvae) were irradiated by light of different light intensities. Six consecutive stimulation trials were analyzed for eight rhodopsin-expressing and non-expressing (control) larvae of each Tg line. One-way ANOVA with Tukey’s post hoc test (latency GtCCR4-3.0-EYFP 0.4 mW/mm2 vs. 0.2 mW/mm2, p=0.00571; KnChR-3.0-EYFP 0.4 mW/mm2 vs. 0.2 mW/mm2, p=0.00553; 0.4 mW/mm2 vs. 0.1 mW/mm2, p=5.26e-06; 0.2 mW/mm2 vs. 0.1 mW/mm2, p=0.00469). **p<0.01, ***p<0.001, ns: not significant. Means and SEMs are indicated.
Figure 3—figure supplement 3.
Figure 3—figure supplement 3.. Optogenetic activation of hindbrain reticulospinal V2a neurons by CoChR and ChrimsonR.
(A) Light stimulation-dependent locomotion rates of 3-dpf Tg larvae expressing CoChR-tdTomato and ChrimsonR-tdTomato. The hindbrain area was irradiated with light (0.4 mW/mm2) with a wavelength of 470 nm (CoChR-tdTomato) or 520 nm (ChrimsonR-tdTomato) for 100 ms. Six consecutive stimulation trials were analyzed for eight rhodopsin-expressing and eight non-expressing (control) larvae of each Tg line. The average locomotion rates for each larva are shown. Wilcoxon rank-sum test (CoChR-tdTomato vs. control, p=0.000205; ChrimsonR vs. control, p=0.0509). (B–D) Latency (B), duration (C), and strength (D) of tail movements. Welch’s t-test (strength CoChR-tdTomato vs. ChrimsonR; p=0.00463). (E) Rate of locomotion induced with CoChR-tdTomato by light of various light intensities. **p<0.01, ***p<0.001, ns: not significant. Means and SEMs are indicated.
Figure 4.
Figure 4.. Cardiac arrest induced with GtCCR4-3.0, KnChR, CrChR2[T159C], and GtACR1.
(A) Expression of GtCCR4-3.0-EYFP, KnChR-3.0-EYFP, and GtACR1-EYFP in cardiomyocytes of Tg(myl7:GAL4FF);Tg(UAS-hsp70l:GtCCR4-3.0-EYFP, KnChR-3.0-EYFP, or GtACR1-EYFP, myl7:mCherry) larvae. 4-dpf Tg larvae were fixed and stained with anti-GFP (for EYFP, green) or anti-DsRed (for mCherry, magenta) antibodies. Z stacks of confocal images. (B) Heartbeat (HB) monitoring by changes in luminosity (AU, arbitrary units). The entire heart area of 4-dpf Tg larvae was irradiated with light (520 nm for GtCCR4 and GtACR1; 470 nm for KnChR and CrChR2) for 100 ms at a strength of 0.5 mW/mm2. (C) Average of relative HB frequency. The heart area was irradiated at the indicated periods. Six consecutive stimulus trials were analyzed for four rhodopsin-expressing larvae of each Tg line. Relative HB frequency was calculated from HB data during 1 s and 500 ms before and after each time point, so the change in the HB frequency was observed before light stimulation, even though cardiac arrest occurred during light stimulation. Gray shading indicates SEMs. Scale bar = 100 µm in (A).
Figure 5.
Figure 5.. Cardiac arrest and resumption of heartbeats with GtCCR4-3.0, KnChR, CrChR2[T159C], and GtACR1.
(A) Cardiac arrest rates of 4-dpf Tg larvae expressing GtCCR4-3.0-EYFP, KnChR-3.0-EYFP, CrChR2[T159C]-mCherry, or GtACR1-EYFP in cardiomyocytes. The heart area was irradiated with appropriate light (520 nm for GtCCR4 and GtACR1; 470 nm for KnChR and CrChR2) for 100 ms at a strength of 0.5 mW/mm2. Sibling larvae that did not express the rhodopsins were used as controls. Six consecutive stimulation trials were analyzed for four rhodopsin-expressing larvae and four control larvae of each Tg line, Wilcoxon rank-sum test (GtCCR4-3.0-EYFP, KnChR-3.0-EYFP, CrChR2[T159C]-mCherry, and GtACR1-EYFP, p=0.0131). (B, C) Latency to cardiac arrest (B) and time to resumption of HBs (C) after light stimulation with GtCCR4-3.0-EYFP, KnChR-3.0-EYFP, CrChR2[T159C]-mCherry, or GtACR1-EYFP. HB data were obtained from the experiments described above (A). One-way ANOVA with Tukey’s post hoc test (latency to cardiac arrest KnChR-3.0-EYFP vs. GtACR1-EYFP, p=0.00144; CrChR2[T159C]-mCherry vs. GtACR1-EYFP, p=0.0190; time to resumption of heartbeat GtCCR4-3.0-EYFP vs. GtACR1-EYFP, p=0.000786; KnChR-3.0-EYFP vs. GtACR1-EYFP, p=0.0189; CrChR2[T159C]-mCherry vs. GtACR1-EYFP, p=0.000236). (D) Light intensity dependence of cardiac arrest rates of 4-dpf Tg larvae expressing GtCCR4-3.0-EYFP, KnChR-3.0-EYFP, CrChR2[T159C]-mCherry, GtACR1-EYFP in cardiomyocytes. The heart area was irradiated with light (520 nm for GtCCR4 and GtACR1; 470 nm for KnChR and CrChR2) for 100 ms at a strength of 0.5, 0.2, or 0.05 mW/mm2. Six consecutive stimulation trials were analyzed for four rhodopsin-expressing larvae of each Tg line. One-way ANOVA with Tukey’s post hoc test (GtCCR4-3.0-EYFP: 0.5 mW/mm2 vs. 0.05 mW/mm2; p=0.0222). (E, F) Changes in fluorescence intensity of GCaMP6s (ΔF/F) in the heart of 4-dpf Tg larvae expressing KnChR-3.0-EYFP and GCaMP6s (E), or GtACR1-EYFP and GCaMP6s (F). Sibling larvae that did not express the rhodopsins were used as the control. The heart area of Tg larvae was stimulated with a fluorescence detection filter (excitation 470–495 nm, emission 510–550 nm). Two rhodopsin-expressing larvae (green) and two control larvae (black) were analyzed for each rhodopsin. Three trials were analyzed for each larva. The linear mixed-effects model was used for statistical analysis. *p<0.05, **p<0.01, ***p<0.001, ns: not significant. Means and SEMs are indicated.
Figure 5—figure supplement 1.
Figure 5—figure supplement 1.. Cardiac arrest induced with channelrhodopsins (ChRs) by light of various intensities.
Latency to cardiac arrest (A) and time to resumption of heartbeats (B) after light stimulation with ChRs. The heart area of 4-dpf Tg larvae expressing GtCCR4-3.0-EYFP, KnChR-3.0-EYFP, CrChR2[T159C]-mCherry, or GtACR1-EYFP was irradiated with light (520 nm for GtCCR4, GtACR1; 470 nm for KnChR, CrChR2) for 100 ms at a strength of 0.5, 0.2, or 0.05 mW/mm2. Six consecutive stimulation trials were analyzed for four rhodopsin-expressing larvae of each Tg line. One-way ANOVA with Tukey’s post hoc test (time to resumption of heartbeat GtACR1-EYFP 0.5 mW/mm2 vs. 0.05 mW/mm2, p=0.0240). *p<0.05, ns: not significant. Means and SEMs are indicated.
Figure 5—figure supplement 2.
Figure 5—figure supplement 2.. Cardiac arrest induced with CoChR and ChrimsonR.
(A) Cardiac arrest rate. The heart area of 4-dpf Tg larvae expressing CoChR-tdTomato or ChrimsonR-tdTomato was irradiated with light (470 nm for CoChR; 520 nm for ChrimsonR) for 100 ms at a strength of 0.5, 0.2, or 0.05 mW/mm2. Six consecutive stimulation trials were analyzed for four rhodopsin-expressing larvae of each Tg line. (B, C) Latency to cardiac arrest (B) and time to resumption of heartbeats (C) after light stimulation with optogenetic tools. One-way ANOVA with Tukey’s post hoc test was used for statistical analysis. ns: not significant. Means and SEMs are indicated.
Figure 6.
Figure 6.. Optogenetic activation of hindbrain reticulospinal V2a neurons with BeGC1-EGFP.
(A) Expression of BeGC1-EGFP in the hindbrain reticulospinal V2a neurons. 3-dpf Tg(vsx2:GAL4FF);Tg(UAS:BeGC1-EGFP, myl7:mCherry);Tg(UAS:RFP) larvae were fixed and stained with anti-GFP (EGFP, green) or anti-DsRed (RFP, magenta) antibodies. Inset: higher magnification images for the boxed area showing double-labeled neurons. In the inset, fluorescence signal intensities were modified to compare the subcellular localization of the tools. (B) Tail movements of 3-dpf Tg larvae expressing BeGC1 in the reticulospinal V2a neurons after stimulation with light (0.4 mW/mm2) at 520 nm for 500 ms. The stimulation started at time 0 s. A typical induced tail movement is shown. (C) Light stimulation-dependent locomotion rates of 3-dpf BeGC1-expressing larvae or non-expressing sibling control larvae. Six consecutive stimulation trials were analyzed for eight BeGC1-expressing and eight non-expressing larvae. The average locomotion rates for each larva are shown. Wilcoxon rank-sum test (BeGC1-EGFP vs. control, p=0.00608). (D–F) Latency (D), duration (E), and strength (F) of induced tail movements in the BeGC1-expressing larvae. The time from the start of light stimulation to the first tail movement was defined as latency (s), and the time from the start of the first tail movement to the end of that movement was defined as duration (s). The maximum distance that the caudal fin moved from the midline divided by body length reflected its strength. Scale bars = 150 μm in (A), 10 μm in the insets of (A). **p<0.01. Means and SEMs are indicated.
Figure 7.
Figure 7.. Optogenetic activation of reticulospinal V2a neurons with bPAC and OaPAC.
(A) Expression of bPAC and OaPAC in reticulospinal V2a neurons. 3-dpf Tg(vsx2:GAL4FF);Tg(UAS-hsp70l:bPAC-MT-T2A-tDimer, myl7:mCherry);Tg(UAS;RFP) and Tg(vsx2:GAL4FF);Tg(UAS-hsp70l:OaPAC-Flag-P2A-TagCFP, myl7:mCherry);Tg(UAS:RFP) larvae were fixed and stained with anti-Myc or anti-Flag (green), and anti-DsRed (RFP, magenta) antibodies. To detect relatively weak fluorescent signals of bPAC-MT and OaPAC-Flag, images were taken with increased laser power (2× for bPAC-MT and 4× for OaPAC-Flag compared to BeGC1-EGFP in Figure 6A). Inset: higher magnification images for the boxed areas showing double-labeled neurons. (B) Tail movements of 3-dpf Tg larvae expressing bPAC-MT or OaPAC-Flag in the reticulospinal V2a neurons after stimulation with light (0.4 mW/mm2) at 470 nm for 500 ms. The stimulation started at time 0 s. Typical examples are shown. (C) Light-induced locomotion rates. Larvae that did not express PACs were used as controls. Six consecutive stimulation trials for eight PAC-expressing and eight control larvae were analyzed. The average locomotion rates for each larva are shown. Wilcoxon rank-sum test (bPAC-MT vs. control, p=0.0376; OaPAC-Flag vs. control, p=0.145). (D–F) Latency (D), duration (E), and strength (F) for light stimulus-induced tail movements in larvae expressing bPAC-MT or OaPAC-Flag. The data for each larva are plotted in graphs. (G, H) Changes in fluorescence intensity (ΔF/F) of cAMP indicator Flamido2 in neurons of Tg larvae expressing bPAC-MT (G) or OaPAC-Flag (H) after light stimulation. The entire optic tectum area of 3-dpf Tg(elavl3:GAL4-VP16); Tg(elavl3:Flamindo2); Tg(UAS-hsp70l:bPAC-MT-T2A-tDimer) and Tg(elavl3:GAL4-VP16); Tg(elavl3:Flamindo2); Tg(UAS-hsp70l:OaPAC-Flag-P2A-TagCFP) larvae was stimulated with a fluorescence detection filter (excitation 470–495 nm, emission 510–550 nm). The fluorescence intensity of the optic tectum was measured, and ΔF/F was calculated. Sibling larvae that did not express PACs were used as controls. Three trials for two PAC-expressing (green) and two control (black) larvae were analyzed, and the data from a total of six trials are plotted on graphs. The linear mixed-effects model was used. Scale bars = 150 μm in (A), 10 μm in insets of (A). *p<0.05, ***p<0.001, ns: not significant. Means and SEMs are indicated.
Figure 7—figure supplement 1.
Figure 7—figure supplement 1.. Latency of locomotion in PAC-expressing and non-expressing larvae.
The hindbrain of 3-dpf larvae expressing bPAC or OaPAC, and non-expressing sibling control larvae was irradiated with 470 nm light for 500 ms. Six consecutive stimulation trials were analyzed for eight PAC-expressing and eight non-expressing control larvae of each line (48 trials for each condition). Latency was measured as the tail movements observed within 30 s after the onset of light stimulation and plotted in a graph. The number of the tail movements were 32 and 13 for bPAC and the control, and 26 and 13 for OaPAC and the control.
Figure 7—figure supplement 2.
Figure 7—figure supplement 2.. Optogenetic control of the heart by bPAC or OaPAC.
(A) Expression of bPAC-MT or OaPAC-Flag in cardiomyocytes. 4-dpf larvae expressing bPAC-MT or OaPAC-Flag were fixed and stained with anti-Myc or Flag (green), and anti-DsRed (mCherry, magenta) antibodies. (B, C) Heartbeats (HBs) monitored by luminosity (AU), changes (B), and relative HB frequency (C) of bPAC-expressing larvae. The heart area of Tg larvae expressing bPAC was irradiated with light (0.5 mW/mm2) of 470 nm for 5 s at the indicated periods. Similar results were obtained from four Tg larvae. A typical example from one larva is shown in (B), and average HB frequency of the first or second trial showing a typical pattern for the four larvae is shown in (C). The larvae showed induced bradycardia in the third through sixth trials. Scale bar = 100 μm in (A).

Update of

  • doi: 10.1101/2022.10.25.513731

References

    1. Antinucci P, Dumitrescu A, Deleuze C, Morley HJ, Leung K, Hagley T, Kubo F, Baier H, Bianco IH, Wyart C. A calibrated optogenetic toolbox of stable zebrafish opsin lines. eLife. 2020;9:eLife. doi: 10.7554/eLife.54937. - DOI - PMC - PubMed
    1. Asakawa K, Suster ML, Mizusawa K, Nagayoshi S, Kotani T, Urasaki A, Kishimoto Y, Hibi M, Kawakami K. Genetic dissection of neural circuits by Tol2 transposon-mediated Gal4 gene and enhancer trapping in zebrafish. PNAS. 2008;105:1255–1260. doi: 10.1073/pnas.0704963105. - DOI - PMC - PubMed
    1. Avelar GM, Schumacher RI, Zaini PA, Leonard G, Richards TA, Gomes SL. A rhodopsin-guanylyl cyclase gene fusion functions in visual perception in A fungus. Current Biology. 2014;24:1234–1240. doi: 10.1016/j.cub.2014.04.009. - DOI - PMC - PubMed
    1. Bernal Sierra YA, Rost BR, Pofahl M, Fernandes AM, Kopton RA, Moser S, Holtkamp D, Masala N, Beed P, Tukker JJ, Oldani S, Bönigk W, Kohl P, Baier H, Schneider-Warme F, Hegemann P, Beck H, Seifert R, Schmitz D. Potassium channel-based optogenetic silencing. Nature Communications. 2018;9:4611. doi: 10.1038/s41467-018-07038-8. - DOI - PMC - PubMed
    1. Berndt A, Schoenenberger P, Mattis J, Tye KM, Deisseroth K, Hegemann P, Oertner TG. High-efficiency channelrhodopsins for fast neuronal stimulation at low light levels. PNAS. 2011;108:7595–7600. doi: 10.1073/pnas.1017210108. - DOI - PMC - PubMed

Publication types