. 2023 Oct 2;222(10):e202112143.
doi: 10.1083/jcb.202112143. Epub 2023 Aug 17.

Cooperative regulation of C1-domain membrane recruitment polarizes atypical protein kinase C

Affiliations

Cooperative regulation of C1-domain membrane recruitment polarizes atypical protein kinase C

Kimberly A Jones et al. J Cell Biol. .

Abstract

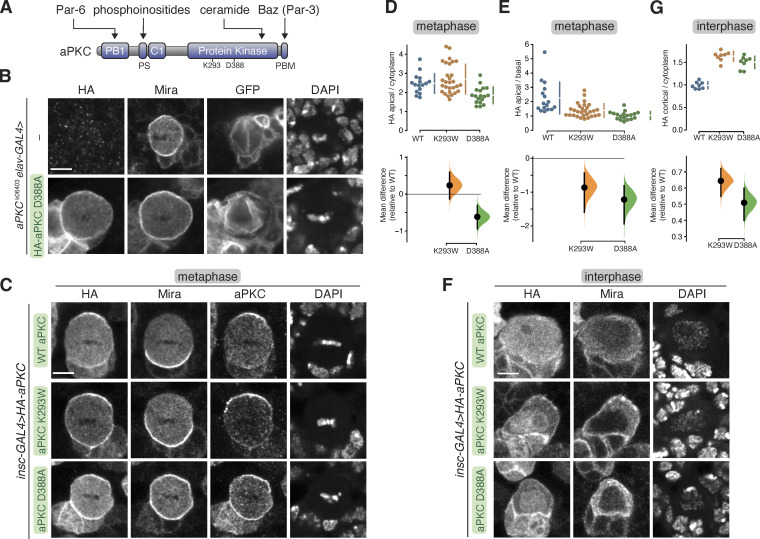
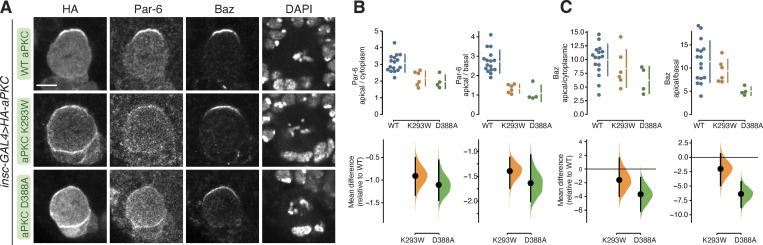
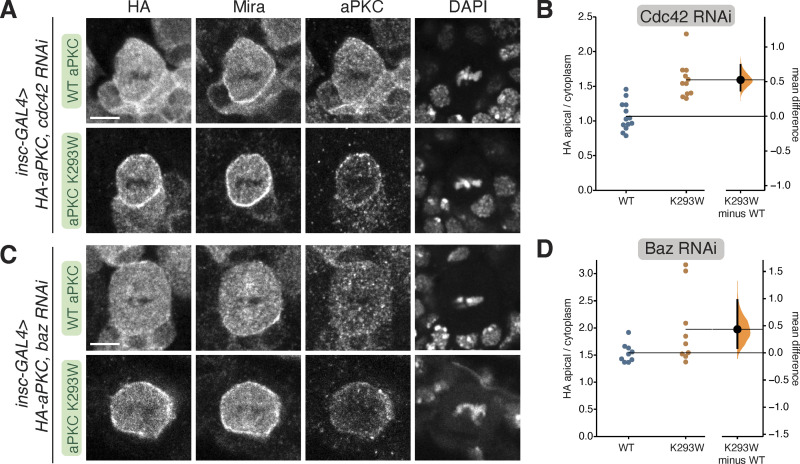
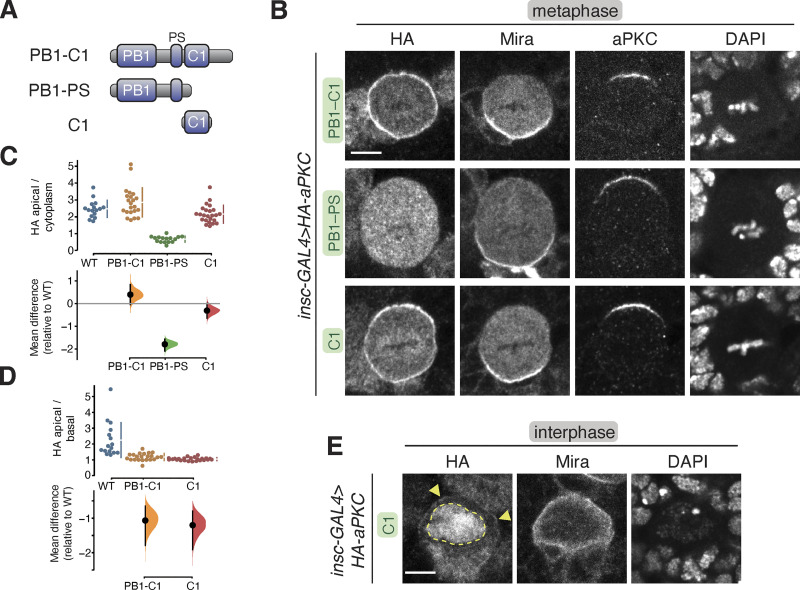
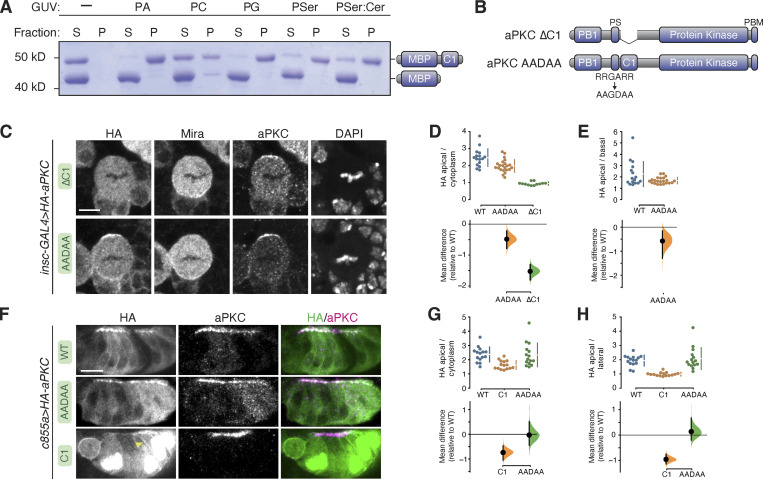
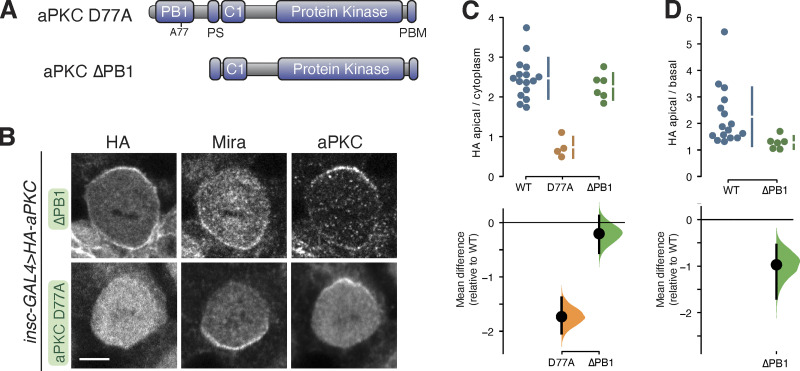
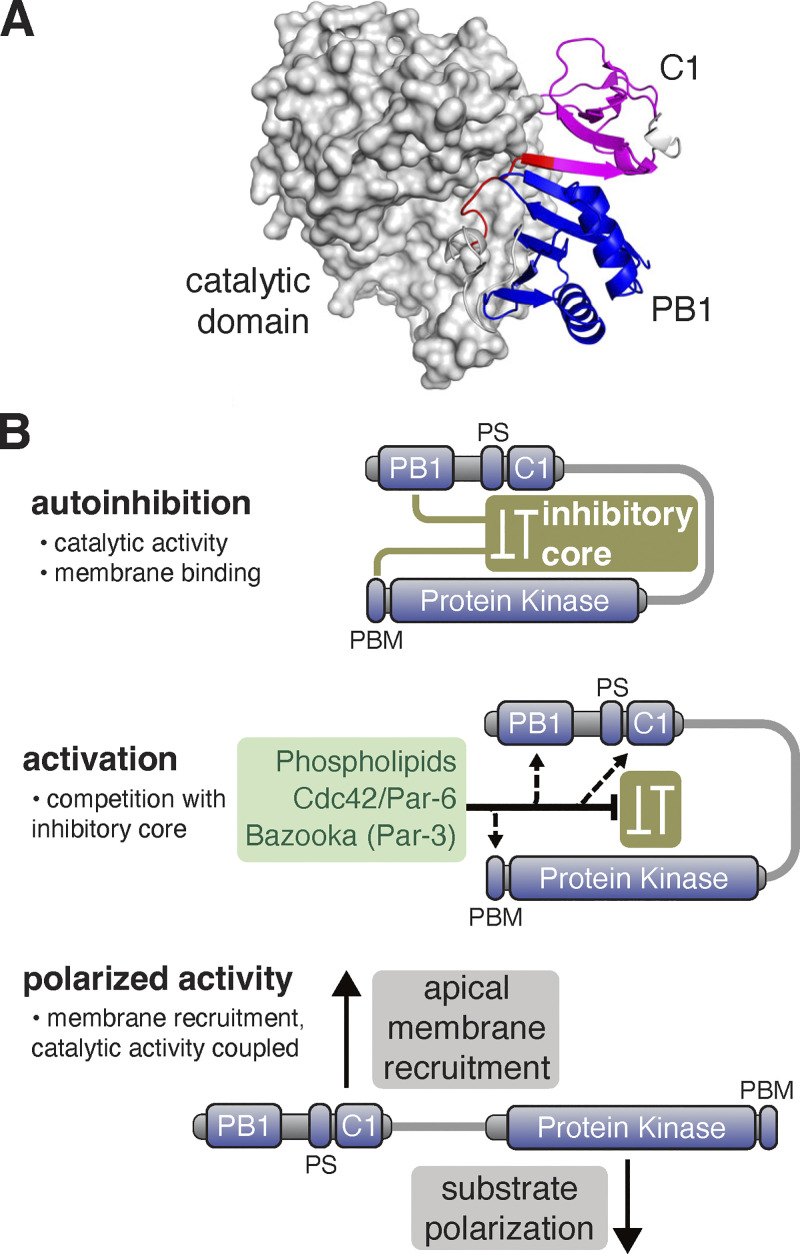
Recruitment of the Par complex protein atypical protein kinase C (aPKC) to a specific membrane domain is a key step in the polarization of animal cells. While numerous proteins and phospholipids interact with aPKC, how these interactions cooperate to control its membrane recruitment has been unknown. Here, we identify aPKC's C1 domain as a phospholipid interaction module that targets aPKC to the membrane of Drosophila neural stem cells (NSCs). The isolated C1 binds the NSC membrane in an unpolarized manner during interphase and mitosis and is uniquely sufficient among aPKC domains for targeting. Other domains, including the catalytic module and those that bind the upstream regulators Par-6 and Bazooka, restrict C1's membrane targeting activity-spatially and temporally-to the apical NSC membrane during mitosis. Our results suggest that aPKC polarity results from cooperative activation of autoinhibited C1-mediated membrane binding activity.


Conflict of interest statement

Disclosures: The authors declare no competing interests exist.

Figures

Figure 1.
Figure 1.
Localization of aPKC with kinase inactivating mutations in larval brain NSCs. (A) Domain structure of aPKC showing the location of PB1, PS (pseudosubstrate), C1, kinase domain, PBM (PDZ binding motif), along with the location of K293 and D388 residues. (B) Localization of HA-tagged aPKC harboring the D388A kinase inactivating mutation in metaphase, positively marked (mCD8-GFP) aPKCk06403 mutant larval brain NSC with an aPKCK06403 mutant larval brain NSC shown for comparison. Nucleic acids are shown with DAPI. The scale bar is 5 µm in all panels. (C) Localization of HA-tagged aPKC harboring either the D388A or K293W kinase inactivation mutations in metaphase larval brain NSCs with endogenous aPKC. The basal cortical marker Miranda, total aPKC (“aPKC,” endogenous and exogenously expressed) and nucleic acid (DAPI) are also shown. (D and E) Gardner-Altman estimation plots of the effect of the D388A and K293W mutations on metaphase aPKC membrane recruitment. Apical cortical to cytoplasmic (D) and apical/basal (E) signal intensities of anti-HA signals are shown for individual metaphase NSCs expressing either HA-WT or HA-D388A or HA-K293W aPKC. The error bar in the upper graph represents one standard deviation (gap is mean); the error bar in the lower graph represents bootstrap 95% confidence interval; n = 16 (from six distinct larval brains), 29 (8), 18 (4) for WT, K293W, D388A, respectively. (F) Localization of HA-tagged aPKC harboring either the D388A or K293W kinase inactivation mutations in interphase larval brain NSCs with endogenous aPKC. The basal cortical marker Miranda and nucleic acid (DAPI) are also shown. (G) Gardner–Altman estimation plot of the effect of the D388A and K293W mutations on interphase aPKC membrane recruitment. Cortical to cytoplasmic cortical signal intensities of anti-HA signals are shown for individual metaphase NSCs expressing either HA-WT or HA-D388A or HA-K293W aPKC. The error bar in upper graph represents one standard deviation (gap is mean); the error bar in the lower graph represents bootstrap 95% confidence interval; n = 8 for WT (from three distinct larval brains), K293W (3), and D388A (2).
Figure 2.
Figure 2.
Localization of Bazooka and Par-6 in larval brain NSCs expressing kinase-inactive aPKCs. (A) Localization of Par-6 and Bazooka (Baz) in metaphase larval brain NSCs expressing HA-tagged aPKC D388A or aPKC K293W. Nucleic acids are shown with DAPI. Scale bar is 5 µm. (B and C) Gardner–Altman estimation plots of the effect of expressing aPKC D388A or aPKC K293W on Par-6 (B) or Baz (C) cortical localization and polarity. Apical cortical to cytoplasmic or basal cortical signal intensities of cortical and cytoplasmic signals are shown for individual metaphase NSCs expressing either HA-WT or HA-D388A or HA-K293W aPKC. The error bar in the upper graphs represents one standard deviation (gap is mean); the error bar in lower graphs represents bootstrap 95% confidence interval; n = 16 (from three distinct larval brains), 6 (3), 4 (3) for WT, K293W, D388A, respectively (Par-6) and 16, 6, 4 for Baz.
Figure 3.
Figure 3.
Cortical localization of kinase-inactive aPKC in NSCs lacking Bazooka or Cdc42. (A) Localization of HA-tagged aPKC K293W in metaphase larval brain NSCs expressing an RNAi directed against Cdc42. The scale bar is 5 µm in all panels. (B) Gardner–Altman estimation plots of the effect of expressing Cdc42 RNAi on WT and K293W aPKC cortical localization. Apical cortical to cytoplasmic signal intensities of anti-HA signals are shown for individual metaphase NSCs expressing either HA-WT or HA-K293W aPKC. Error bar represents bootstrap 95% confidence interval; n = 13 (from five distinct larval brains), 11 (5) for WT, and K293W, respectively. (C) Localization of HA-tagged aPKC K293W in metaphase larval brain NSCs expressing an RNAi directed against Bazooka. (D) Gardner–Altman estimation plots of the effect of expressing Baz RNAi on WT and K293W aPKC cortical localization. Apical cortical to cytoplasmic signal intensities of anti-HA signals are shown for individual metaphase NSCs expressing either HA-WT or HA-K293W aPKC. Error bar represents bootstrap 95% confidence interval; n = 9 (from two distinct larval brains), 9 (6) for WT and K293W, respectively.
Figure 4.
Figure 4.
Localization of the aPKC regulatory domain in larval brain NSCs. (A) aPKC regulatory domain fragments. (B) Localization of HA-tagged aPKC regulatory domain fragments in metaphase larval brain NSCs. The basal marker Miranda, endogenous aPKC (using an antibody that does not react with the regulatory domain), and nucleic acids (DAPI) are shown for comparison. Scale bar is 5 µm. (C and D) Gardner–Altman estimation plot of aPKC regulatory domain cortical localization (C) and polarity (D). Apical cortical to cytoplasmic (C) and apical cortical to basal cortical signal intensity ratios (D) of anti-HA signals are shown for individual metaphase NSCs expressing either aPKC PB1-C1, PB1-PS, or C1 regulatory domain fragments. The data for wild type is the same as in Fig. 1. Apical to basal ratios are only shown for proteins with detectable membrane signals. Error bar in the upper graphs represents one standard deviation (gap is mean); the error bar in the lower graphs represents bootstrap 95% confidence interval; n = 16 (from six distinct larval brains), 22 (6), 16 (5), 24 (9) for WT, PB1-C1, PB1-PS, and C1, respectively. (E) Localization of the HA-tagged aPKC C1 domain in interphase larval brain NSCs. Arrowheads highlight the membrane signal, and the nuclear signal is outlined by a dashed line.
Figure 5.
Figure 5.
Phospholipid binding of aPKC C1 domain and role of C1 and PS domains in aPKC localization in larval brain NSCs and epithelia. (A) Binding of a maltose binding protein (MBP) fusion of the aPKC C1 domain to phospholipids. Supernatant (S) and pellet (P) fractions from cosedimentation with Giant Unilamellar Vesicles (GUVs) of the indicated phospholipid composition are shown (PA, phosphatidic acid; PC, phosphatidyl choline; PG, phosphatidyl glycerol; PSer, phosphatidyl serine; PSer:Cer, phosphatidyl serine mixture with ceramide). MBP alone is included as an internal negative control. (B) Schematics of ∆C1 and AADAA aPKC variants. (C) Localization of HA-tagged aPKC ∆C1 and AADAA variants in metaphase larval brain NSCs. The basal marker Miranda, total aPKC (expressed variant and endogenous), and nucleic acids (DAPI) are shown for comparison. The scale bar is 5 µm. (D and E) Gardner–Altman estimation plots of aPKC AADAA and ∆C1 cortical localization in NSCs. Apical cortical to cytoplasmic (D) or apical to basal (E) signal intensity ratios of anti-HA signals are shown for individual metaphase NSCs expressing either aPKC AADAA or ∆C1. The data for wild type is the same as in Fig. 1. Apical to basal ratios are only shown for proteins with detectable membrane signals. Error bar in the upper graphs represents one standard deviation (gap is mean); error bar in the lower graphs represents bootstrap 95% confidence interval; n = 16 (from six distinct larval brains), 22 (8), and 12 (5) for WT, AADAA, and ∆C1, respectively. (F) Localization of HA-tagged aPKC ∆C1 and AADAA variants in larval brain inner proliferation center (IPC) epithelium. Arrowhead highlights aPKC C1 localization at the lateral membrane. As in interphase NSC cells, the C1 is highly enriched in the epithelial nuclei. Scale bar is 5 µm. (G and H) Gardner–Altman estimation plots of aPKC AADAA and C1 cortical localization in IPC epithelial cells. Apical cortical to cytoplasmic (D) or apical to lateral (E) signal intensity ratios of anti-HA signals are shown for individual epithelial cells from the IPC expressing either aPKC AADAA or C1. Error bar in upper graphs represents one standard deviation (gap is mean); error bar in lower graphs represents bootstrap 95% confidence interval; n = 16 (from three distinct larval brains), 15 (3), and 15 (3) for WT, C1, and AADAA, respectively. Source data are available for this figure: SourceData F5.
Figure 6.
Figure 6.
Localization of aPKC with PB1 domain perturbations in larval brain NSCs. (A) Schematics of D77A and ∆PB1 aPKC variants. (B) Localization of HA-tagged aPKC D77A and ∆PB1 variants in metaphase larval brain NSCs. The basal marker Miranda, and total aPKC (expressed variant and endogenous), are shown for comparison. Scale bar is 5 µm. (C and D) Gardner-Altman estimation plots of aPKC D77A and ∆PB1 cortical localization. Apical cortical to cytoplasmic (C) or apical to basal (D) signal intensity ratios of anti-HA signals are shown for individual metaphase NSCs expressing either aPKC D77A or ∆PB1. The data for wild type is the same as in Fig. 1. Apical to basal ratios are only shown for proteins with detectable membrane signal. The error bar in the upper graphs represents one standard deviation (gap is mean); the error bar in lower graphs represents bootstrap 95% confidence interval; n = 16 (from six distinct larval brains), 4 (1), and 6 (4) for WT, D77A, and ∆PB1, respectively.
Figure 7.
Figure 7.
Model for regulation of aPKC activity and membrane recruitment. (A) Alphafold database structure (UNIPROT: A1Z9X0) of aPKC showing the putative supramolecular architecture of PB1 (blue), PS (red), and C1 (magenta) domains and interaction of both domains with the catalytic domain. (B) Model for cooperative polarization and activation of aPKC. An inhibitory core couples repression of catalytic activity (protein kinase domain) to membrane localization (C1 with some contribution from PS). The PB1 and PBM are also coupled to the inhibitory core to allow for cooperative activation by Cdc42/Par-6 binding to the PB1 and Baz binding to the PBM. Disruption of the inhibitory core leads to spatially (apical) and temporally (mitotic) regulated localization and activation of catalytic activity.

Similar articles

Cited by

References

    1. Ahuja, L.G., Taylor S.S., and Kornev A.P.. 2019. Tuning the “violin” of protein kinases: The role of dynamics-based allostery. IUBMB Life. 71:685–696. 10.1002/iub.2057 - DOI - PMC - PubMed
    1. Atwood, S.X., Chabu C., Penkert R.R., Doe C.Q., and Prehoda K.E.. 2007. Cdc42 acts downstream of Bazooka to regulate neuroblast polarity through Par-6 aPKC. J. Cell Sci. 120:3200–3206. 10.1242/jcs.014902 - DOI - PMC - PubMed
    1. Atwood, S.X., and Prehoda K.E.. 2009. aPKC phosphorylates Miranda to polarize fate determinants during neuroblast asymmetric cell division. Curr. Biol. 19:723–729. 10.1016/j.cub.2009.03.056 - DOI - PMC - PubMed
    1. Bailey, M.J., and Prehoda K.E.. 2015. Establishment of Par-polarized cortical domains via phosphoregulated membrane motifs. Dev. Cell. 35:199–210. 10.1016/j.devcel.2015.09.016 - DOI - PMC - PubMed
    1. Cameron, A.J.M., Escribano C., Saurin A.T., Kostelecky B., and Parker P.J.. 2009. PKC maturation is promoted by nucleotide pocket occupation independently of intrinsic kinase activity. Nat. Struct. Mol. Biol. 16:624–630. 10.1038/nsmb.1606 - DOI - PubMed

Publication types

LinkOut - more resources