. 2023 Aug 29;42(8):112983.
doi: 10.1016/j.celrep.2023.112983. Epub 2023 Aug 16.

The C9ORF72 repeat expansion alters neurodevelopment

Affiliations

The C9ORF72 repeat expansion alters neurodevelopment

Eric Hendricks et al. Cell Rep. .

Abstract

Genetic mutations that cause adult-onset neurodegenerative diseases are often expressed during embryonic stages, but it is unclear whether they alter neurodevelopment and how this might influence disease onset. Here, we show that the most common cause of frontotemporal dementia (FTD) and amyotrophic lateral sclerosis (ALS), a repeat expansion in C9ORF72, restricts neural stem cell proliferation and reduces cortical and thalamic size in utero. Surprisingly, a repeat expansion-derived dipeptide repeat protein (DPR) not known to reduce neuronal viability plays a key role in impairing neurodevelopment. Pharmacologically mimicking the effects of the repeat expansion on neurodevelopment increases susceptibility of C9ORF72 mice to motor defects. Thus, the C9ORF72 repeat expansion stunts development of the brain regions prominently affected in C9ORF72 FTD/ALS patients.

Keywords: C9ORF72; CP: Neuroscience; amyotrophic lateral sclerosis; frontotemporal dementia; induced pluripotent stem cells; neural stem cells; neurodevelopment.


Conflict of interest statement

Declaration of interests J.K.I. is a co-founder of AcuraStem, Inc. and Modulo Bio. J.K.I. is on the scientific advisory board of AcuraStem, Inc.; Spinogenix; and Vesalius Therapeutics. J.K.I. is an employee of BioMarin Pharmaceutical. J.K.I. is a co-founder of Modulo Bio and serves on the scientific advisory board of Spinogenix. Named companies were not involved in this project.

Figures
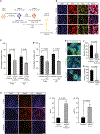
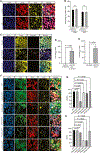
Figure 1.
Figure 1.. C9ORF72 FTD/ALS neural stem cells exhibit poor self-renewal and precocious differentiation
(A) Schematic of neural stem and progenitor cell induction and timing of immunocytochemistry analysis for PAX6, KI67, and MAP2. (B) Representative immunocytochemistry images of the percentages of PAX6+ and KI67+ neural stem and progenitor cells in control, C9ORF72 FTD/ALS, and isogenic control (corrected) lines after MACS purification of PSA-NCAM+ cells on day 10 of neural differentiation and 5 additional days of culture with EGF and FGF. Scale bars, 25 μm. (C) Quantification of the percentages of PAX6+ and KI67+ neural stem and progenitor cells in control and C9ORF72 FTD/ALS lines after 5 additional days of culture with EGF and FGF after MACS purification of PSA-NCAM+ cells. (D) Quantification of the percentages of PAX6+ and KI67+ neural stem and progenitor cells in the corrected or C9ORF72 FTD/ALS line 1 after 5 additional days of culture with EGF and FGF after MACS purification of PSA-NCAM+ cells. (C and D) Data are shown as mean ± SEM and were analyzed using a 2-way ANOVA with Sidak’s correction. (E) Representative immunocytochemistry images of rosette-like structures of PAX6+ cells in control, C9ORF72 FTD/ALS, and corrected lines after MACS purification of PSA-NCAM+ cells on day 10 of neural differentiation and 5 additional days of culture with EGF and FGF. Scale bars, 100 μm. Examples of manually counted rosettes are outlined. (F) Quantification of the total number of PAX6+ rosette-like structures formed in control or C9ORF72 FTD/ALS cultures. Quantification of the total number of PAX6+ rosette-like structures formed in corrected or C9ORF72 FTD/ALS line 1 cultures. (F and G) Data are shown as mean ± SEM and were analyzed using an unpaired t test. Each independent differentiation was used as a data point. (H) Representative immunocytochemistry images of the number of MAP2+ neurons in control, C9ORF72 FTD/ALS, and corrected line cultures after MACS purification of PSA-NCAM+ cells on day 10 of neural differentiation and 20 additional days of culture with EGF and FGF. Scale bars, 100 μm. (I) Quantification of the total number of MAP2+ neurons formed in control or C9ORF72 FTD/ALS cultures on day 30 with EGF and FGF. (J) Quantification of the total number of MAP2+ neurons formed in corrected or C9ORF72 FTD/ALS cultures at day 30 with EGF and FGF. (I and J) Data are shown as mean ± SEM and were analyzed using an unpaired t test. (A–J) The data points for each group include 3 independent differentiations with 2 technical replicates from each line. Each independent differentiation was used as a data point.
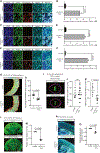
Figure 2.
Figure 2.. Poly(AP) and other C9ORF72 DPRs impair neural stem cell self-renewal
(A) Representative images of the percentages of PAX6+ cells in control and C9ORF72−/− cultures after MACS purification of PSA-NCAM+ cells on day 10 of neural differentiation and 5 additional days of culture with EGF and FGF. Scale bars, 25 μm. (B) Quantification of the percentages of PAX6+ and KI67+ neural stem and progenitor cells in control and C9ORF72−/− cultures on day 15 with EGF and FGF. Data are shown as the mean ± SEM and were analyzed using an unpaired t test. n.s., not significant. (C) Representative immunocytochemistry images of poly(AP) levels in control, C9ORF72 FTD/ALS, or corrected cultures on day 10 of neural differentiation. Scale bars, 30 μm. (D) Quantification of poly(AP) intensity normalized to cell area in PAX6+ cells from control or C9ORF72 FTD/ALS cultures on day 10 of neural differentiation. (E) Quantification of poly(AP) intensity normalized to cell area in PAX6+ cells from corrected or C9ORF72 FTD/ALS line 1 cultures on day 10 of neural differentiation. (D and E) Data are shown as mean ± SEM and were analyzed with an unpaired t test (D) or a Mann-Whitney unpaired t test (E). (F) Representative immunocytochemistry images of the percentages of PAX6+ and Ki67+ cells in control line cultures after MACS purification of PSA-NCAM+ cells on day 10 of neural differentiation; transduction with GFP, GA(50)-GFP, AP(50)-GFP, GR(50)-GFP, PR(50)-GFP, or (GP)50-GFP; and 5 additional days of culture with EGF and FGF. Outlines depict cells that are PAX6 negative or KI67 negative in cells transduced with AP(50)-GFP and PR/GR(50)-GFP, respectively. Scale bars, 25 μm. (G and H) Quantification of immunocytochemical analysis of the percentages of PAX6+ (G) and Ki67+ (H) cells in control line cultures after MACS purification of PSA-NCAM+ cells and transduction with GFP or DPR-GFP lentiviruses on day 10 of neural differentiation and 5 additional days of culture with EGF and FGF. Values are represented as the mean ± SEM and were analyzed using a one-way ANOVA (G) or Kruskal-Wallis test (H). (A–H) The data points for each group include 3 independent differentiations with 2 technical replicates per line per condition. Each independent differentiation was used as a data point.
Figure 3.
Figure 3.. Poly(AP) impairs neural stem cell maintenance through LRRC47
(A) Representative western blot image of endogenous LRRC47 co-immunoprecipitated with GFP, untransfected control, AP(50)-GFP, or PR(50)-GFP from HEK293T cells using an anti-GFP antibody. (B) Quantification of western blot analysis of LRRC47 levels co-immunoprecipitated with GFP, untransfected control, AP(50)-GFP, or PR(50)-GFP using an anti-GFP antibody. Data are shown as the amount of LRRC47 co-immunoprecipitated normalized to the amount of GFP immunoprecipitated for each sample. Data points for each group consist of 3 independent transfections with 3 technical replicates for each transfection. LRRC47 levels were normalized to total protein for each sample. Mean ± SEM. Unpaired t test. (C) Representative western blot image of endogenous RPS6 co-immunoprecipitated with a LRRC47-FLAG-mCherry fusion protein in HEK293T cells overexpressing GFP or AP(50)-GFP. Co-immunoprecipitation with FLAG-mCherry was used as a control for any potential interaction between RPS6 and FLAG-mCherry. (D) Quantification of western blot analysis of the RPS6 levels co-immunoprecipitated with either LRRC47-FLAG-mCherry or FLAG-mCherry in HEK293T cells overexpressing GFP or AP(50)-GFP. Data points for each group consist of 3 independent transfections. Each independent differentiation was used as a data point. RPS6 levels were normalized to total protein for each sample. Mean ± SEM. One-way ANOVA with Tukey’s correction. (E) Representative images of homopropargylglycine (HPG)-Alexa Fluor 594 incorporation into control MACS-purified PSA-NCAM+ cells after transduction with GFP or AP(50)-GFP lentiviruses and further culture for 5 days with EGF and FGF. Scale bar, 10 μm. (F) Quantification of HPG incorporation into newly synthesized proteins in control MACS-purified PSA-NCAM+ cells. Data points consist of 2 independent differentiations from 4 different control lines with 2 technical replicates per line per condition. Each independent differentiation was used as a data point. Mean ± SEM. Unpaired t test. (G–I) Representative immunocytochemistry images (G), relative LRRC47 mRNA levels after ASO treatment (H), and quantification (I) of the percentage of PAX6+ cells in control line cultures after MACS purification of PSA-NCAM+ cells and treatment with scrambled or LRRC47-suppressing ASOs on day 10 of neural differentiation and 5 additional days of culture with EGF and FGF. Mean ± SEM. The data points for each group include 2 independent differentiations per line per condition (4 control lines). Each independent differentiation was used as a data point. One-way ANOVA with Dunnett’s correction. Scale bars, 25 μm. (J and K) Representative immunocytochemistry images (J) and quantification (K) of the percentage of PAX6+ cells in control or C9ORF72 FTD/ALS cultures after MACS purification of PSA-NCAM+ cells and transduction with mCherry- or LRRC47-mCherry-encoding lentiviruses on day 10 of neural differentiation and 5 additional days of culture with EGF and FGF. Mean ± SEM. The data points for each group include 2 independent differentiations with 2 technical replicates per line per condition. Each independent differentiation was used as a data point. Unpaired t test. Scale bars, 15 μm. (L and M) Representative immunocytochemistry images (L) and quantification (M) of the percentage of PAX6+ cells in control line cultures after MACS purification of PSA-NCAM+ cells and transduction with lentiviruses encoding AP(50)-GFP and either LRRC47-mCherry, mCherry alone, or no additional lentivirus on day 10 of neural differentiation and 5 additional days of culture with EGF and FGF. The data points for each group include 2 independent differentiations per line per condition. Each independent differentiation was used as a data point. Mean ± SEM. One-way ANOVA with Tukey’s correction. Scale bars, 25 μm.
Figure 4.
Figure 4.. The C9ORF72 repeat expansion reduces thalamic and cortical size in embryonic mice (A and B) Representative immunocytochemistry images
(A) and quantification (B) of the number of poly(AP)+ puncta in PAX6+ cortical progenitor cells in E9.5 control or C9ORF72-BAC embryos. (C and D) Representative immunocytochemistry images (C) and quantification (D) of the number of poly(PR)+ puncta in PAX6+ cortical progenitor cells in E9.5 control or C9ORF72-BAC embryos. (E and F) Representative immunocytochemistry images (E) and quantification (F) of the number of poly(GR)+ puncta in PAX6+ cortical progenitor cells in E9.5 control or C9ORF72-BAC embryos. (A–F) Outlines depict PAX6+ cells, and the arrows point toward DPR puncta. NESTIN was used to identify cell boundaries to determine whether endogenous DPRs were localized intra/extracellularly. Data points consist of the average number of DPR puncta per progenitor cell in 3 control and 3 C9ORF72-BAC embryos for each DPR. Each data point represents one embryo. Approximately 20 progenitor cells were quantified per embryo. Data are shown as mean ± SEM and were analyzed using an unpaired t test (B and F) or a Mann-Whitney t test (D). Scale bars, 10 μm. (G and H) Representative images (G) and quantification of PAX6 and KI67 double-positive cells (H) in the developing telencephalon of E9.5 control (n = 6) or C9ORF72-BAC (n = 6) embryos. Each data point represents one embryo. Mean ± SEM. Unpaired t test. (I) Representative 3D renderings of magnetic resonance imaging of E18.5 control and C9ORF72-BAC embryos showing total brain and thalamic volume. The brains are oriented from a ventral perspective with the olfactory bulbs on the left. Purple outlines the brain, and the thalamic regions are colored green. Scale bars, 1 mm. (J) Quantification of total brain volume normalized to body weight for E18.5 control and C9ORF72-BAC embryos. Magnetic resonance imaging was used for quantification. Each data point represents the relative ratio of total brain volume normalized to body weight for one embryo (n = 6 control and 11 C9ORF72-BAC embryos). Mean ± SEM. Unpaired t test. (K) Quantification of thalamic volume normalized to total brain volume for E18.5 control and C9ORF72-BAC embryos. Magnetic resonance imaging was used for quantification. Each data point represents the relative ratio of thalamic brain volume to total brain volume for one embryo (n = 6 control and 6 C9ORF72-BAC embryos). Mean ± SEM. Unpaired t test. (L and M) Representative images (L) and quantification (M) of relative thalamic area in E18.5 control and C9ORF72-BAC embryos using immunohistochemistry. Data points represent the relative ratio of thalamic area in 3 control and 3 C9ORF72-BAC embryos. Each data point represents one embryo. The average area of the thalamus was determined starting at approximately bregma + 3.51 μm, followed by an additional 3 sections at 16 μm each. Mean ± SEM. Unpaired t test. Scale bars, 1 mm. (N and O) Representative images (N) and quantification (O) of relative cortical thickness in E18.5 control and C9ORF72-BAC embryos using immunohistochemistry. Data points represent the relative ratio of cortical thickness in one embryo for 3 control and 3 C9ORF72-BAC embryos. The average cortical thickness was determined by measuring the width from layer 1 to layer 6 across 3 different 16-μm sections. Mean ± SEM. Unpaired t test. Scale bars, 1 mm.
Figure 5.
Figure 5.. Reducing brain volume triggers symptom onset in C9ORF72-BAC mice
(A) Representative images of brains of 2-month-old mice exposed to vehicle or 2 μg/g VIP antagonist from E9.5–E11.5. (B) Quantification of brain mass in 2-month-old mice that were treated with vehicle or VIP antagonist from E9.5–E11.5. Each data point represents the brain mass of one mouse (n = 9 vehicle and n = 8 VIP antagonist). Mean ± SEM. Unpaired t test. (C and D) Representative images (C) and quantification (D) of cortical thickness in E18.5 control and C9ORF72-BAC embryos treated with vehicle or 2 μg/g VIP antagonist using immunohistochemistry. Each data point represents the average cortical thickness in one embryo (n = 3 control and 3 C9ORF72-BAC embryos). The average cortical thickness was determined by measuring the width from layer 1 to layer 6 across 3 different 16-mm sections beginning at approximately bregma + 3.51. Mean ± SEM. One-way ANOVA. Scale bars, 1 mm. (E) Quantification of time to fall in a hanging wire test for 2-month-old control and C9ORF72-BAC mice treated with vehicle or VIP antagonist from E9.5–E11.5. Each data point represents the average time to fall for one mouse. Control + vehicle, n = 11 mice; control + VIP antagonist, n = 10 mice; C9ORF72-BAC + vehicle, n = 10 mice; C9ORF72-BAC + VIP antagonist, n = 16 mice. Mean ± SEM. Kruskal-Wallis test. (F) Quantification of total distance traveled during an open field test for 2-month-old control and C9ORF72-BAC mice treated with vehicle or VIP antagonist from E9.5–E11.5. Each data point represents the total distance traveled for one mouse. Control + vehicle, n = 11 mice; control + VIP antagonist, n = 10 mice; C9ORF72-BAC + vehicle, n = 10 mice; C9ORF72-BAC + VIP antagonist, n = 16 mice. Mean ± SEM. two-way ANOVA.

References

    1. Deneubourg C, Ramm M, Smith LJ, Baron O, Singh K, Byrne SC,Duchen MR, Gautel M, Eskelinen E-L, Fanto M, and Jungbluth H. (2022). The spectrum of neurodevelopmental, neuromuscular and neurodegenerative disorders due to defective autophagy. Autophagy 18, 496–517. 10.1080/15548627.2021.1943177. - DOI - PMC - PubMed
    1. Schor NF, and Bianchi DW (2021). Neurodevelopmental Clues to Neurodegeneration. Pediatr. Neurol. 123, 67–76. 10.1016/j.pediatrneurol.2021.07.012. - DOI - PMC - PubMed
    1. Arteaga-Bracho EE, Gulinello M, Winchester ML, Pichamoorthy N, Petronglo JR, Zambrano AD, Inocencio J, De Jesus CD, Louie JO, Gokhan S, et al. (2016). Postnatal and adult consequences of loss of huntingtin during development: Implications for Huntington’s disease. Neurobiol. Dis. 96, 144–155. 10.1016/j.nbd.2016.09.006. - DOI - PMC - PubMed
    1. Barnat M, Capizzi M, Aparicio E, Boluda S, Wennagel D, Kacher R,Kassem R, Lenoir S, Agasse F, Braz BY, et al. (2020). Huntington’s disease alters human neurodevelopment. Science 369, 787–793. 10.1126/science.aax3338. - DOI - PMC - PubMed
    1. DeJesus-Hernandez M, Mackenzie IR, Boeve BF, Boxer AL, Baker M, Rutherford NJ, Nicholson AM, Finch NA, Flynn H, Adamson J, et al. (2011). Expanded GGGGCC hexanucleotide repeat in noncoding region of C9ORF72 causes chromosome 9p-linked FTD and ALS. Neuron 72, 245–256. 10.1016/j.neuron.2011.09.011. - DOI - PMC - PubMed

Publication types