. 2023 Aug 17;21(8):e3002231.
doi: 10.1371/journal.pbio.3002231. eCollection 2023 Aug.

NCoR1 controls Mycobacterium tuberculosis growth in myeloid cells by regulating the AMPK-mTOR-TFEB axis

Affiliations

NCoR1 controls Mycobacterium tuberculosis growth in myeloid cells by regulating the AMPK-mTOR-TFEB axis

Viplov Kumar Biswas et al. PLoS Biol. .

Abstract

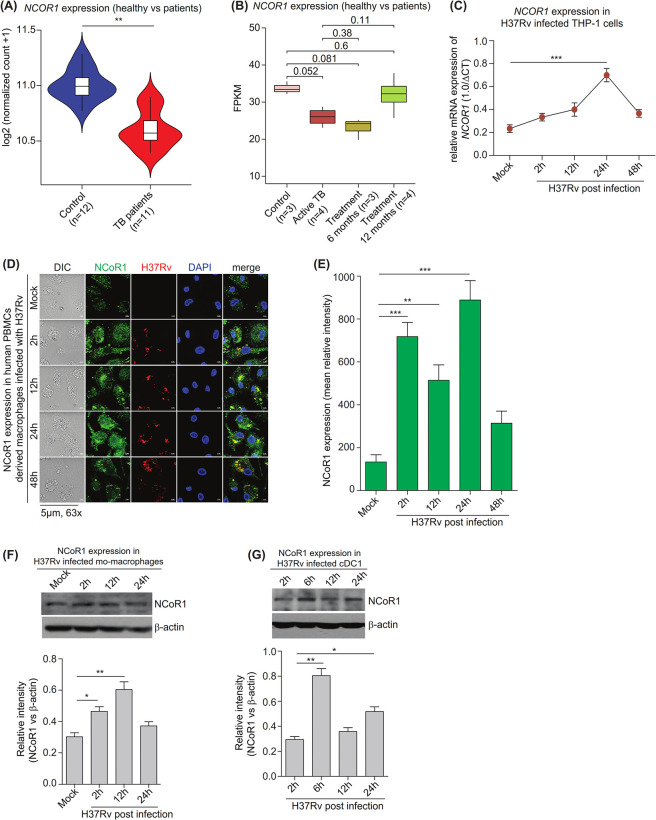
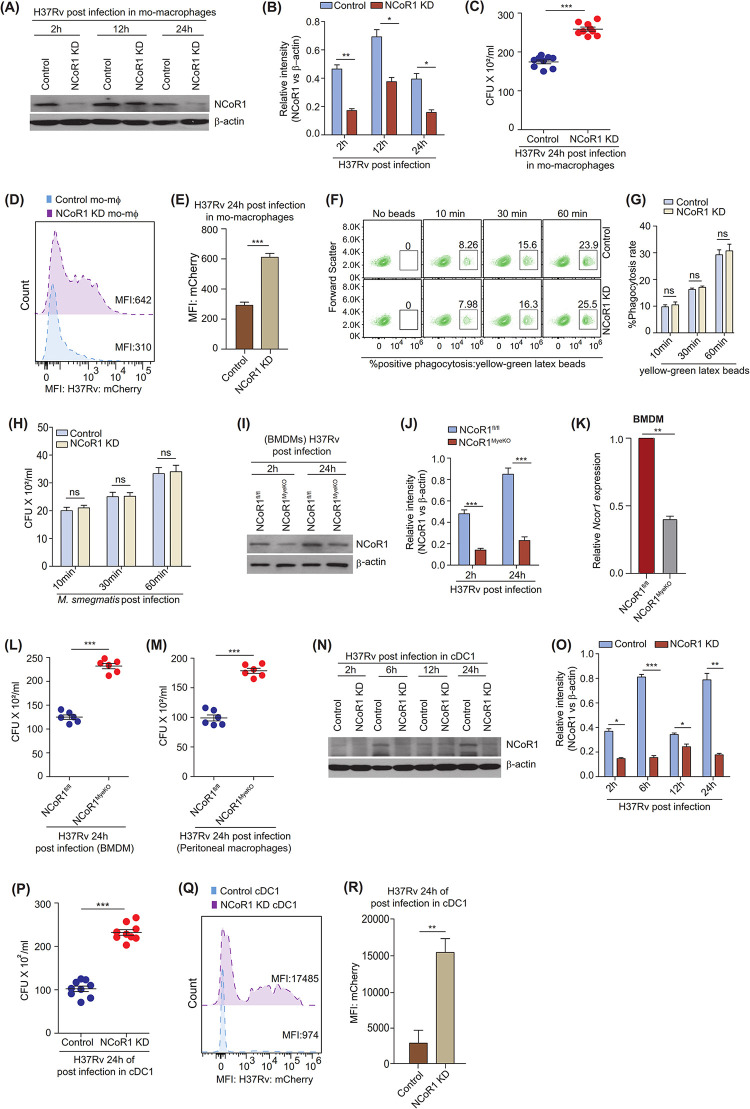
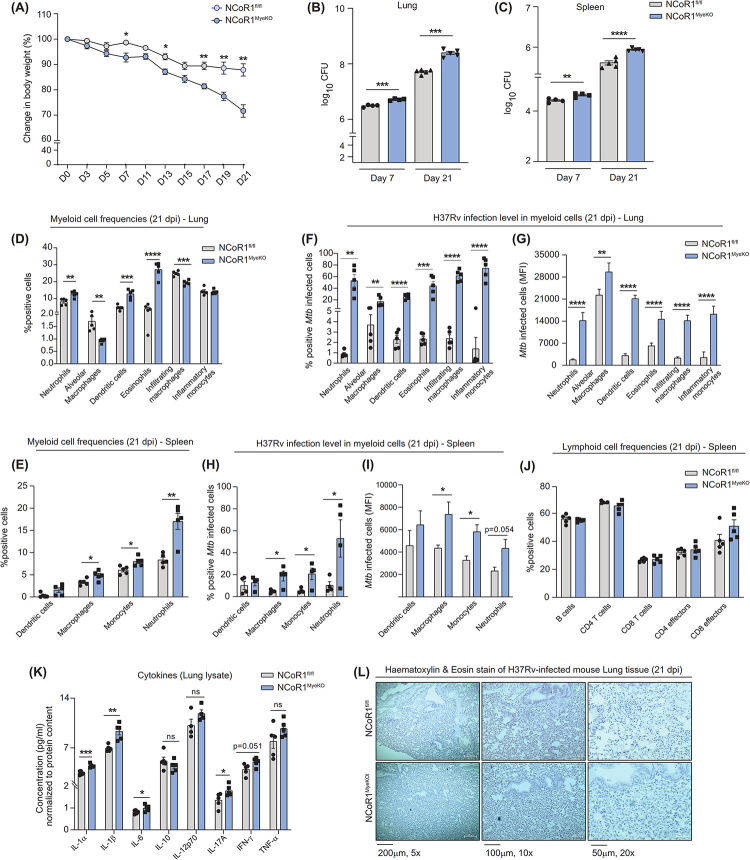
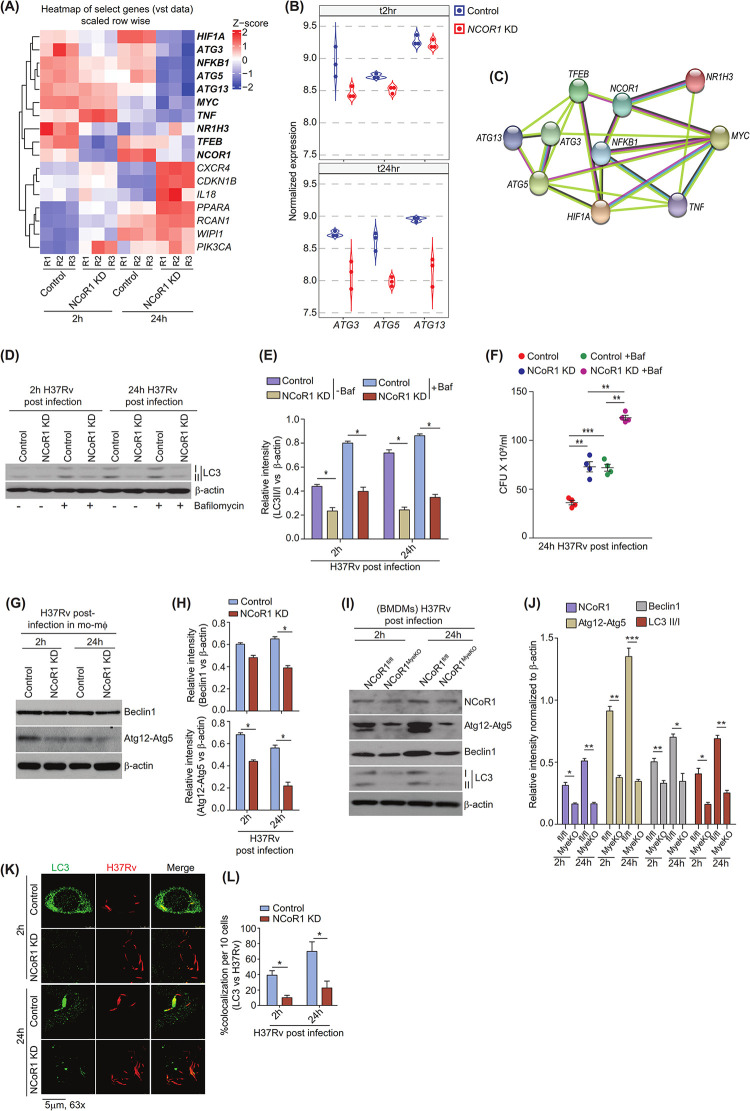
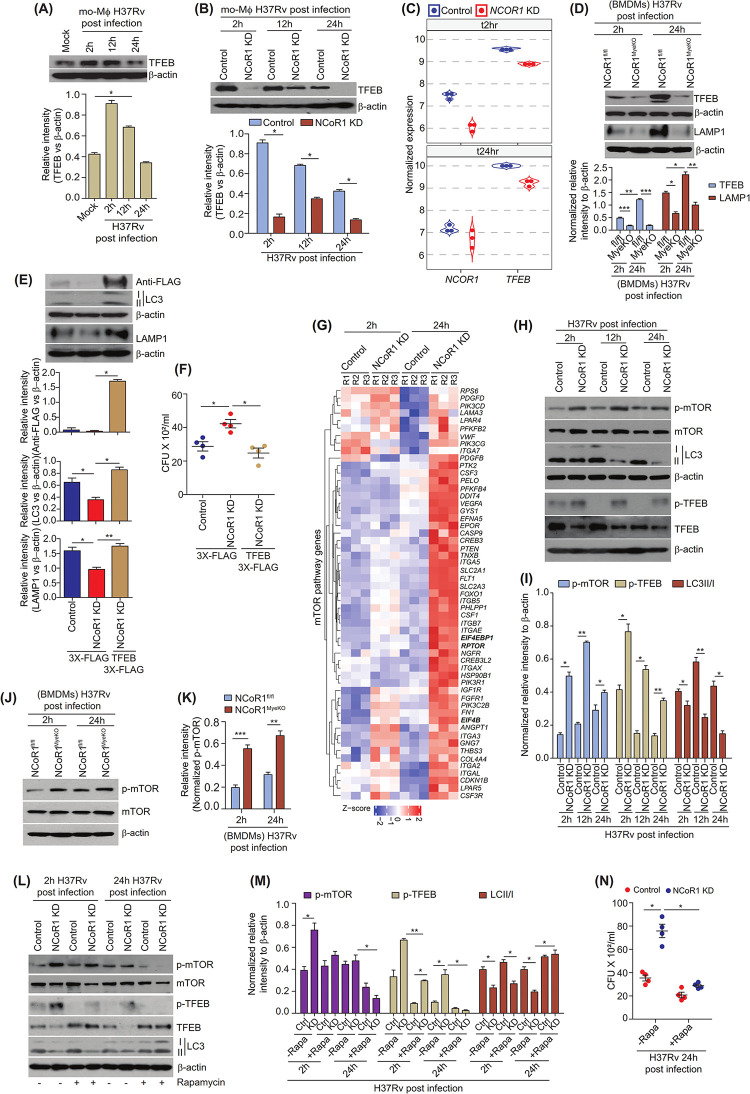
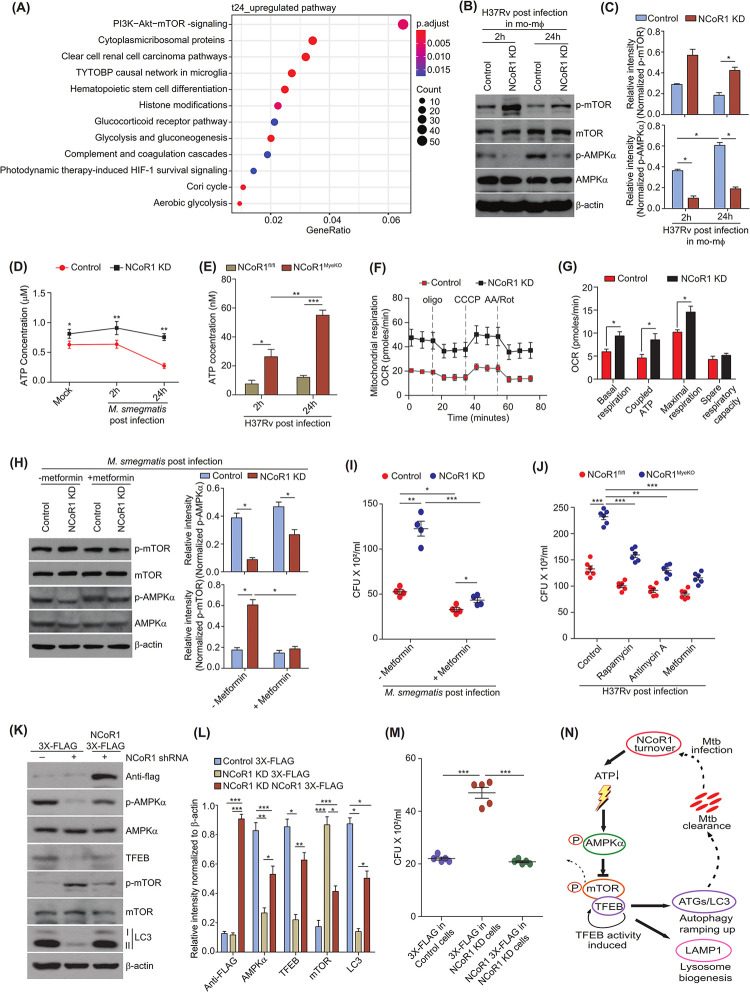
Mycobacterium tuberculosis (Mtb) defends host-mediated killing by repressing the autophagolysosome machinery. For the first time, we report NCoR1 co-repressor as a crucial host factor, controlling Mtb growth in myeloid cells by regulating both autophagosome maturation and lysosome biogenesis. We found that the dynamic expression of NCoR1 is compromised in human peripheral blood mononuclear cells (PBMCs) during active Mtb infection, which is rescued upon prolonged anti-mycobacterial therapy. In addition, a loss of function in myeloid-specific NCoR1 considerably exacerbates the growth of M. tuberculosis in vitro in THP1 differentiated macrophages, ex vivo in bone marrow-derived macrophages (BMDMs), and in vivo in NCoR1MyeKO mice. We showed that NCoR1 depletion controls the AMPK-mTOR-TFEB signalling axis by fine-tuning cellular adenosine triphosphate (ATP) homeostasis, which in turn changes the expression of proteins involved in autophagy and lysosomal biogenesis. Moreover, we also showed that the treatment of NCoR1 depleted cells by Rapamycin, Antimycin-A, or Metformin rescued the TFEB activity and LC3 levels, resulting in enhanced Mtb clearance. Similarly, expressing NCoR1 exogenously rescued the AMPK-mTOR-TFEB signalling axis and Mtb killing. Overall, our data revealed a central role of NCoR1 in Mtb pathogenesis in myeloid cells.


Conflict of interest statement

The authors have declared that no competing interests exist

Figures

Fig 1
Fig 1. NCoR1 expression is increased upon Mycobacterium infection in myeloid cells.
(A) Violin plot depicting the normalised read counts of NCOR1 in publicly available transcriptome data of PBMCs from active TB patients and healthy control. Healthy control n = 12, active TB patients n = 11. (B) Box plot demonstrating the normalised FPKM (Fragment counts / kb / million reads) of NCOR1 from publicly available transcriptome data of PBMCs from healthy control and active TB patients along with active patients undergoing anti-TB treatment regimen for 6 and 12 months. Healthy control n = 3, active patients n = 4, active patients with 6 months treatment n = 3, active patients with 12 months treatment n = 4. (C) RT-qPCR line graph depicting the NCOR1 transcription kinetics (2 h, 6 h, 24 h, and 48 h) in H37Rv-infected human monocytic THP-1 differentiated macrophages (n = 3). (D, E) Confocal microscopy images and bar plots quantification showing the NCoR1 expression in human PBMCs-derived macrophages infected with H37RV at different time points (n = 4 human subjects). (F) Western blot image with densitometric analysis (bar plots) of bands depicting the NCoR1 protein expression upon H37Rv infection in human monocytic THP-1 differentiated macrophages at different time points. For normalisation, β-actin was used as housekeeping control (n = 3). (G) Western blot image and its densitometric analysis (bar plots) of bands demonstrating the NCoR1 protein levels in H37Rv-infected mouse cDC1 at different time points (n = 3). *p < 0.05, *p < 0.01, and ***p < 0.001 were considered significant. Data analysis was performed, (A) Wald test, (B) Wilcoxon rank sum test and others using a one-way ANOVA with Tukey’s statistical test. Where n represents independent biological replicates. The data underlying this figure are available in S3 and S4 Tables and S1 Data. Western blot raw images can be found in S1 Raw Image. PBMC, peripheral blood mononuclear cell; TB, tuberculosis.
Fig 2
Fig 2. NCoR1 depletion enhanced Mycobacterium burden in myeloid cells.
(A) Western blot image showing the NCoR1 protein levels at 2 h, 12 h, and 24 h in H37Rv-infected control and NCoR1 depleted human monocytic THP-1 differentiated macrophages. For normalisation, β-actin was used as housekeeping control (n = 3). (B) Bar plot demonstrating the quantification of NCoR1 protein levels at 2 h, 12 h, and 24 h of H37Rv-infected control and NCoR1 KD human monocytic THP-1 differentiated macrophages. Densitometric analysis is performed using 3 independent biological replicates (n = 3). (C) Scatter plot showing the bacterial load in H37Rv-infected control and NCoR1 KD human monocytic THP-1 differentiated macrophages by CFU assay 24 h post infection (n = 9). (D) Representative flow cytometry histogram plots showing the MFI shift of H37Rv-mCherry–infected control and NCoR1 KD human monocytic THP-1 differentiated macrophages at 24 h post infection (n = 3). (E) Bar plot demonstrating the quantification of MFI shifts from 3 biological replicates of H37Rv-mCherry–infected control and NCoR1 KD human monocytic THP-1 differentiated macrophages at 24 h post infection (n = 3). (F, G) Flow cytometry contour plot and bar plot showing the phagocytosis rate of yellow-green latex beads in control and NCoR1 KD human monocytic THP-1 differentiated macrophages at 10 min, 30 min, and 60 min post latex bead incubation (n = 3). (H) Bar plot showing the quantification of phagocytosis rate estimated by CFU assay of M. smegmatis in control and NCoR1 KD human monocytic THP-1 differentiated macrophages at 10 min, 30 min, and 60 min post infection (n = 3). (I, J) Western blot image with densitometric analysis of bands depicting the NCoR1 protein levels at 2 h and 24 h of H37Rv-infected BMDMs generated from NCoR1fl/fl and NCoR1MyeKO mice. For normalisation, β-actin was used as housekeeping control. Three independent biological replicates were used to estimate the protein levels (n = 4 mice). (K) Bar plot demonstrating the NCoR1 transcript levels in BMDMs generated from NCoR1fl/fl and NCoR1MyeKO mice post 24 h of H37Rv infection. Three independent biological replicates were used to estimate the transcript levels (n = 4 mice). (L) Scatter plot showing the bacterial load in H37Rv-mCherry–infected BMDMs generated from NCoR1fl/fl and NCoR1MyeKO mice (n = 6 mice). (M) Scatter plot depicting the bacterial load in H37Rv-mCherry–infected peritoneal macrophages from NCoR1fl/fl and NCoR1MyeKO mice (n = 6 mice). (N, O) Western blot image showing the NCoR1 protein level kinetics with quantification (bar plot) in control and NCoR1 KD cDC1 (conventional type I dendritic cells) upon H37Rv infection. For normalisation, β-actin was used as housekeeping control (n = 3). (P) Scatter plot showing the H37Rv bacterial load in control and NCoR1 KD cDC1 at 24 h time point as estimated by CFU assay (n = 9). (Q) Histogram from FACS analysis showing the MFI shifts of H37Rv-mCherry–infected control and NCoR1 KD cDC1 at 24 h post infection (n = 3). (R) Bar plot demonstrating the quantification of MFI shifts from 3 independent biological replicates of H37Rv-mCherry–infected control and NCoR1 KD cDC1 at 24 h post infection (n = 3). *p < 0.05, *p < 0.01, and ***p < 0.001 using paired and unpaired two-tailed Student’s t test. Where n represents independent biological replicates. The data underlying this figure are available in S4 Table and S1 Data. Western blot raw images can be found in S1 Raw Image. BMDM, bone marrow-derived macrophage; KD, knockdown; MFI, mean fluorescence intensity.
Fig 3
Fig 3. Myeloid specific NCoR1 deletion exacerbates Mycobacterium infection in mice.
(A) Line graph showing the percent reduction in body weight upon H37Rv infection in NCoR1fl/fl and NCoR1MyeKO mice at regular intervals till day 21 post infection (n = 5 mice). (B, C) Bar plots showing the bacterial load in the lung tissues of H37Rv-infected NCoR1fl/fl and NCoR1MyeKO mice at day 7 and day 21 post infection by CFU assay in lung and spleen. Data is presented as the median log10CFU (n = 4–5). (D) Bar plots showing the percent positive myeloid cell subtypes gated on CD45 positive cells isolated from lung tissues of NCoR1fl/fl and NCoR1MyeKO mice on day 21 post infection. Strategy used to gate H37Rv-infected macrophages in FACS is shown in S3C Fig (n = 5). (E) Bar plots showing the percent positive myeloid cell subtypes gated on CD45 positive cells isolated from spleen tissues of NCoR1fl/fl and NCoR1MyeKO mice on day 21 post infection. Strategy used to gate H37Rv-infected macrophages in FACS is shown in S3D Fig (n = 5). (F) Bar plots showing the percentage of GFP-tagged H37Rv infection in neutrophils, alveolar macrophages, dendritic cells, eosinophils, infiltrating macrophages, and inflammatory monocytes, and (G) corresponding MFI shifts in the cells isolated from lung tissues of NCoR1fl/fl and NCoR1MyeKO mice on day 21 post infection (n = 5). (H) Bar plot showing the percentage of GFP-tagged H37Rv infection in dendritic cells, macrophages, monocytes, and neutrophils, and (I) corresponding MFI shifts in the cells isolated from spleen tissues of NCoR1fl/fl and NCoR1MyeKO mice on day 21 post infection (n = 4). (J) Bar plot showing the percent positive B cell and T cell subtypes gated on CD45 positive cells isolated from splenic tissues of NCoR1fl/fl and NCoR1MyeKO mice on day 21 post infection. Strategy used to gate H37Rv-infected macrophages in FACS is shown in S3E Fig (n = 5). (K) Bar plot showing the level of different inflammatory cytokines in the lung tissue lysate of NCoR1fl/fl and NCoR1MyeKO mice on day 21, normalised to protein content (n = 5). (L) Representative HE staining image showing infiltration of cells in the lung tissue of NCoR1fl/fl and NCoR1MyeKO mice on day 21. *p < 0.05, *p < 0.01, and ***p < 0.001 using an unpaired, two-tailed Student’s t test. Where n represents the total number of used mice. The data underlying this figure are available in S1 Data. HE, haematoxylin and eosin; MFI, mean fluorescence intensity.
Fig 4
Fig 4. NCoR1 regulates autophagy induction during Mtb infection.
(A) Heat map showing the top differential expressed genes related to autophagy function in the RNA-seq data of control and NCoR1 KD human monocytic THP-1 differentiated macrophages at 2 h and 24 h post infection (n = 3). (B) Violin plot depicting the normalised transcript expression of ATGs in control and NCoR1 KD human monocytic THP-1 differentiated macrophages at 2 h and 24 h post infection (n = 3). (C) String network analysis showing the association of NCoR1 with top DEGs found in NCoR1 KD human monocytic THP-1 differentiated macrophages vs. control cells at 2 h and 24 h post infection (n = 3). (D, E) Representative western blot image depicting the LC3-II:LC3-I level in H37Rv-infected control and NCoR1 KD human monocytic THP-1 differentiated macrophages at 2 h and 24 h post infection, before and after treatment with bafilomycin. Corresponding densitometric analysis (bar plots) depicting the quantitation and statistics from the western blot images of 3 independent biological replicates. For normalisation, β-actin was used as housekeeping control. LC3-II density versus LC3-I was quantified followed by normalisation with β-actin (n = 3). (F) Scatter plot showing the H37Rv bacterial load in control and NCoR1 KD human monocytic THP-1 differentiated macrophages by CFU assay at 24 h post infection, before and after treatment with bafilomycin (n = 4). (G, H) Western blot representative image depicting the protein levels of Beclin1 and ATG12-5 in H37Rv-infected control and NCoR1 KD human monocytic THP-1 differentiated macrophages at 2 h and 24 h post infection. Corresponding densitometric analysis (bar plots) showing the quantitation and statistics from the western blot images of 3 independent biological replicates. For normalisation, β-actin was used as housekeeping control (n = 3). (I) Western blot representative picture showing the levels of NCoR1, Atg12-Atg5, Beclin1, and LC3-II:LC3-I in H37Rv-infected BMDMs generated from NCoR1fl/fl and NCoR1MyeKO mice at 2 h and 24 h post infection. For normalisation, β-actin was used as housekeeping control. LC3-II density versus LC3-I was quantified followed by normalisation with β-actin (n = 4 mice). (J) Bar plot showing the densitometric quantification from western blot images for NCoR1, ATG12-ATG5, BECLIN1, and LC3 in H37Rv-infected BMDMs generated from NCoR1MyeKO and NCoR1fl/fl mice at 2 h and 24 h post infection. For normalisation, β-actin was used as housekeeping control (n = 4 mice). (K) Confocal microscopy showing the colocalization of H37Rv with LC3 protein in control and NCoR1 KD human monocytic THP-1 differentiated macrophages at 2 h and 24 h post infection (n = 3). (L) Bar plot depicting the quantification of confocal images from 3 independent biological replicates for the colocalization of H37Rv with LC3 in control and NCoR1 KD human monocytic THP-1 differentiated macrophages. Ten cells from each biological replicate were analysed for calculating the colocalization percentage (n = 3). *p < 0.05, *p < 0.01, and ***p < 0.001 using paired and unpaired two-tailed Student’s t test. Where n represents independent biological replicates. The data underlying this figure are available in S1 Table and S1 Data. Western blot raw images can be found in S1 Raw Image. BMDM, bone marrow-derived macrophage; DEG, differentially expressed gene; KD, knockdown.
Fig 5
Fig 5. NCoR1 regulates mTOR-TFEB axis to control autophagy induction and lysosomal biogenesis in myeloid cells.
(A) Representative western blot image along with bar plots for densitometric analysis depicting the TFEB protein kinetics (2 h, 12 h, and 24 h) in the H37Rv-infected human monocytic THP-1 differentiated macrophages. For normalisation, β-actin was used as housekeeping control (n = 3). (B) Western blot image depicting the levels of TFEB protein in H37Rv-infected control and NCoR1 KD human monocytic THP-1 differentiated macrophages at 2 h, 12 h, and 24 h post infection. Corresponding bar plots showing the densitometric analysis from 3 independent biological replicates. For normalisation, β-actin was used as housekeeping control (n = 3). (C) Violin plot depicting the normalised transcript expression of TFEB in RNA-seq data of control and NCoR1 KD human monocytic THP-1 differentiated macrophages at 2 h and 24 h post infection (n = 3). (D) Representative western blot image with densitometric analysis showing the TFEB and LAMP1 levels in the BMDMs from NCoR1fl/fl and NCoR1MyeKO mice at 2 h and 24 h post H37Rv infection. For normalisation, β-actin was used as housekeeping control (n = 4 mice). (E) Western blot image along with densitometric analysis showing the levels of LC3, LAMP1, and TFEB-flag in H37Rv-infected NCoR1 KD human monocytic THP-1 differentiated macrophages with or without overexpression of exogenous flag-tagged TFEB at 24 h post infection. For normalisation, β-actin was used as housekeeping control (n = 3). (F) Scatter plot demonstrating the H37Rv bacterial load by CFU assay in H37Rv-infected NCoR1 KD human monocytic THP-1 differentiated macrophages with or without exogenous overexpression of flag-tagged TFEB at 24 h post infection (n = 4). (G) Heat map showing the DEGs related to mTOR pathway in RNA-seq data of control and NCoR1 KD human monocytic THP-1 differentiated macrophages at 2 h and 24 h post infection (n = 3). (H) Representative western blot image depicting the kinetics (2 h, 12 h, 24 h) of phospho-mTOR (p-mTOR), mTOR, phospho-TFEB (p-TFEB), TFEB, and LC3-II:LC3-I protein levels in H37Rv-infected control and NCoR1 depleted human monocytic THP-1 differentiated macrophages (n = 3). (I) Bar plot showing the densitometric quantification of p-mTOR, mTOR, p-TFEB, TFEB, and LC3 protein bands from 3 independent biological replicates in H37Rv-infected human control and NCoR1 KD monocytic THP-1 differentiated macrophages at 2 h, 12 h, and 24 h post infection. p-mTOR and p-TFEB were normalised first with total protein levels and then with housekeeping control β-actin. LC3-II density versus LC3-I was quantified followed by normalisation with β-actin (n = 3). (J) Representative western blot image depicting the protein levels of p-mTOR and total mTOR in H37Rv-infected BMDMs generated from NCoR1fl/fl and NCoR1MyeKO mice at 2 h and 24 h post infection. For normalisation, β-actin was used as housekeeping control (n = 4 mice). (K) Bar plot showing the densitometric quantification of p-mTOR levels from 3 independent biological replicates in H37Rv-infected BMDMs generated from NCoR1fl/fl and NCoR1MyeKO mice at 2 h and 24 h post infection. p-mTOR was normalised first with total m-TOR followed by normalisation with β-actin (n = 4 mice). (L) Western blot representative image depicting the p-mTOR, mTOR, p-TFEB, TFEB, and LC3-II:LC3-I levels in H37Rv-infected control and NCoR1 KD human monocytic THP-1 differentiated macrophages at 2 h and 24 h post infection, with and without rapamycin treatment (n = 3). (M) Bar plot depicting the densitometric quantification of normalised p-mTOR, p-TFEB, and LC3 protein bands from 3 independent biological replicates. The p-mTOR and p-TFEB levels were normalised first with their respective total protein levels and then with housekeeping control β-actin. LC3-II versus LC3-I levels were quantified followed by normalisation with β-actin (n = 3). (N) Scatter plot showing the bacterial load in H37Rv-infected control and NCoR1 KD human monocytic THP-1 differentiated macrophages by CFU assay at 24 h post infection, with and without treatment of rapamycin (n = 4). *p < 0.05, *p < 0.01, and ***p < 0.001 using paired and unpaired two-tailed Student’s t test. Where n represents independent biological replicates. The data underlying this figure are available in S1 Table and S1 Data. Western blot raw images can be found in S1 Raw Image. BMDM, bone marrow-derived macrophage; DEG, differentially expressed gene; KD, knockdown; TFEB, transcription factor EB.
Fig 6
Fig 6. NCoR1 regulates mTOR activity by fine-tuning cellular ATP-AMPK levels.
(A) Pathway enrichment analysis showing the top pathways enriched for the list of genes significantly up-regulated in RNA-seq data of NCoR1 KD human monocytic THP-1 differentiated macrophages at 24 h post infection with H37Rv (n = 3). (B, C) Representative western blot image depicting the p-mTOR, p-AMPKα along with total mTOR, AMPKα in H37Rv-infected control and NCoR1 KD human monocytic THP-1 differentiated macrophages at 2 h and 24 h post infection. Corresponding bar plots showing the densitometric analysis from western blots of 3 independent biological replicates (n = 3). (D) Line graph showing the intracellular ATP levels in M. smegmatis-infected control and NCoR1 KD human monocytic THP-1 differentiated macrophages at 2 h and 24 h post infection (n = 3). (E) Bar graph depicting the intracellular ATP levels in NCoR1fl/fl and NCoR1MyeKO BMDMs at 2 h and 24 h post H37Rv infection (n = 4 mice). (F) Representative seahorse assay line graph showing the OCR levels upon sequential injections with Oligomycin, CCCP, and Rotenone/Antimycin A, measured in M. smegmatis-infected control and NCoR1 KD human monocytic THP-1 differentiated macrophages at 2 h and 24 h post infection (n = 4). (G) Bar plot depicting the quantification of OCR levels as basal respiration, coupled ATP, maximal respiration, and spare respiratory capacity, measured by seahorse assay, of M. smegmatis-infected control and NCoR1 KD human monocytic THP-1 differentiated macrophages at 2 h and 24 h post infection (n = 4). (H) Western blot representative image with corresponding densitometric analysis depicting the p-mTOR, p-AMPKα along with total mTOR, AMPKα protein level in M. smegmatis-infected control and NCoR1 KD human monocytic THP-1 differentiated macrophages at 24 h post infection, with and without metformin treatment. All phosphorylated proteins were first normalised with its total form followed by housekeeping control β-actin (n = 3). (I) Scatter plot showing the M. smegmatis bacterial load in control and NCoR1 KD human monocytic THP-1 differentiated macrophages by CFU assay at 24 h post infection, with and without metformin treatment (n = 4). (J) Scatter plot showing the bacterial load in H37Rv-infected BMDMs at 24 h post infection by CFU assay, with and without treatment of antimycin A, rapamycin, and metformin. BMDMs were generated from NCoR1MyeKO and NCoR1fl/fl mice (n = 6 mice). (K) Western blot image demonstrating the protein levels of exogenously expressed NCoR1-flag and its impact on p-AMPKα, AMPKα, TFEB, p-mTOR, total mTOR, and LC3-II:LC3-I in H37Rv-infected NCoR1 KD human monocytic THP-1 differentiated macrophages (n = 3). (L) Bar plot showing the densitometric quantitation of western blot bands of NCoR1-flag, p-AMPKα, TFEB, p-mTOR, and LC3 protein levels from 3 independent biological replicates of H37Rv-infected NCoR1 KD human monocytic THP-1 differentiated macrophages complemented with exogenous NCoR1-flag. All phosphorylated proteins were first normalised with its total form followed by housekeeping control β-actin (n = 3). (M) Scatter plot showing the bacterial load in H37Rv-infected control, NCoR1 KD, and exogenous NCoR1-flag overexpressed NCoR1 KD in human monocytic THP-1 differentiated macrophages by CFU assay at 24 h post infection (n = 5). (N) Cartoon diagram showing the proposed mechanism of NCoR1 regulating Mtb pathogenesis in myeloid cells. *p < 0.05, *p < 0.01, and ***p < 0.001 using paired and unpaired two-tailed Student’s t test. Where n represents independent biological replicates. The data underlying this figure are available in S2 Table and S1 Data. Western blot raw images can be found in S1 Raw Image. AMPK, AMP-activated protein kinase; ATP, adenosine triphosphate; BMDM, bone marrow-derived macrophage; KD, knockdown.

References

    1. Mihret A. The role of dendritic cells in Mycobacterium tuberculosis infection. Virulence. 2012;3:654–659. doi: 10.4161/viru.22586 - DOI - PMC - PubMed
    1. Weiss G, Schaible UE. Macrophage defense mechanisms against intracellular bacteria. Immunol Rev. 2015;264:182–203. doi: 10.1111/imr.12266 - DOI - PMC - PubMed
    1. Srivastava S, Ernst JD, Desvignes L. Beyond macrophages: the diversity of mononuclear cells in tuberculosis. Immunol Rev. 2014;262:179–192. doi: 10.1111/imr.12217 - DOI - PMC - PubMed
    1. McClean CM, Tobin DM. Macrophage form, function, and phenotype in mycobacterial infection: lessons from tuberculosis and other diseases. Pathog Dis. 2016;74. doi: 10.1093/femspd/ftw068 - DOI - PMC - PubMed
    1. Liu CH, Liu H, Ge B. Innate immunity in tuberculosis: host defense vs pathogen evasion. Cell Mol Immunol. 2017;14:963–975. doi: 10.1038/cmi.2017.88 - DOI - PMC - PubMed

Publication types

Substances