. 2023 Oct;10(28):e2300560.
doi: 10.1002/advs.202300560. Epub 2023 Aug 17.

Exosomes-transferred LINC00668 Contributes to Thrombosis by Promoting NETs Formation in Inflammatory Bowel Disease

Affiliations

Exosomes-transferred LINC00668 Contributes to Thrombosis by Promoting NETs Formation in Inflammatory Bowel Disease

Long Zhang et al. Adv Sci (Weinh). 2023 Oct.

Abstract

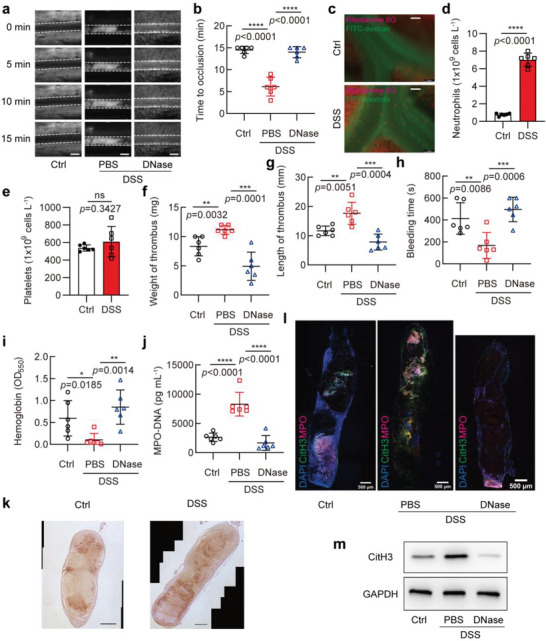
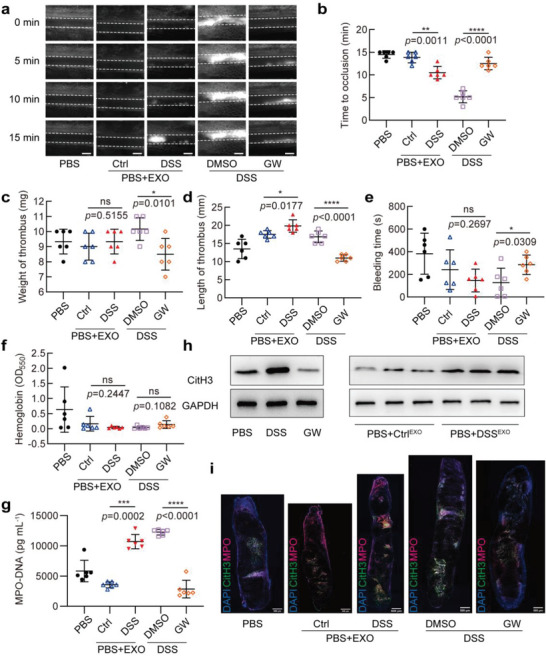
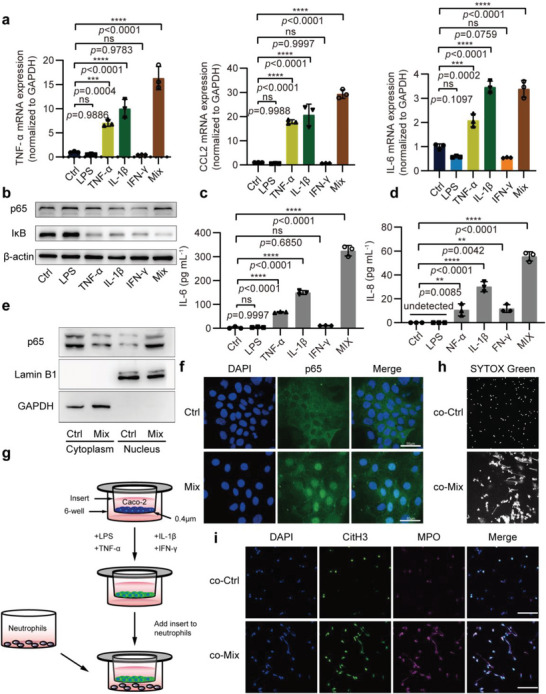
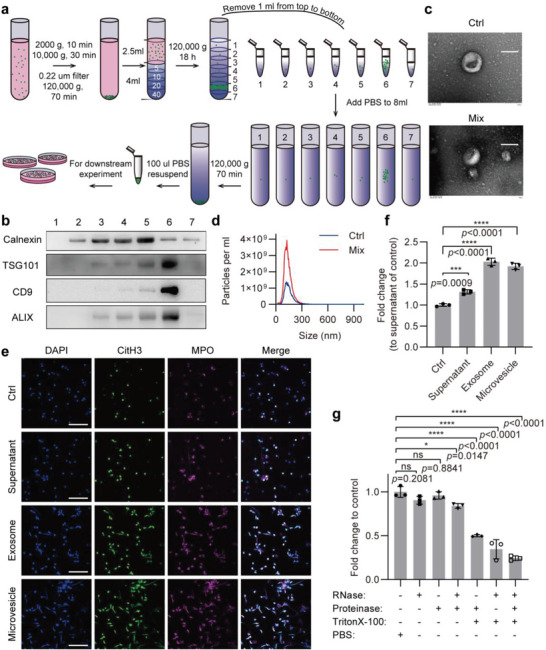
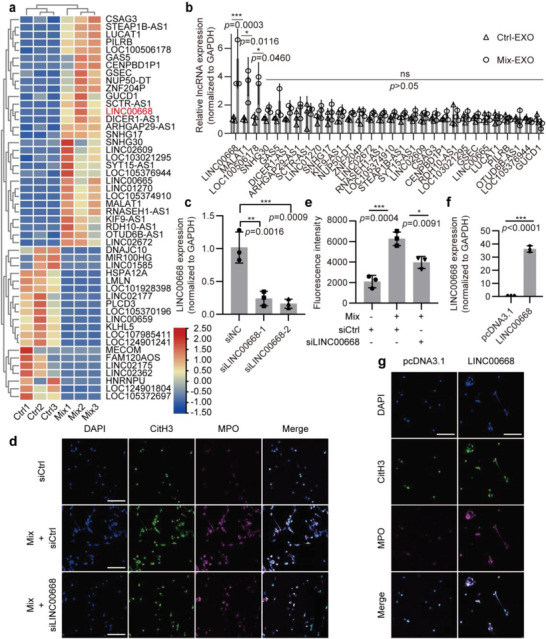
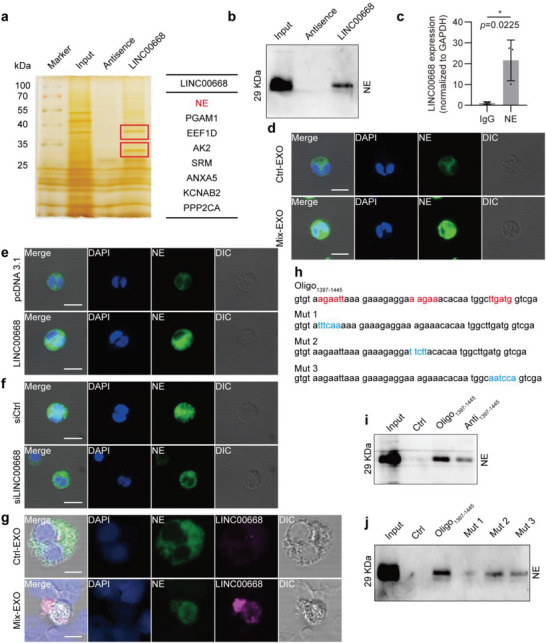
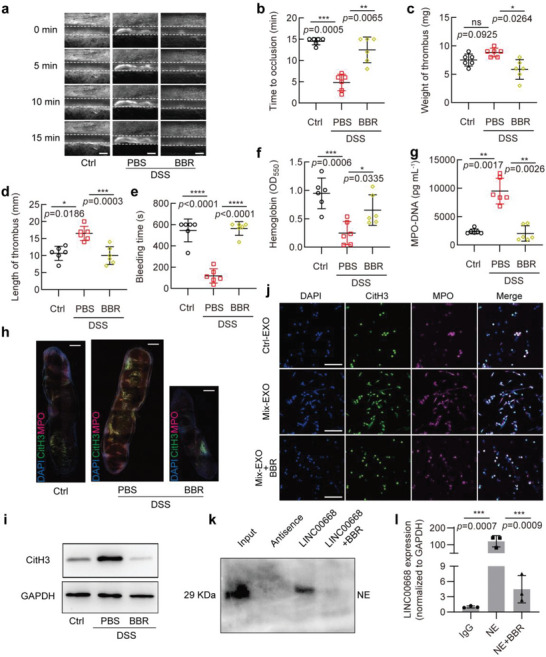
Epidemiological studies show an association between inflammatory bowel disease (IBD) and increased risk of thrombosis. However, how IBD influences thrombosis remains unknown. The current study shows that formation of neutrophil extracellular traps (NETs) significantly increased in the dextran sulfate sodium (DSS)-induced IBD mice, which in turn, contributes to thrombus formation in a NETs-dependent fashion. Furthermore, the exosomes isolated from the plasma of the IBD mice induce arterial and venous thrombosis in vivo. Importantly, proinflammatory factors-exposed intestinal epithelial cells (inflamed IECs) promote neutrophils to release NETs through their secreted exosomes. RNA sequencing revealed that LINC00668 is highly enriched in the inflamed IECs-derived exosomes. Mechanistically, LINC00668 facilitates the translocation of neutrophil elastase (NE) from the cytoplasmic granules to the nucleus via its interaction with NE in a sequence-specific manner, thereby inducing NETs release and thrombus formation. Importantly, berberine (BBR) suppresses the nuclear translocation of NE and subsequent NETs formation by inhibiting the interaction of LINC00668 with NE, thus exerting its antithrombotic effects. This study provides a novel pathobiological mechanism linking IBD and thrombosis by exosome-mediated NETs formation. Targeting LINC00668 can serve as a novel molecular treatment strategy to treat IBD-related thrombosis.

Keywords: LINC00668; berberines; exosomes; inflammatory bowel diseases; neutrophil elastase; neutrophil extracellular traps; thrombus.


Conflict of interest statement

The authors declare no conflict of interest.

Figures

Figure 1
Figure 1
Increased thrombosis is associated with NETs formation in mice with DSS‐induced colitis. a–c) Mesenteric arterioles ≈100 µm in diameter were injured with FeCl3 and white blood cells and platelets were labeled with Rhodamine 6G to detect thrombus formation by intravital microscopy. a) Representative images of thrombus formation in Ctrl or 3% DSS (PBS)‐treated mice administered with or without DNase I (DNase) via the tail vein. Scale bars represent 100 µm. b) Vascular occlusion time in three groups of mice treated as in (a), with 6 mice in each group. c) Representative image of mesenteric vein with white blood cells and platelets labeled by Rhodamine 6G (red) and blood flow labeled by FITC‐dextran (green). Scale bars represent 50 µm. d) Neutrophil and e) platelet count in plasma of Ctrl and DSS‐treated mice after 7‐day treatment, with 6 mice in each group. EDTA‐anticoagulated whole blood was analyzed by a five‐category blood cell analyzer (Mindray, BC‐5000vet). f,g) Mice treated as in (a) were subjected to surgery for inferior vena cava stenosis, f) weight and g) length of thrombus harvested from 3 groups of mice (6 mice in each group) were measured. h) Tail bleeding time in mice treated as in (a), with 6 mice in each group. i) Blood loss was measured by the absorbance of hemoglobin, which was released from ruptured erythrocytes, at a wavelength of 550 nm using a microplate reader, with 6 mice in each group, and each mouse performed three replicates. j) MPO‐DNA ELISA was used to assess NETs in plasma of three groups of mice treated as in (a), with 6 mice in each group. k) Representative immunohistochemical staining images of Ly6G, scale bars, 500 µm. l) Citrullinated histone H3 (CitH3, green) and MPO (magenta) staining in the thrombus of inferior vena cava in three groups of mice treated as in (a) (n = 3 mice per group). Scale bars, 500 µm. m) Western blot analysis of CitH3 expression in the whole thrombus obtained two days after surgery for inferior vena cava stenosis. Data are represented as mean ± SEM, ns means no significance, *p<0.05, **p<0.01, ***p<0.001, ****p<0.0001, p‐value was determined by unpaired two‐tailed Student's t‐test.
Figure 2
Figure 2
Exosomes secreted into plasma from DSS‐induced IBD mice promote thrombosis. a,b) Mesenteric arterioles ≈100 µm in diameter were injured with FeCl3 and white blood cells and platelets were labeled with Rhodamine 6G to detect thrombus formation by intravital microscopy. a) Representative images of thrombus formation in five different groups of mice treated as follows: mice were given drinking water freely (Ctrl), treated with PBS (PBS), 3% DSS (DSS), or 3% DSS combined with vehicle (DMSO) or GW4869 (GW) via intraperitoneal injection. Among these five groups, Ctrl and DSS groups were administrated with exosomes isolated from Ctrl or DSS‐treated mice through the tail vein. Scale bars represent 100 µm. b) Vascular occlusion time in 5 groups of mice treated as in (a), with 6 mice in each group. c,d) Mice treated as in (a) were subjected to surgery for inferior vena cava stenosis, after 48 h, c) weight and d) length of thrombus harvested from 5 groups of mice (6 mice in each group) were measured. e) Tail bleeding time in 5 groups of mice treated as in (a), with 6 mice in each group. f) Blood loss was measured in 5 groups of mice by the absorbance of hemoglobin at a wavelength of 550 nm using a microplate reader (6 mice in each group). g) MPO‐DNA ELISA was used to assess NETs in plasma of 5 groups of mice treated as in (a), with 6 mice in each group. h) Mice treated with PBS were administrated with exosomes isolated from Ctrl (CtrlEXO) or DSS‐treated (DSSEXO) mice through the tail vein, and Western blot analysis of CitH3 expression was performed in the whole thrombus obtained two days after surgery for inferior vena cava stenosis. i) CitH3 (green) and MPO (magenta) staining in the thrombus of inferior vena cava in 5 groups of mice treated as in (a) (n = 3 mice per group). Data are represented as mean ± SEM, ns means no significant difference, *p<0.05, **p<0.01, ***p<0.001, ****p<0.0001, p‐value was determined by unpaired two‐tailed Student's t‐test.
Figure 3
Figure 3
Inflamed IECs induce neutrophils to generate NETs. a) qPCR analysis for TNF‐α, CCL2, and IL‐6 mRNA in Caco‐2 cells treated with PBS (Ctrl), 10 µg mL−1 LPS (LPS), 50 µg mL−1 TNF‐α (TNF‐α), 25 µg mL−1 IL‐1β (IL‐1β), 50 µg mL−1 IFN‐γ (IFN‐γ) or a mixture of the above four factors (Mix). b) Western blot analysis of p65 and IκB expression in 6 groups of Caco‐2 cells treated as in (a). c,d) ELISA assay of IL‐6 and IL‐8 in the culture supernatant of 6 groups of Caco‐2 cells treated as in (a). e) Western blotting analysis determined nuclear and cytoplasmic expression of NFκB p65 in Caco‐2 cells treated with PBS (Ctrl) or Mix. f) p65 (green) staining in Caco‐2 cells treated with PBS (Ctrl) or Mix, the nuclei are stained with DAPI (blue). g) Schematic diagram of the Transwell co‐culture system for Caco‐2 cells (upper chamber) and neutrophils (lower chamber). h) Representative image of extracellular DNA stained with SYTOX Green in neutrophils after co‐cultured with Caco‐2 cells treated with Ctrl or Mix. i) CitH3 (green) and MPO (magenta) staining in neutrophils that co‐cultured with Caco‐2 cells treated with Ctrl or Mix, the nuclei are stained with DAPI (blue). Data are represented as mean ± SEM, ns means no significant difference, **p<0.01, ***p<0.001, ****p<0.0001, p‐value was determined by one‐way ANOVA with Dunnett's post hoc correction.
Figure 4
Figure 4
Inflamed IECs‐derived exosomes promote neutrophils to release NETs. a) Schematic of exosome preparation from cell culture supernatant of Ctrl or Mix‐treated Caco‐2 cells. b) Western blot analysis detected the ER‐associated protein calnexin and the exosome markers TSG101, CD9, and ALIX in 7 fractions during exosome isolation. c) Electron microscopic image of exosomes isolated from Ctrl or Mix‐treated Caco‐2 cells. Scale bars represent 100 nm. d) Nanoparticle Tracking Analysis of exosomes isolated from Ctrl or Mix‐treated Caco‐2 cells. e) Immunofluorescence staining for CitH3 (green) and MPO (magenta) was performed on neutrophils treated with supernatant, exosome, or microvesicle from Mix‐treated Caco‐2 cells. Scale bars represent 50 µm. f) Quantification of NETs release by measuring the OD of SYTOX Green at 523 nm, fold change normalized to supernatant of control (Ctrl). g) PBS‐, RNase‐, proteinase‐, RNase + proteinase‐, proteinase + Triton X‐100‐, RNase + Triton X‐100‐, or RNase + proteinase + Triton X‐100‐treated exosomes were added to neutrophils, and then quantification of NETs was detected by measuring the fluorescence of SYTOX Green at Ex485, Em520. Data are represented as mean ± SEM, ns means no significant difference (p > 0.05), *p<0.05, ***p<0.001, ****p<0.0001, p‐value was determined by one‐way ANOVA with Dunnett's post hoc correction.
Figure 5
Figure 5
Identification of LINC00668 as molecule responsible for IEC exosome‐induced NETs formation. a) The differentially expressed lncRNAs, which were detected with microarray analysis, in exosomes derived from Ctrl or Mix‐treated Caco‐2 cells were selected and summarized. Heatmap showing lncRNAs with significant change, represented by red (upregulated) and blue (downregulated). b) qRT‐PCR validation of a subset of the significantly up‐regulated lncRNAs. Their relative expression levels were normalized to GAPDH. c) Two siRNAs targeting different regions of LINC00668 were used to knock down LINC00668 in Caco‐2 cells, the knockdown efficiency was detected by qRT‐PCR. d) Caco‐2 cells transfected with siCtrl or siLINC00668 and then treated with Mix were co‐cultured with neutrophils for 4 h, and immunofluorescence staining for CitH3 (green), MPO (magenta), and DAPI (blue) was performed on neutrophils. Scale bars represent 50 µm. e) Quantification of NETs in siCtrl or siLINC00668‐transfected neutrophils was performed by measuring the fluorescence of SYTOX Green at Ex485, Em520. f) The overexpression plasmid of LINC00668 was designed and constructed, and the overexpression efficiency was verified by qRT‐PCR. g) pcDNA3.1 and LINC00668‐overexpressing plasmids were transfected into neutrophils, respectively, and neutrophils were stained with CitH3 (green), MPO (magenta), and DAPI (blue) by immunofluorescence. Scale bars represent 50 µm. Data are represented as mean ± SEM, ns means no significant difference (p > 0.05), *p<0.05, **p<0.01, ***p<0.001, p‐value was determined by unpaired two‐tailed Student's t‐test (b, e, f) and one‐way ANOVA with Dunnett's post hoc correction (c).
Figure 6
Figure 6
LINC00668 promotes the translocation of NE from the cytoplasmic granules to the nucleus and induces NETs release. a) The proteins interacting with LINC00668 in HL‐60 cells identified by biotinylated LINC00668 pull‐down followed by mass spectrometry. b) The proteins associated with LINC00668 in HL‐60 cells were pulled down by biotinylated LINC00668 or its antisence sequence (Antisence), and the precipitates were analyzed by Western blotting using anti‐NE antibody. c) qRT‐PCR detection of LINC00668 in the RNA‐protein immunoprecipitates pulled down by IgG or anti‐NE antibody in LINC00668‐overexpressing HL‐60 cells. d) Neutrophils were incubated with the exosomes isolated from Ctrl (Ctrl‐EXO) or Mix‐treated (Mix‐EXO) Caco‐2 cells, and immunofluorescence staining detected the subcellular localization of NE. Green and blue staining indicates NE and the nuclei, respectively. Differential Interference Contrast (DIC) shows 3D stereoscopic projection of cells. Scale bars represent 50 µm. e) Neutrophils were transfected with pcDNA3.1 or LINC00668‐overexpressing plasmids, and immunofluorescence staining detected the subcellular localization of NE. Green and blue staining indicates NE and the nuclei, respectively. Scale bars represent 50 µm. f) Caco‐2 cells were transfected with siCtrl or siLINC00668 and stimulated with Mix for 24 h. Exosomes were isolated from the culture supernatant and used to treat neutrophils, and NE subcellular localization was detected using immunofluorescence staining. Scale bar represents 50 µm. g) Immunofluorescence staining of NE and LINC00668 fluorescence in situ hybridization (FISH) on neutrophils treated with the exosomes isolated from Ctrl (Ctrl‐EXO) or Mix‐treated (Mix‐EXO) Caco‐2 cells. Green, magenta, and blue staining indicate NE, LINC00668, and the nuclei, respectively. Scale bars represent 50 µm. h) The sequence of 1397–1445 nucleotide positions in the LINC00668 sequence (Oligo1397‐1445) and the 3 mutants (Mut 1, Mut 2, and Mut 3) for the binding sites 1, 2, and 3 in Oligo1397‐1445 sequence. i) The lysates of HL‐60 cells were incubated with biotinylated Oligo1397‐1445, the antisense sequence of Oligo1397‐1445 (Anti1397‐1445) or Ctrl, and Western blot analysis detected NE level in the Oligo‐protein immunoprecipitates. j) HL‐60 cell lysates were incubated with biotinylated Oligo1397‐1445 or the mutants for the binding sites 1, 2, and 3 (Mut 1, Mut 2, and Mut 3), and Western blot analysis detected NE level in the Oligo‐protein immunoprecipitates. Data are represented as mean ± SEM. *p<0.05, p‐value was determined by unpaired two‐tailed Student's t‐test.
Figure 7
Figure 7
Berberine inhibits NETs formation by blocking the binding of LINC00668 to NE. a,b) Mesenteric arterioles ≈100 µm in diameter were injured with FeCl3 and white blood cells and platelets were labeled with Rhodamine 6G to detect thrombus formation by intravital microscopy. a) Representative images of thrombus formation in mice received drinking water alone (Ctrl) or treated with 3% DSS combined with PBS (PBS) or BBR (BBR) through intraperitoneal injection. Scale bars represent 100 µm. b) Vascular occlusion time in 3 groups of mice treated as in (a), with 6 mice in each group. c,d) Mice treated as in (a) were subjected to surgery for inferior vena cava stenosis, after 48 h, c) weight and d) length of thrombus harvested from 3 groups of mice (6 mice in each group) were measured. e) Tail bleeding time in mice treated as in (a), with 6 mice in each group. f) Blood loss was measured by the absorbance of hemoglobin at a wavelength of 550 nm using a microplate reader (6 mice in each group). g) MPO‐DNA ELISA was used to assess NETs in plasma of 3 groups of mice treated as in (a), with 6 mice in each group. h) CitH3 (green) and MPO (magenta) staining in the thrombus of inferior vena cava thrombosis in 3 groups of mice treated as in (a) (n = 3 mice per group). Scale bars, 500 µm. i) Western blot analysis of CitH3 expression in the whole thrombus obtained two days after surgery for inferior vena cava stenosis. j) Neutrophils were incubated with the exosomes isolated from Ctrl (Ctrl‐EXO) or Mix‐treated (Mix‐EXO) Caco‐2 cell and then treated or not with BBR. Immunofluorescence staining for CitH3 (green), MPO (magenta), and DAPI (blue) was performed on neutrophils. Scale bars represent 50 µm. k) HL‐60 cell lysates were pulled down by biotinylated LINC00668 with or without BBR or its antisence sequence (Antisence), and the precipitates were analyzed by Western blotting using anti‐NE antibody. l) qRT‐PCR detection of LINC00668 in the RNA‐protein immunoprecipitates pulled down by IgG or anti‐NE antibody in LINC00668‐overexpressing HL‐60 cells treated with or without BBR for 12 h. Results are presented relative to IgG immunoprecipitates. Data are represented as mean ± SEM, ns means no significant difference (p > 0.05), *p<0.05, **p<0.01, ***p<0.001, p‐value was determined by unpaired two‐tailed Student's t‐test.

References

    1. Kaplan G. G., Nat. Rev. Gastroenterol. Hepatol. 2015, 12, 720. - PubMed
    1. Zezos P., Kouklakis G., Saibil F., World J. Gastroenterol. 2014, 20, 13863. - PMC - PubMed
    1. a) Grainge M. J., West J., Card T. R., Lancet 2010, 375, 657; - PubMed
    2. b) Carvalho A. C., Pinho J., Cancela E., Vieira H. M., Silva A., Ministro P., Ther. Adv. Gastroenterol. 2022, 15, 175628482211006. - PMC - PubMed
    1. Laridan E., Martinod K., De Meyer S. F., Semin Thromb Hemost 2019, 45, 086. - PubMed
    1. Middleton E. A., He X. Y., Denorme F., Campbell R. A., Ng D., Salvatore S. P., Mostyka M., Baxter‐Stoltzfus A., Borczuk A. C., Loda M., Cody M. J., Manne B. K., Portier I., Harris E. S., Petrey A. C., Beswick E. J., Caulin A. F., Iovino A., Abegglen L. M., Weyrich A. S., Rondina M. T., Egeblad M., Schiffman J. D., Yost C. C., Blood 2020, 136, 1169. - PMC - PubMed

Publication types

LinkOut - more resources