. 2023 Aug 18;381(6659):eadd7564.
doi: 10.1126/science.add7564. Epub 2023 Aug 18.

Yolk sac cell atlas reveals multiorgan functions during human early development

Affiliations

Yolk sac cell atlas reveals multiorgan functions during human early development

Issac Goh et al. Science. .

Abstract

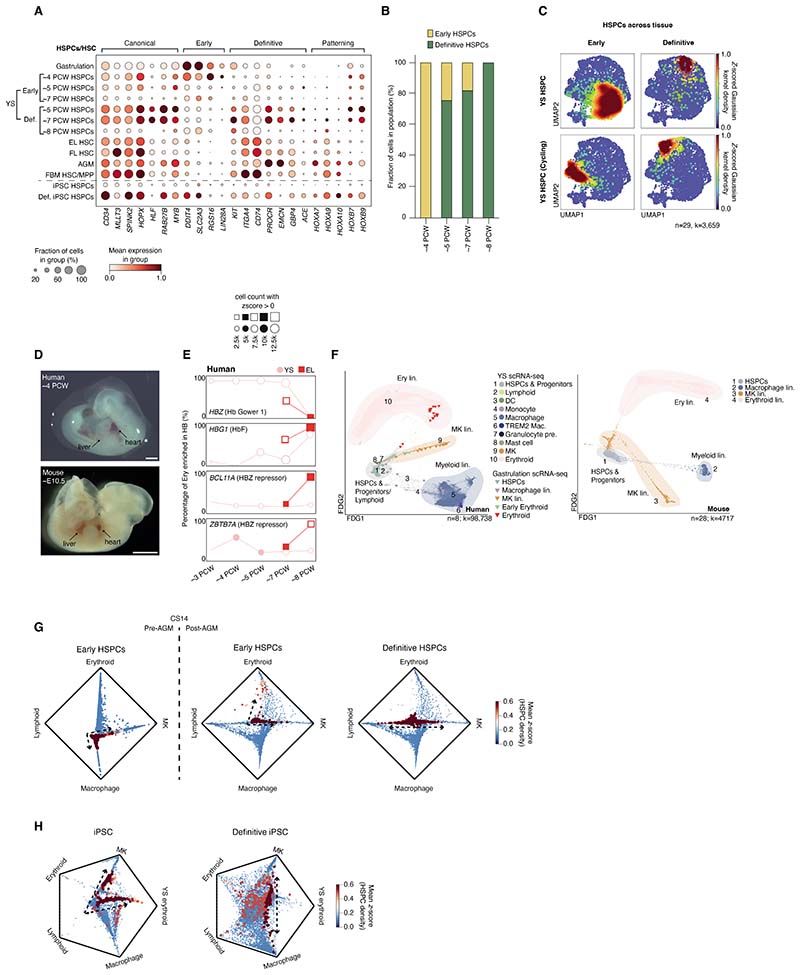
The extraembryonic yolk sac (YS) ensures delivery of nutritional support and oxygen to the developing embryo but remains ill-defined in humans. We therefore assembled a comprehensive multiomic reference of the human YS from 3 to 8 postconception weeks by integrating single-cell protein and gene expression data. Beyond its recognized role as a site of hematopoiesis, we highlight roles in metabolism, coagulation, vascular development, and hematopoietic regulation. We reconstructed the emergence and decline of YS hematopoietic stem and progenitor cells from hemogenic endothelium and revealed a YS-specific accelerated route to macrophage production that seeds developing organs. The multiorgan functions of the YS are superseded as intraembryonic organs develop, effecting a multifaceted relay of vital functions as pregnancy proceeds.


Conflict of interest statement

Competing interests: J.M. is an employee of Genentech. The remaining authors declare no competing interests.

Figures

None
Multiorgan functions of the human yolk sac
We characterized functions of the developing human YS, combining scRNA-seq and CITE-seq, with 2D and 3D imaging techniques. Our findings revealed YS contributions to metabolic and nutritional support, and early hematopoiesis. We characterized myeloid bias in early hematopoiesis, distinct myeloid differentiation trajectories, evolutionary divergence in initial erythropoiesis, and YS contributions to developing tissue macrophages.
Fig. 1
Fig. 1. A single-cell atlas of the human yolk sac.
(A) Schematic of experimental outline. (B) Summary of data included in analyses. Squares represent new data and triangles represent published data: YS (10, 12, 49, 64), AGM (12), liver (10), fetal BM (35), fetal brain (56), fetal skin (49), fetal kidney (80), fetal gonads (50), mouse (75), iPSC (12, 20). Color indicates assay used (data S6). (C) UMAP visualization of YS scRNA-seq data (n=10; k=169,798), colors represent broad cell states: DC: dendritic cell, Mac: macrophage, MEM: megakaryocyte—erythroid–mast cell lineage, MK: megakaryocyte, pre.: precursor. (D) Left: Dot plot showing the mean expression (color) and proportion of cells expressing genes (dot size) of broad cell states in YS scRNA-seq data. Right: Equivalent protein expression (color) and proportion of cells expressing proteins (dot size) from YS CITE-seq data (n=2; k=3,578). Equivalent gene names are in parentheses. * indicates genes validated by RNAscope and ** indicates proteins validated by IHC/IF (data S4). Data are variance-scaled and min-max-standardized. (E) Left: light-sheet fluorescence microscopy of CD34+ and LYVE1+ vascular structures in YS (representative ˜6.9 PCW sample; scale bar: 500 µm; movie S1). Right: Immunofluorescence of an ˜8 PCW YS highlighting endoderm (ASGR1; red) and endothelium (CD34; yellow), costained with DAPI (cyan). Scale bar: 100 µm (data S23). (F) RNAscope of YS (representative 8 PCW sample). Left: endoderm (SPINK1; yellow), smooth muscle (ACTA2; red), AEC (IL33; blue), and macrophages (C1QA; magenta) (scale bar: 200 µm). Right: DCs (CD1C; yellow box) and macrophages (C1QA; magenta box) (scale bar: 50 µm). Individual channels shown in fig. S4A. (G) Left: Bar graph showing the proportion representation of cell states in YS scRNA-seq data by gestational age. Right: Milo beeswarm plot of YS scRNA-seq neighborhood differential abundance across time. Blue/red neighborhoods are significantly enriched earlier/later in gestation respectively. Color intensity denotes degree of significance (data S24).
Fig. 2
Fig. 2. Multiorgan functions of YS.
(A) Dot plot showing the mean expression (color) and proportion of YS and liver stromal cells (dot size) expressing stromal DEG markers (data S3, S7, and S21). YS scRNA-seq data includes main and gastrulation (gastr.) data. Liver scRNAseq data includes matched embryonic, fetal, and adult liver. (B) Flower plot illustrating significantly enriched pathways in YS endoderm (pink) and embryonic liver (EL) hepatocytes (blue). Conserved pathways between tissues are highlighted in green and a dashed outline (data S25). (C) Columns 1-3: IHC staining of alpha fetoprotein (AFP), albumin (ALB) and alpha-1 antitrypsin (SERPINA1) in 8 PCW YS and EL (middle), and adult liver (bottom). Representative images of n=5 YS (4-8 PCW), n=3 ELs (7-8 PCW) and n=3 adult liver samples. Columns 4-5: IHC staining of erythropoietin (EPO) and thrombin (F2) in 7 PCW YS (top), 7 PCW EL (middle), and healthy adult liver (bottom). Representative images from n=3 samples per tissue: YS (4-7 PCW), ELs (7-12 PCW). Protein (brown) and nuclei (blue). Column 6: Martius Scarlet Blue (MSB)-stained 8 PCW EL (representative of n=3) and 4 PCW YS (representative of n=3). Nuclei (gray), erythroid (yellow), fibrin (red), and connective tissue (blue) (data S23). Scale bars: 100 μm. (D) Dot plot showing the mean expression (color) and proportion of cells in YS endoderm, embryonic, fetal and adult liver hepatocytes, and stromal cells from fetal kidney (64). Brackets indicate enriched GO annotations. Green ellipses denote genes with prenatal phenotypes in homozygous null mice. Solid/hollow green outline denotes phenotype onset prior/post fetal liver function respectively, as per fig. S4E (data S25) (E) Dot plot showing the mean expression (color) and proportion of cells expressing Milo-derived DEGs across gestation (dot size) in YS endoderm (data S24). Genes are grouped by function. (F) Schematic of the relative contributions of YS (orange), liver (blue), and BM (purple) to hematopoiesis, coagulation factor, and EPO production in the first trimester of human development.
Fig. 3
Fig. 3. Early versus definitive hematopoiesis in YS and liver.
(A) Dot plot showing mean expression (color) and proportion of cells expressing selected HSPC genes (dot size) in HSPCs from YS (main and gastrulation (14)), liver (EL and fetal/FL (10)), AGM (76), BM (35) and iPSC cultures (iPSC (20) and definitive iPSC (12)). (B) Bar chart showing proportion of early (yellow) to definitive HSPCs (green) in the YS scRNA-seq data grouped by gestational age. (C) Density plots showing YS HSPC (top) and cycling HSPC (bottom) with early (left) and definitive signatures (right) in an integrated landscape as per A. Color: population z-scored KDE (data S5). Tissue contributions are shown in fig. S5E. (D) Representative image of whole ˜4 PCW/CS12 human (top; n=4) and ˜E10.5/CS12 mouse embryo (bottom). Scale bars: 1 mm. (E) Line graphs showing change in erythroid cell proportion (y-axis) enriched in globin gene expression across gestational age. Colors indicate scRNA-seq dataset: Pink: human YS; Red: matched EL. Shape size: cell count; scale: representative counts; No shape: count <500. Globins grouped by roles in early or definitive hematopoiesis, and repression. (F) FDG of hematopoietic cell states in the YS scRNA-seq data (n=8, k=98,738; dots) integrated with human gastrulation (14) scRNA-seq data (n=1, k=91; triangles) (left), and equivalent cell states in the mouse gastrulation scRNA-seq dataset (75) (n=28, k=4,717; dots) (right). Colors represent cell states and clouds mark lineages. (G) Radial plots showing lineage transition probabilities between pre-AGM (CS10-11; left) and post-AGM (>CS14; right) YS early and definitive HSPCs. Color: population z-scored KDE. Density position indicates respective lineage priming probability between macrophage, lymphoid (NK and B lineage), erythroid, and MK terminal states. Arrows indicate proposed lineage priming based on KDE. (H) Radial plots showing lineage transition probabilities between iPSC-derived HSPCs (left) and definitive iPSC-derived HSPCs (right). Interpretation as in G, with addition of embryonic erythroid terminal state.
Fig. 4
Fig. 4. The lifespan of YS HSPCs.
(A) Bar chart showing the relative proportions of YS endothelial cell (EC) subsets by age (PCW). EC: endothelial cells, AEC: arterial endothelial cells, Sin. EC: sinusoidal endothelial cells, and HE: hemogenic endothelium. (B) FDG overlaid with PAGA showing trajectory of HE transition to HSPC in YS scRNA-seq data (n=3; CS10, 11 and 14; k=2,262) (top) and iPSC-derived HSPC scRNA-seq data (n=7, k=437) (20) (bottom), with feature plots of key genes (IL33, ALDH1A1) involved in endothelial to hemogenic transition (data S5). (C) Dot plot showing the mean expression (color scale) and proportion of cells expressing EC-associated genes (dot size) in HSPCs across gestational age (PCW). HSPCs are derived from YS (including gastrulation), AGM (12), matched EL (embryonic liver), FL (fetal liver) (10), fetal BM (35), iPSC-derived HSPC (20) and definitive iPSC-derived HSPC (12) scRNA-seq datasets. (D) Dot plot of the mean expression (color scale) and the fraction of cells expressing each gene (dot size) of curated genes predicted by CellphoneDB to form statistically significant (P<0.05) protein–protein interactions between HSPCs (top plot) and stromal cells (bottom plot) across all time gestational points. Brackets indicate which protein counterparts form complexes (data S29). Data are log-normalized, variance-scaled, and min–max-standardized with a distribution of 0-1. (E) Heatmap showing curated and statistically significant (P<0.05) CellphoneDB-predicted interactions between YS HSPCs and stromal cells that change across gestation. Color scale indicates relative mean expression z-scores. (F) Schematic of selected and statistically significant (P<0.05) CellphoneDB-predicted interactions between YS HSPCs and endoderm, fibroblasts (Fib), smooth muscle cells (SMC), or EC derived from scRNA-seq data. Interactions are grouped by predicted receptor to ECM interactions, ligand—receptor interactions, and surface-bound ligand–receptor interactions. Receptors and ligands in italics significantly decrease at CS17-23 (6-8 PCW) (data S28 and S29).
Fig. 5
Fig. 5. Accelerated macrophage production in YS and iPSC culture.
(A) Left: Line graph of monocyte and macrophage proportions in YS scRNA-seq across time. Dashed line indicates pre- and post-AGM stages. Middle: Milo beeswarm plot showing differential abundance of YS scRNA-seq myeloid neighbourhoods across time. Color shows degree of enrichment (blue: early, red: later) (data S4 and S24). Right: Bar chart of YS scRNA-seq myeloid cell state proportions across time. Mono–mac int. monocyte macrophage intermediate. (B) Dot plot showing the mean expression (color) and proportion of cells expressing monocyte marker genes (dot size) in EL monocytes and YS myeloid cell states. Genes include YS vs EL monocyte DEGs and established monocyte markers (data S17). (C) Left: FDG of macrophage trajectory in YS scRNA-seq, colored by cell state, overlaid with PAGA showing monocyte-independent <CS14 (pre-AGM; n=2; k=3,561; top) and monocyte-dependent trajectories >CS14 (post-AGM; n=6; k=35,962; bottom) (data S5). Right: FDG overlaid with scVelocity directionality, colored by cell cycle gene enrichment (GO:000704 module). (D) Heatmap of regulons associated with trajectories in C. TFs discussed in text highlighted (turquoise: pre-macrophage; purple: monocyte-dependent). (E) Dot plot showing the mean expression (color) and proportion of cells expressing macrophage and microglia marker genes (dot size) in myeloid cell states in YS, AGM (12), skin (49), gonad (50), and brain (56) fetal scRNA-seq datasets (data S13 and S31). (F) Heatmap of significant (P<0.05) CellphoneDB-predicted interactions between YS scRNA-seq TREM2+ macrophages and ECs (data S28). Color represents z-scored expression of gene pairs, brackets indicate top curated interactions for cell-state pairs. (G) FDG of macrophage trajectory in iPSC scRNA-seq (20), colored by cell state, overlaid with PAGA showing monocyte-independent <D21 (n=5; k=779; left) and monocyte-dependent >D21 (n=7; k=8,553; right) transitions (data S7 and S5). (H) Heatmap of regulons associated with iPSC macrophage trajectories shown in G. TFs discussed in text are highlighted as in D.

References

    1. Ross C, Boroviak TE. Origin and function of the yolk sac in primate embryogenesis. Nat Commun. 2020;11:3760. - PMC - PubMed
    1. Cindrova-Davies T, Jauniaux E, Elliot MG, Gong S, Burton GJ, Charnock-Jones DS. RNA-seq reveals conservation of function among the yolk sacs of human, mouse, and chicken. Proc Natl Acad Sci U S A. 2017;114:E4753–E4761. - PMC - PubMed
    1. Yamane T. Mouse Yolk Sac Hematopoiesis. Front Cell Dev Biol. 2018;0 doi: 10.3389/fcell.2018.00080. - DOI - PMC - PubMed
    1. Palis J, Malik J, Mcgrath KE, Kingsley PD. Primitive erythropoiesis in the mammalian embryo. The International Journal of Developmental Biology. 2010;54:1011–1018. - PubMed
    1. Canu G, Ruhrberg C. First blood: the endothelial origins of hematopoietic progenitors. Angiogenesis. 2021;24:199–211. - PMC - PubMed