. 2023 Sep 13;66(9):3413-3427.
doi: 10.1044/2023_JSLHR-22-00713. Epub 2023 Aug 17.

Relating Acoustic Measures to Listener Ratings of Children's Productions of Word-Initial /ɹ/ and /w/

Affiliations

Relating Acoustic Measures to Listener Ratings of Children's Productions of Word-Initial /ɹ/ and /w/

Elizabeth E Ancel et al. J Speech Lang Hear Res. .

Abstract

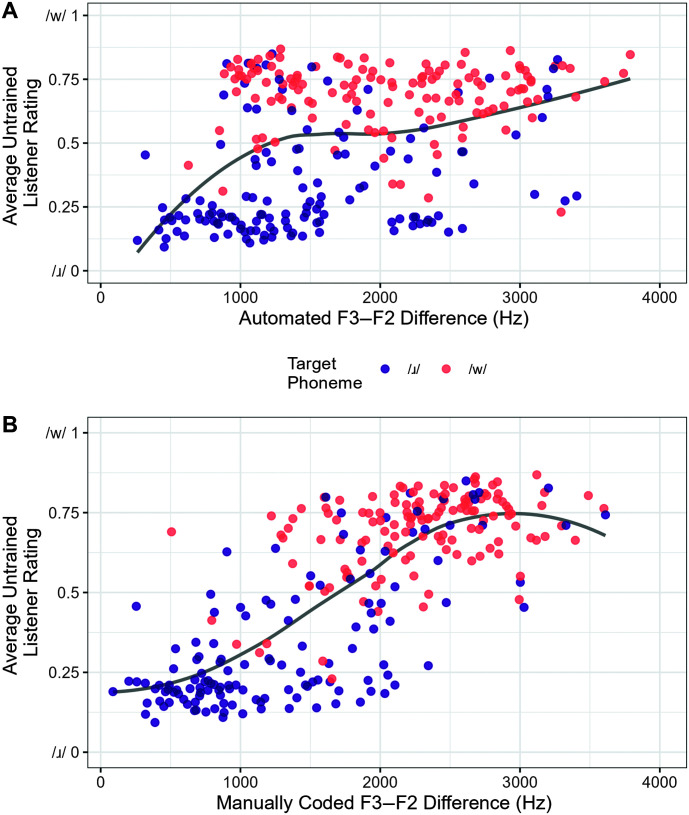
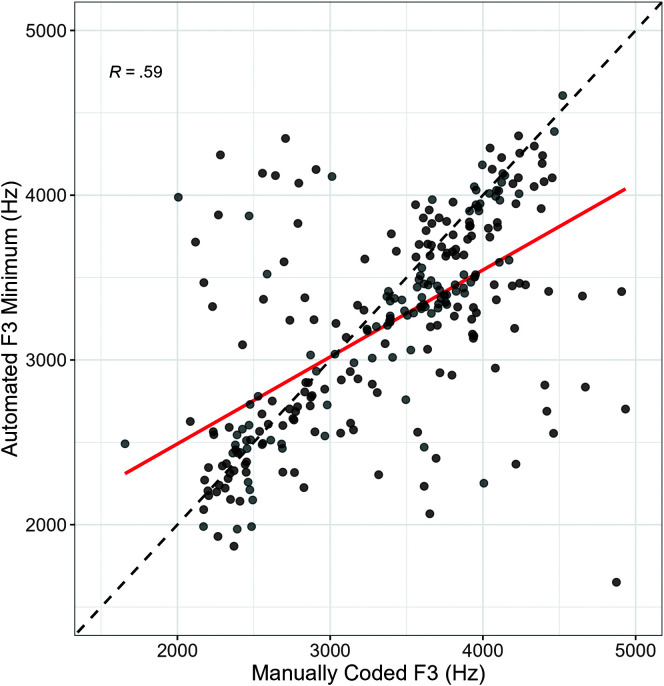
Purpose: The /ɹ/ productions of young children acquiring American English are highly variable and often inaccurate, with [w] as the most common substitution error. One acoustic indicator of the goodness of children's /ɹ/ productions is the difference between the frequency of the second formant (F2) and the third formant (F3), with a smaller F3-F2 difference being associated with a perceptually more adultlike /ɹ/. This study analyzed the effectiveness of automatically extracted F3-F2 differences in characterizing young children's productions of /ɹ/-/w/ in comparison with manually coded measurements.

Method: Automated F3-F2 differences were extracted from productions of a variety of different /ɹ/- and /w/-initial words spoken by 3- to 4-year-old monolingual preschoolers (N = 117; 2,278 tokens in total). These automated measures were compared to ratings of the phoneme goodness of children's productions as rated by untrained adult listeners (n = 132) on a visual analog scale, as well as to narrow transcriptions of the production into four categories: [ɹ], [w], and two intermediate categories.

Results: Data visualizations show a weak relationship between automated F3-F2 differences with listener ratings and narrow transcriptions. Mixed-effects models suggest the automated F3-F2 difference only modestly predicts listener ratings (R 2 = .37) and narrow transcriptions (R 2 = .32).

Conclusion: The weak relationship between automated F3-F2 difference and both listener ratings and narrow transcriptions suggests that these automated acoustic measures are of questionable reliability and utility in assessing preschool children's mastery of the /ɹ/-/w/ contrast.


Figures

Figure 1.
Figure 1.
(A) Distribution of F3–F2 difference values for each narrow transcription category as determined by automated measurements for all 117 children. The left panel shows the F3–F2 difference calculated from the onset of voicing. The right panel shows the minimum F3 value measured across all five time points. Each colored point is a child's token for a given utterance and transcribed into one of four categories: [w], [w]:[ɹ], [ɹ]:[w], and [ɹ]. Mean F3–F2 difference for each transcription category is shown by the large black circle with the numerical value shown below. The median of each box plot is represented by the thick black line. The width of the box plots represents the 25th and 75th percentiles, and the whiskers represent the smallest and largest values 1.5 times the interquartile range. Data points beyond the whiskers are considered extreme values. (B) Distribution of F3–F2 difference values as determined by automated measurements for the sample subset of 14 children. (See Panel A description for more details.) (C) Distribution of F3–F2 difference values as determined by manually coded measurements of the minimum F3 value for the sample subset of 14 children. (See Panel A description for more details). F2 = second formant; F3 = third formant.
Figure 2.
Figure 2.
(A) Relationship between average listener ratings and F3–F2 difference as determined by automated measurements for the sample subset of 14 children. The linear fit line is shown in gray. (B) Relationship between average listener ratings and F3–F2 difference as determined by manually coded measurements for the sample subset of 14 children. The linear fit line is shown in gray. F2 = second formant; F3 = third formant.
Figure 3.
Figure 3.
Relationship between average listener ratings and F3–F2 difference as determined by automated measurements for all 117 children. The linear fit line is shown in gray. F2 = second formant; F3 = third formant.
Figure 4.
Figure 4.
(A) Relationship between the proportion of /ɹ/ and /w/ transcribed as accurate using lenient scoring and the robustness of the /ɹ/−/w/ contrast as determined by the visual analog scale (VAS) ratings. Each circle (gray) represents an individual child. The linear fit line is shown in red. (B) Relationship between the proportion of /ɹ/ and /w/ transcribed as accurate using lenient scoring and the robustness of the /ɹ/−/w/ contrast as determined by the automated acoustic measures. Each circle (gray) represents an individual child. The linear fit line is shown in red.
Figure A1.
Figure A1.
Visual analog scale: A screenshot of the visual analog scale used by untrained listeners to judge how /ɹ/-like or /w/-like they perceived the sound to be. One end is labeled with the text “the ‘r’ sound,” whereas the other end is labeled with the text “the ‘w’ sound.”
Figure A2.
Figure A2.
Relationship between the F3 values obtained from automated measures taken at the time point of the minimum F3 versus manually coded measurements. Each circle (gray) represents the F3 values of a child's utterance for a target word. The theoretical y = x linear fit (dashed) and actual linear fit (red) lines are also shown.
Figure A3.
Figure A3.
Relationship between the F3 values obtained from automated measures taken at the onset of the F3 versus manually coded measurements. Each circle (gray) represents the F3 values of a child's utterance for a target word. The theoretical y = x linear fit (dashed) and actual linear fit (red) lines are also shown.

References

    1. Barreda, S. (2021). Fast track: Fast (nearly) automatic formant-tracking using Praat. Linguistics Vanguard, 7(1), Article 20200051. 10.1515/lingvan-2020-0051 - DOI
    1. Campbell, H. , Harel, D. , Hitchcock, E. , & McAllister Byun, T. (2018). Selecting an acoustic correlate for automated measurement of American English rhotic production in children. International Journal of Speech-Language Pathology, 20(6), 635–643. 10.1080/17549507.2017.1359334 - DOI - PMC - PubMed
    1. Crowe Hall, B. J. (1991). Attitudes of fourth and sixth graders toward peers with mild articulation disorders. Language, Speech, and Hearing Services in Schools, 22(1), 334–340. 10.1044/0161-1461.2201.334 - DOI
    1. Cychosz, M. , Edwards, J. R. , Bernstein Ratner, N. , Torrington Eaton, C. , & Newman, R. S. (2021). Acoustic–lexical characteristics of child-directed speech between 7 and 24 months and their impact on toddlers' phonological processing. Frontiers in Psychology, 12, Article 3186. 10.3389/fpsyg.2021.712647 - DOI - PMC - PubMed
    1. Dalston, R. M. (1975). Acoustic characteristics of English /w, r, l/ spoken correctly by young children and adults. The Journal of the Acoustical Society of America, 57(2), 462–469. 10.1121/1.380469 - DOI - PubMed

Publication types

LinkOut - more resources